

Impact of HLA class I functional divergence on HIV control
- PMID: 38236978
- PMCID: PMC11395297
- DOI: 10.1126/science.adk0777
Impact of HLA class I functional divergence on HIV control
Abstract
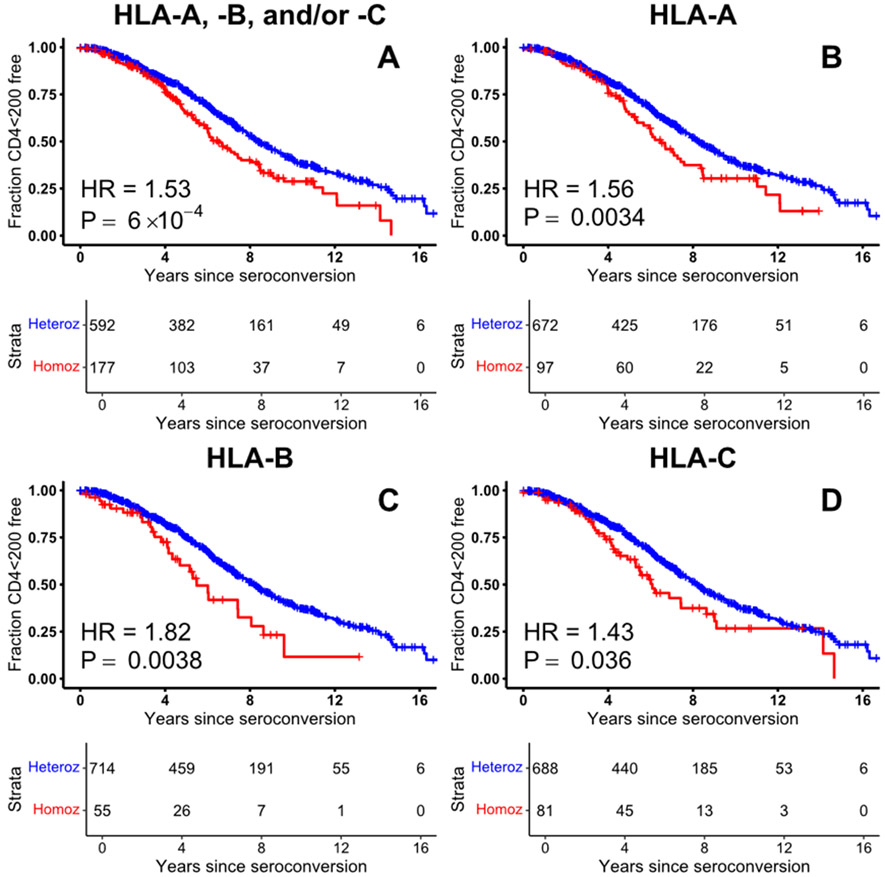
Heterozygosity of Human leukocyte antigen (HLA) class I genes is linked to beneficial outcomes after HIV infection, presumably through greater breadth of HIV epitope presentation and cytotoxic T cell response. Distinct allotype pairs, however, differ in the extent to which they bind shared sets of peptides. We developed a functional divergence metric that measures pairwise complementarity of allotype-associated peptide binding profiles. Greater functional divergence for pairs of HLA-A and/or HLA-B allotypes was associated with slower AIDS progression and independently with enhanced viral load control. The metric predicts immune breadth at the peptide level rather than gene level and redefines HLA heterozygosity as a continuum differentially affecting disease outcome. Functional divergence may affect response to additional infections, vaccination, immunotherapy, and other diseases where HLA heterozygote advantage occurs.
Figures


References
-
- Carrington M et al., HLA and HIV-1: heterozygote advantage and B*35-Cw*04 disadvantage. Science 283, 1748–1752 (1999). - PubMed
-
- Hughes AL, Ota T, Nei M, Positive Darwinian selection promotes charge profile diversity in the antigen-binding cleft of class I major-histocompatibility-complex molecules. Mol Biol Evol 7, 515–524 (1990). - PubMed
-
- Wakeland EK et al., "Ancestral Polymorphisms of MHC Class II Genes: Divergent Allele Advantage," Immunol Res (1990). - PubMed
MeSH terms
Substances
Grants and funding
- UL1 RR025780/RR/NCRR NIH HHS/United States
- U01 AI069450/AI/NIAID NIH HHS/United States
- UL1 RR025008/RR/NCRR NIH HHS/United States
- U01 AI069419/AI/NIAID NIH HHS/United States
- U01 AI069502/AI/NIAID NIH HHS/United States
- U01 AI069513/AI/NIAID NIH HHS/United States
- U01 HL146241/HL/NHLBI NIH HHS/United States
- P30 AI027767/AI/NIAID NIH HHS/United States
- UM1 AI069423/AI/NIAID NIH HHS/United States
- UM1 AI069503/AI/NIAID NIH HHS/United States
- U01 AI069447/AI/NIAID NIH HHS/United States
- U01 HL146333/HL/NHLBI NIH HHS/United States
- U01 AI069474/AI/NIAID NIH HHS/United States
- U01 AI069423/AI/NIAID NIH HHS/United States
- UL1 TR000445/TR/NCATS NIH HHS/United States
- U01 AI069434/AI/NIAID NIH HHS/United States
- U01 AI069467/AI/NIAID NIH HHS/United States
- P30 AI050409/AI/NIAID NIH HHS/United States
- UL1 TR001111/TR/NCATS NIH HHS/United States
- U01 AI069412/AI/NIAID NIH HHS/United States
- U01 AI069496/AI/NIAID NIH HHS/United States
- M01 RR000046/RR/NCRR NIH HHS/United States
- UM1 AI069424/AI/NIAID NIH HHS/United States
- R01 AI077505/AI/NIAID NIH HHS/United States
- U54 AG062334/AG/NIA NIH HHS/United States
- 75N91019D00024/CA/NCI NIH HHS/United States
- UL1 TR001079/TR/NCATS NIH HHS/United States
- U01 AI069465/AI/NIAID NIH HHS/United States
- U01 HL146245/HL/NHLBI NIH HHS/United States
- UL1 RR024996/RR/NCRR NIH HHS/United States
- U01 AI069481/AI/NIAID NIH HHS/United States
- U01 HL146205/HL/NHLBI NIH HHS/United States
- P30 MH116867/MH/NIMH NIH HHS/United States
- U01 AI069470/AI/NIAID NIH HHS/United States
- U01 AI069484/AI/NIAID NIH HHS/United States
- I01 BX000207/BX/BLRD VA/United States
- U01 AI069439/AI/NIAID NIH HHS/United States
- U01 AI069556/AI/NIAID NIH HHS/United States
- UL1 RR024156/RR/NCRR NIH HHS/United States
- U01 AI069418/AI/NIAID NIH HHS/United States
- U01 AI069534/AI/NIAID NIH HHS/United States
- U01 HL146208/HL/NHLBI NIH HHS/United States
- UL1 TR001409/TR/NCATS NIH HHS/United States
- U01 AI069428/AI/NIAID NIH HHS/United States
- P30 MH133399/MH/NIMH NIH HHS/United States
- U01 AI069532/AI/NIAID NIH HHS/United States
- UM1 AI069439/AI/NIAID NIH HHS/United States
- KL2 TR001432/TR/NCATS NIH HHS/United States
- UL1 TR000124/TR/NCATS NIH HHS/United States
- UL1 TR000058/TR/NCATS NIH HHS/United States
- U01 HL146192/HL/NHLBI NIH HHS/United States
- P30 AI045008/AI/NIAID NIH HHS/United States
- UM1 AI069412/AI/NIAID NIH HHS/United States
- UM1 AI068634/AI/NIAID NIH HHS/United States
- U01 AI069501/AI/NIAID NIH HHS/United States
- U01 AI046376/AI/NIAID NIH HHS/United States
- UM1 AI069481/AI/NIAID NIH HHS/United States
- U01 HL146242/HL/NHLBI NIH HHS/United States
- R01 AI058740/AI/NIAID NIH HHS/United States
- TL1 TR001431/TR/NCATS NIH HHS/United States
- U01 AI069432/AI/NIAID NIH HHS/United States
- U01 AI038858/AI/NIAID NIH HHS/United States
- U01 AI046370/AI/NIAID NIH HHS/United States
- P30 AI073961/AI/NIAID NIH HHS/United States
- UL1 TR000439/TR/NCATS NIH HHS/United States
- U01 HL146201/HL/NHLBI NIH HHS/United States
- UL1 RR025777/RR/NCRR NIH HHS/United States
- U01 AI034853/AI/NIAID NIH HHS/United States
- U01 HL146193/HL/NHLBI NIH HHS/United States
- UM1 AI069496/AI/NIAID NIH HHS/United States
- U01 AI069415/AI/NIAID NIH HHS/United States
- U01 AI027666/AI/NIAID NIH HHS/United States
- UL1 RR024160/RR/NCRR NIH HHS/United States
- U01 AI027658/AI/NIAID NIH HHS/United States
- U01 AI069495/AI/NIAID NIH HHS/United States
- U01 AI027675/AI/NIAID NIH HHS/United States
- P30 AI110527/AI/NIAID NIH HHS/United States
- M01 RR000425/RR/NCRR NIH HHS/United States
- U01 AI069511/AI/NIAID NIH HHS/United States
- U01 AI069503/AI/NIAID NIH HHS/United States
- UL1 TR000170/TR/NCATS NIH HHS/United States
- U01 AI025859/AI/NIAID NIH HHS/United States
- UL1 TR001082/TR/NCATS NIH HHS/United States
- UM1 AI106701/AI/NIAID NIH HHS/United States
- UL1 RR025747/RR/NCRR NIH HHS/United States
- U01 HL146204/HL/NHLBI NIH HHS/United States
- U01 AI032782/AI/NIAID NIH HHS/United States
- U01 AI069424/AI/NIAID NIH HHS/United States
- U01 HL146202/HL/NHLBI NIH HHS/United States
- UL1 TR001881/TR/NCATS NIH HHS/United States
- UL1 TR000004/TR/NCATS NIH HHS/United States
- U01 AI069477/AI/NIAID NIH HHS/United States
- U01 HL146240/HL/NHLBI NIH HHS/United States
- UL1 TR000457/TR/NCATS NIH HHS/United States
- U01 AI069494/AI/NIAID NIH HHS/United States
- U01 AI069452/AI/NIAID NIH HHS/United States
- U01 HL146194/HL/NHLBI NIH HHS/United States
- U01 AI069471/AI/NIAID NIH HHS/United States
- UM1 AI068636/AI/NIAID NIH HHS/United States
- UL1 TR003098/TR/NCATS NIH HHS/United States
- U01 AI025868/AI/NIAID NIH HHS/United States
- U01 HL146203/HL/NHLBI NIH HHS/United States
- U01 AI069472/AI/NIAID NIH HHS/United States
LinkOut - more resources
Full Text Sources
Medical
Research Materials
