. 2024 Jan 30;18(4):3053-3072.
doi: 10.1021/acsnano.3c08097. Epub 2024 Jan 18.

An Engineered Bionic Nanoparticle Sponge as a Cytokine Trap and Reactive Oxygen Species Scavenger to Relieve Disc Degeneration and Discogenic Pain

Affiliations

An Engineered Bionic Nanoparticle Sponge as a Cytokine Trap and Reactive Oxygen Species Scavenger to Relieve Disc Degeneration and Discogenic Pain

Wenbo Yang et al. ACS Nano. .

Abstract

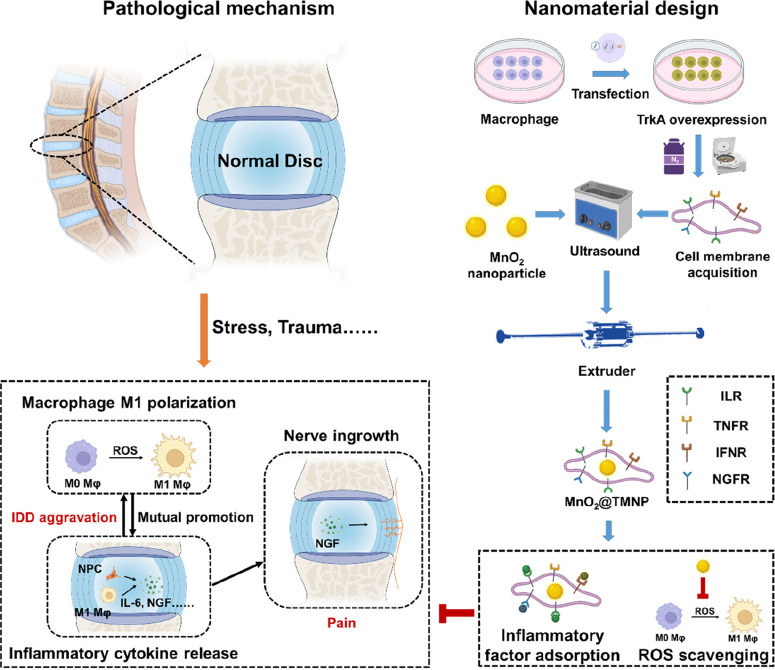
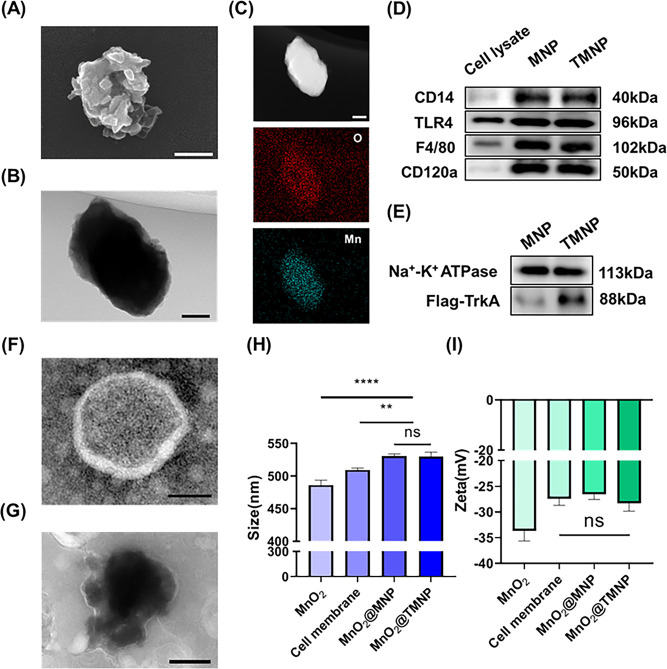
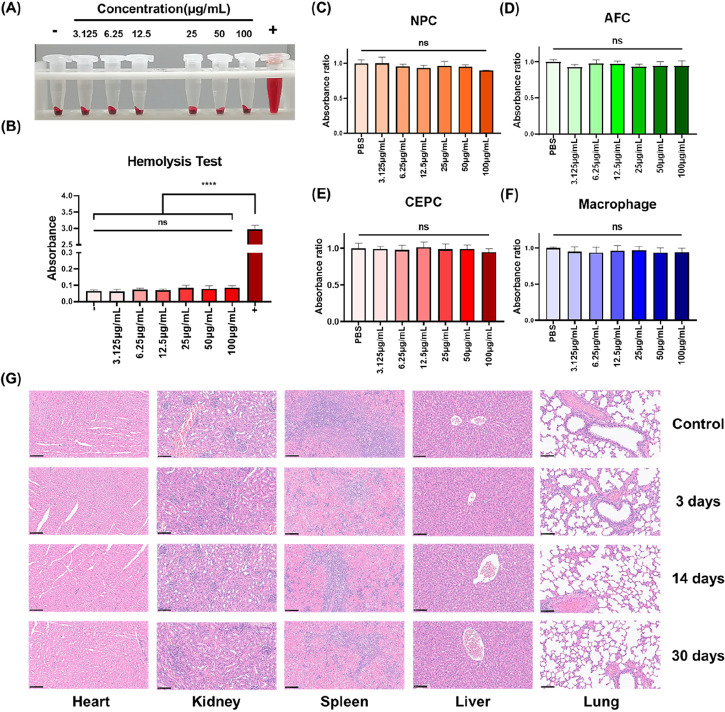
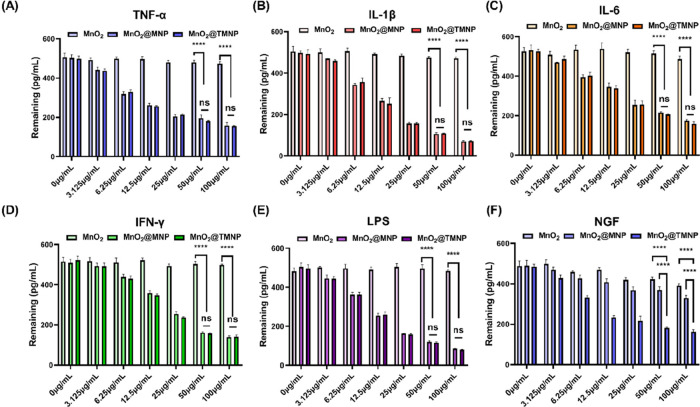
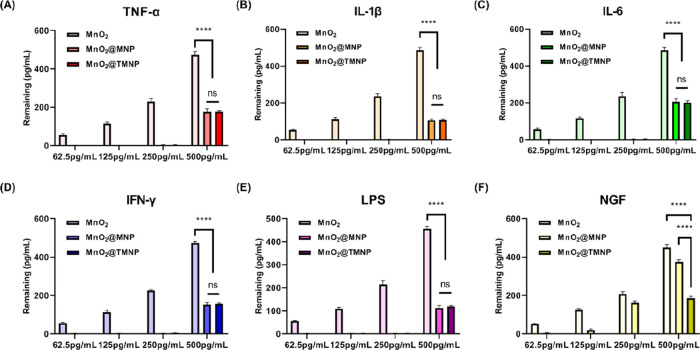
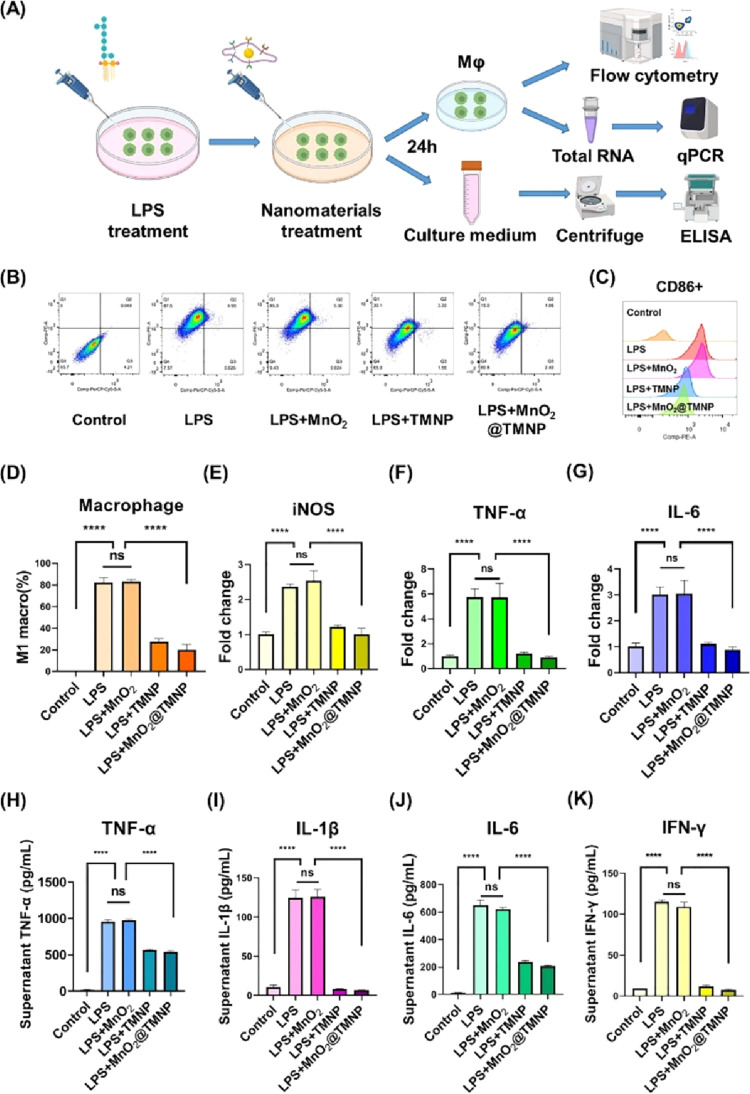
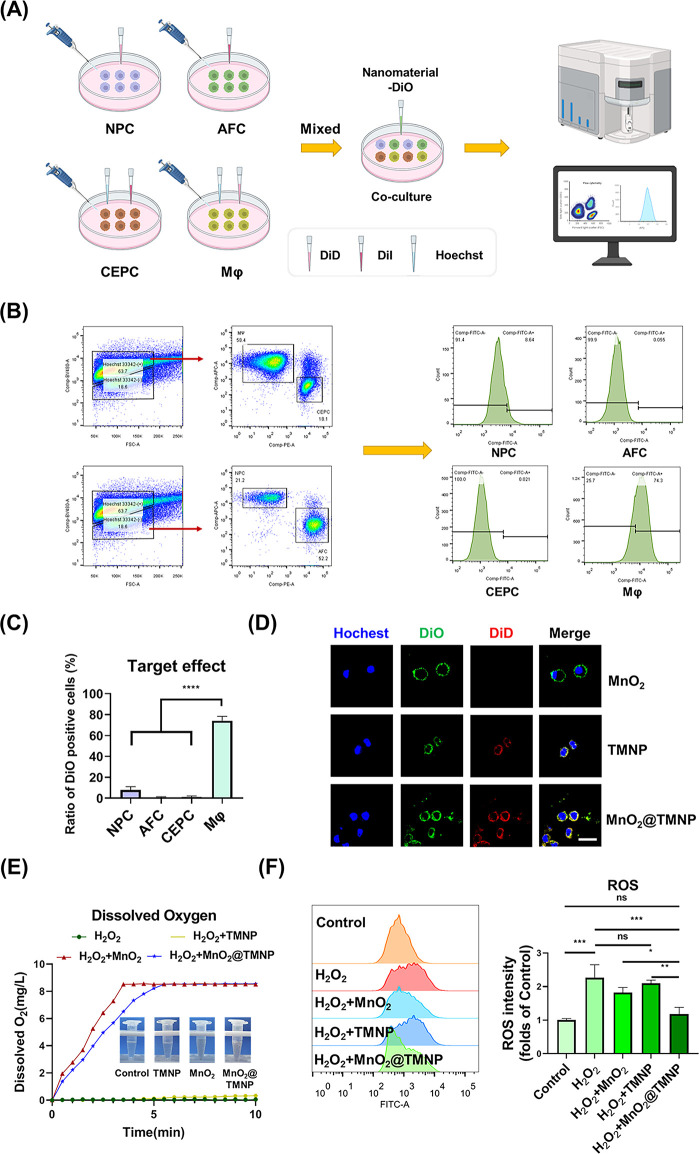
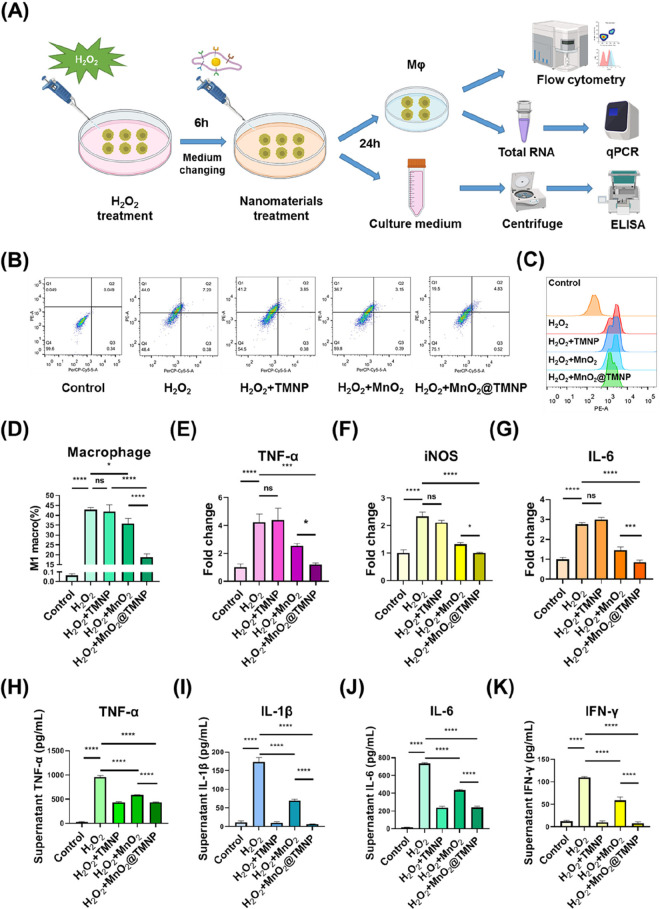
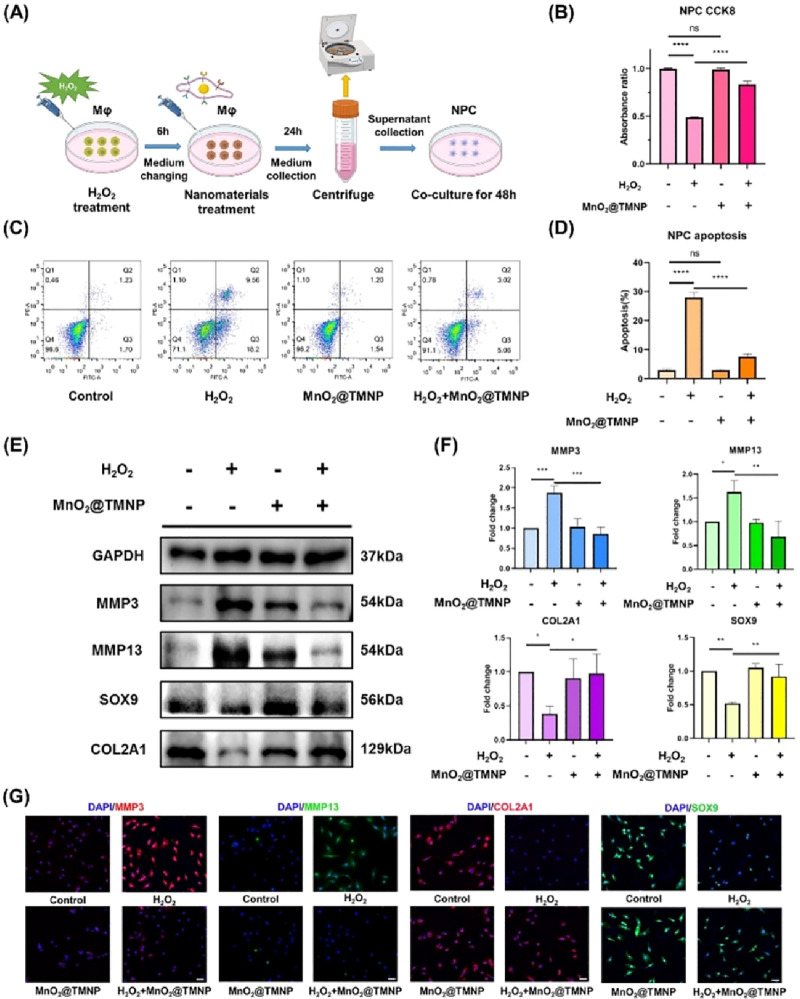
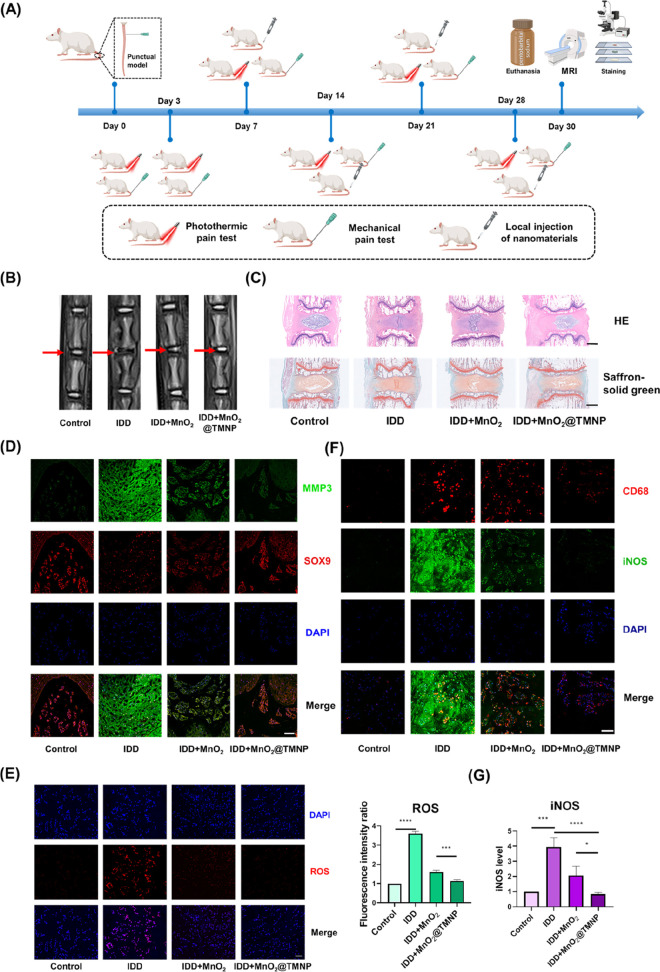
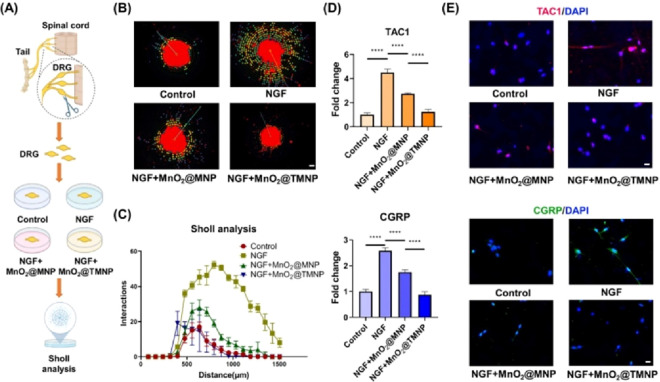
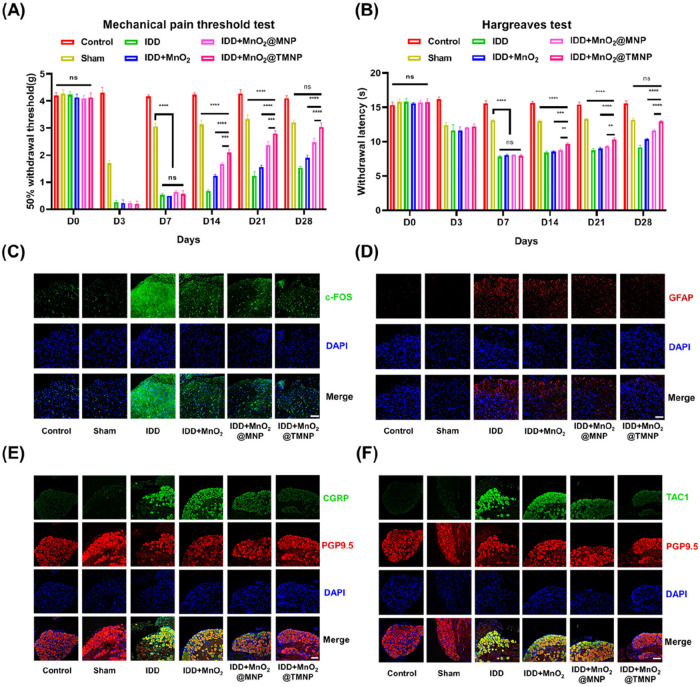
The progressive worsening of disc degeneration and related nonspecific back pain are prominent clinical issues that cause a tremendous economic burden. Activation of reactive oxygen species (ROS) related inflammation is a primary pathophysiologic change in degenerative disc lesions. This pathological state is associated with M1 macrophages, apoptosis of nucleus pulposus cells (NPC), and the ingrowth of pain-related sensory nerves. To address the pathological issues of disc degeneration and discogenic pain, we developed MnO2@TMNP, a nanomaterial that encapsulated MnO2 nanoparticles with a TrkA-overexpressed macrophage cell membrane (TMNP). Consequently, this engineered nanomaterial showed high efficiency in binding various inflammatory factors and nerve growth factors, which inhibited inflammation-induced NPC apoptosis, matrix degradation, and nerve ingrowth. Furthermore, the macrophage cell membrane provided specific targeting to macrophages for the delivery of MnO2 nanoparticles. MnO2 nanoparticles in macrophages effectively scavenged intracellular ROS and prevented M1 polarization. Supportively, we found that MnO2@TMNP prevented disc inflammation and promoted matrix regeneration, leading to downregulated disc degenerative grades in the rat injured disc model. Both mechanical and thermal hyperalgesia were alleviated by MnO2@TMNP, which was attributed to the reduced calcitonin gene-related peptide (CGRP) and substance P expression in the dorsal root ganglion and the downregulated Glial Fibrillary Acidic Protein (GFAP) and Fos Proto-Oncogene (c-FOS) signaling in the spinal cord. We confirmed that the MnO2@TMNP nanomaterial alleviated the inflammatory immune microenvironment of intervertebral discs and the progression of disc degeneration, resulting in relieved discogenic pain.

Keywords: ROS scavenger; biomembrane-coated nanoparticles; cytokine trap; disc degeneration; discogenic pain.


Conflict of interest statement

The authors declare no competing financial interest.

Figures

Scheme 1
Scheme 1. Synthesis and Biological Mechanism of MnO2@TMNP
MnO2 nanoparticles coated with TrkA-overexpressed macrophage membranes (MnO2@TMNP) inhibit M1 polarization by extensively scavenging ROS and decoying proinflammatory cytokines and NGF, ultimately alleviating the progression of disc degeneration and discogenic back pain. Abbreviations: Mφ, macrophage; NGF, nerve growth factor; ROS, reactive oxygen species; ILR, interleukin receptors; TNFR, tumor necrosis factor receptors; IFNR, interferon receptors; NGFR, nerve growth factor receptors (TrkA in this study).
Figure 1
Figure 1
Characterization of the nanomaterials. (A) SEM of the MnO2 nanoparticles. Scale bar: 200 nm. (B) TEM image of MnO2 nanoparticles. Scale bar: 100 nm. (C) HAADF and mapping results of MnO2 nanoparticles. Scale bar: 100 nm. (D) Western blot analysis of CD14, TLR4, F4/80, and CD120a on the membrane of the nanomaterial. (E) Western blot analysis of TrkA on the membrane of the nanomaterial. TEM images of macrophage membrane vesicles (TMNP) (F) and MnO2@TMNP (G). Scale bars: 200 nm. (H) Comparison of particle sizes of MnO2 nanoparticles, cell membrane vesicles, MnO2@MNP, and MnO2@TMNP. (I) Comparison of zeta potentials of MnO2 nanoparticles, cell membrane vesicles, MnO2@MNP, and MnO2@TMNP. Data are presented as the mean ± SD (n = 3): ns, not significant; **, p < 0.01; ****, p < 0.0001 between groups.
Figure 2
Figure 2
Biosafety of MnO2@TMNP nanomaterials. (A) Hemolysis assay of MnO2@TMNP cocultured with rat blood cells. (B) Absorbance test at 541 nm of the supernatant obtained by centrifugation after coculture of MnO2@TMNP and red blood cells. Cell viability after MnO2@TMNP cocultured with nucleus pulposus cells (NPC) (C), annulus fibrosus cells (AFC) (D), cartilage end plate cells (CEPC) (E), and macrophages (F). (G) Histological morphological observation of major organs at different time periods after the injection of MnO2@TMNP into the rat tail vein. Scale bars: 100 μm. Data are presented as the mean ± SD (n = 3): ns, not significant; ****, p < 0.0001 between groups.
Figure 3
Figure 3
Validation of adsorption capacity of nanomaterials with different concentration gradients on inflammatory factors/LPS/NGF. The remaining concentrations of TNF-α (A), IL-1β (B), IL-6 (C), IFN-γ (D), LPS (E), and NGF (F) were detected by an enzyme-linked immunosorbent assay (ELISA), after coculturing with MnO2 nanoparticles, MnO2@MNP nanoparticles, and MnO2@TMNP nanoparticles at different concentrations. The initial concentrations of cytokines, LPS and NGF were 500 pg/mL. Data are presented as the mean ± SD (n = 3): ns, not significant; ****, p < 0.0001 between groups.
Figure 4
Figure 4
Validation of the adsorption capacity of fixed concentrations of nanomaterials to inflammatory cytokines/LPS/NGF with different concentration gradients. The remaining concentrations of TNF-α (A), IL-1β (B), IL-6 (C), IFN-γ (D), LPS (E), and NGF (F) at different initial concentrations were detected, after coculturing with 50 μg/mL MnO2@TMNP. Data are presented as the mean ± SD (n = 3): ns, not significant; ****, p < 0.0001 between groups.
Figure 5
Figure 5
MnO2@TMNP inhibits the LPS-induced M1 polarization of macrophages. (A) Schematic diagram of the experimental design. (B) Flow cytometry detecting F4/80+CD86+ cells and F4/80+CD206+ cells to evaluate the polarization of macrophages. (C) Quantification of the CD86 geomean fluorescence intensity of macrophages according to flow cytometry. (D) Quantification of the proportion of M1 macrophages in each group. The levels of mRNA encoding iNOS (E), TNF-α (F), and IL-6 (G) in macrophages treated with LPS, LPS+MnO2, LPS+TMNP, or LPS+MnO2@TMNP, respectively. The fold change was normalized to the control group. The concentrations of TNF-α (H), IL-1β (I), IL-6 (J), and IFN-γ (K) in the supernatant after treating macrophages with LPS, LPS+MnO2, LPS+TMNP, or LPS+MnO2@TMNP. Data are presented as the mean ± SD (n = 3): ns, not significant; ****, p < 0.0001 between groups.
Figure 6
Figure 6
Ability of MnO2@TMNP to specifically target macrophages for ROS clearance. (A) Flowchart for the evaluation of macrophages taking up nanoparticles. (B) Flow cytometry results of the uptake of DiO-loaded nanoparticles by different cells. (C) Statistical analysis of the positive DiO rate of different cells. (D) Fluorescence images of the fusion of DiD-loaded nanoparticles and DiO-loaded macrophages. Scale bar: 20 μm. (E) Records of dissolved oxygen in water to assess the H2O2 decomposition catalyzed by MnO2@TMNP, MnO2 nanoparticles, or TMNP. (F) Flow cytometry of intracellular ROS indicating the effects of MnO2@TMNP, MnO2 nanoparticles, or TMNP on scavenging ROS. The ROS intensity was normalized to the control group. Data are presented as the mean ± SD (n = 3): ns, not significant; *, p < 0.05; **, p < 0.01; ***, p < 0.001; ****, p < 0.0001 between groups.
Figure 7
Figure 7
MnO2@TMNP inhibits H2O2-induced M1 macrophage polarization. (A) Schematic illustration of the establishment of H2O2-induced macrophage M1 polarization to assess the effects of MnO2@TMNP on alleviating the inflammatory microenvironment. (B) Flow cytometry of macrophage polarization after treatment with H2O2, H2O2+MnO2, H2O2+TMNP, or H2O2+MnO2@TMNP. (C) CD86 geomean fluorescence intensity of macrophages according to flow cytometry. (D) Quantification of the proportion of M1 macrophages in each group. The mRNA content of TNF-α (E), iNOS (F), and IL-6 (G) in macrophages treated with H2O2, H2O2+MnO2, H2O2+TMNP, or H2O2+MnO2@TMNP. The fold change was normalized to the control group. The concentrations of TNF-α (H), IL-1β (I), IL-6 (J), and IFN-γ (K) in the supernatant after treating macrophages with H2O2, H2O2+MnO2, H2O2+TMNP, or H2O2+MnO2@TMNP. Data are presented as the mean ± SD (n = 3): ns, not significant; *, p < 0.05; **, p < 0.01; ***, p < 0.001; ****, p < 0.0001 between groups.
Figure 8
Figure 8
MnO2@TMNP alleviated cell death and matrix degradation in a proinflammatory microenvironment. (A) Schematic illustration of the establishment of an inflammatory microenvironment for NPCs to evaluate the protective effects of MnO2@TMNP. (B) Viability of NPCs treated by supernatant extracted from macrophages that had been treated with H2O2, MnO2@TMNP, or a combination of H2O2 and MnO2@TMNP. (C) Flow cytometry results of annexin V/PI staining of NPCs cultured with the supernatant. (D) Quantification of the apoptosis rate by the sum of the proportion of annexin V+ PI– and annexin V+ PI+ cells. (E) Western blot detection of the expression levels of catabolic proteins (MMP3 and MMP13) and anabolic proteins (COL2A1 and SOX9) in treated NPCs. (F) Densitometric analysis of matrix-related proteins in NPCs treated with supernatant. The fold change was normalized to the H2O2 (−)/MnO2@TMNP (−) group. (G) Immunofluorescence staining of MMP3, MMP13, COL2A1, and SOX9 in treated NPCs. Scale bars: 50 μm. Data are presented as the mean ± SD (n = 3); ns, not significant; *, p < 0.05; **, p < 0.01; ***, p < 0.001; ****, p < 0.0001 between groups.
Figure 9
Figure 9
Protective effects of MnO2@TMNP against disc degeneration by modulating the oxidative and inflammatory microenvironment. (A) Flowchart of the timing of in vivo experiments to evaluate the effects of MnO2@TMNP on disc regeneration. (B) Representative T2-weighted MRI images of surgically punctured caudal vertebral discs of the control group, IDD group, IDD+MnO2 group, and IDD+MnO2@TMNP group. The red arrow marks the modeled section. (C) HE staining and Safranin O solid green staining of target segments of IVDs in different treatment groups. Scale bars: 1 mm. (D) Immunofluorescence staining of MMP3 and SOX9 in the surgically punctured IVD in different treatment groups. Scale bar: 100 μm. (E) Immunofluorescence staining and quantification of ROS in the surgically punctured IVD in different treatment groups. The fold change was normalized to control group. Scale bar: 50 μm. (F) Costaining of CD68 and iNOS to indicate the presence of M1-type macrophages in the surgically punctured IVD in different treatment groups. Scale bar: 100 μm. (G) The relative expression level of iNOS (normalized to control group). Data are presented as the mean ± SD (n = 3): ***, p < 0.001; ****, p < 0.0001 between groups.
Figure 10
Figure 10
MnO2@TMNP reduces sensory nerve growth and sensitization. (A) Schematic of the isolation, culture, and evaluation of DRGs. (B) Immunofluorescence staining of NF200 showing the axon growth pattern of DRGs cultured in NGF with or without nanoparticles. Scale bar: 200 μm. (C) Sholl analysis showing the effect of nanoparticles on NGF-promoted neurite growth in the ex vivo cultured DRG model. (D) The mRNA expression of TAC1 and CGRP of neurocytes treated with NGF, NGF+MnO2@MNP, or NGF+MnO2@TMNP. The fold change was normalized to the control group. (E) Immunofluorescence experiments showing the expression of TAC1 and CGRP in neurocytes after different treatments. Scale bars: 20 μm. Data are presented as the mean ± SD (n = 3): ****, p < 0.0001.
Figure 11
Figure 11
MnO2@TMNP disrupts the pain signaling pathway and relieves discogenic pain. (A) 50% withdrawal thresholds detected by the von Frey test showing the mechanical threshold in the sham group, IDD group, IDD+MnO2 group, IDD+MnO2@MNP group, and IDD+MnO2@TMNP group. (B) Hargreaves tests detecting painful behavior in response to heat stimulation of different groups. (C) c-FOS immunofluorescence staining of the spinal cord corresponding to caudal vertebral segments after different treatments. Scale bar: 50 μm. (D) GFAP immunofluorescence staining of the spinal cord corresponding to caudal vertebral segments. Scale bar: 50 μm. (E) CGRP immunofluorescence staining of DRGs innervating the coccygeal vertebrae. Scale bar: 100 μm. (F) TAC1 immunofluorescence staining of DRGs innervating the coccygeal vertebrae. Scale bar: 100 μm. Data are presented as the mean ± SD (n = 3): ns, not significant; **, p < 0.01; ***, p < 0.001; ****, p < 0.0001.

References

    1. Sinkemani A.; Wang F.; Xie Z.; Chen L.; Zhang C.; Wu X. Nucleus Pulposus Cell Conditioned Medium Promotes Mesenchymal Stem Cell Differentiation into Nucleus Pulposus-Like Cells under Hypoxic Conditions. Stem cells international 2020, 2020, 8882549.10.1155/2020/8882549. - DOI - PMC - PubMed
    1. Pan H.; Strickland A.; Madhu V.; Johnson Z. I.; Chand S. N.; Brody J. R.; Fertala A.; Zheng Z.; Shapiro I. M.; Risbud M. V. RNA binding protein HuR regulates extracellular matrix gene expression and pH homeostasis independent of controlling HIF-1α signaling in nucleus pulposus cells. Matrix biology: journal of the International Society for Matrix Biology 2019, 77, 23–40. 10.1016/j.matbio.2018.08.003. - DOI - PMC - PubMed
    1. Bento T. P. F.; Genebra C.; Maciel N. M.; Cornelio G. P.; Simeão S.; Vitta A. Low back pain and some associated factors: is there any difference between genders?. Brazilian journal of physical therapy 2020, 24, 79–87. 10.1016/j.bjpt.2019.01.012. - DOI - PMC - PubMed
    1. Casser H. R.; Seddigh S.; Rauschmann M. Acute Lumbar Back Pain. Deutsches Arzteblatt international 2016, 113, 223–34. 10.3238/arztebl.2016.0223. - DOI - PMC - PubMed
    1. Mohd Isa I. L.; Teoh S. L.; Mohd Nor N. H.; Mokhtar S. A. Discogenic Low Back Pain: Anatomy, Pathophysiology and Treatments of Intervertebral Disc Degeneration. International journal of molecular sciences 2023, 24, 208.10.3390/ijms24010208. - DOI - PMC - PubMed

Publication types