. 2024 May 3;26(5):826-839.
doi: 10.1093/neuonc/noad257.

Triggering receptor expressed on myeloid cells 2 (TREM2) regulates phagocytosis in glioblastoma

Affiliations

Triggering receptor expressed on myeloid cells 2 (TREM2) regulates phagocytosis in glioblastoma

Mekenzie M Peshoff et al. Neuro Oncol. .

Abstract

Background: Glioblastomas (GBMs) are central nervous system tumors that resist standard-of-care interventions and even immune checkpoint blockade. Myeloid cells in the tumor microenvironment can contribute to GBM progression; therefore, emerging immunotherapeutic approaches include reprogramming these cells to achieve desirable antitumor activity. Triggering receptor expressed on myeloid cells 2 (TREM2) is a myeloid signaling regulator that has been implicated in a variety of cancers and neurological diseases with contrasting functions, but its role in GBM immunopathology and progression is still under investigation.

Methods: Our reverse translational investigations leveraged single-cell RNA sequencing and cytometry of human gliomas to characterize TREM2 expression across myeloid subpopulations. Using 2 distinct murine glioma models, we examined the role of Trem2 on tumor progression and immune modulation of myeloid cells. Furthermore, we designed a method of tracking phagocytosis of glioma cells in vivo and employed in vitro assays to mechanistically understand the influence of TREM2 signaling on tumor uptake.

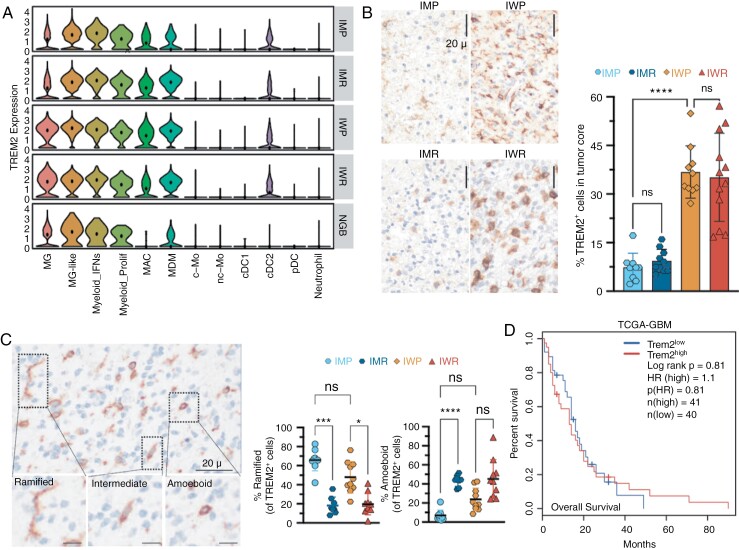
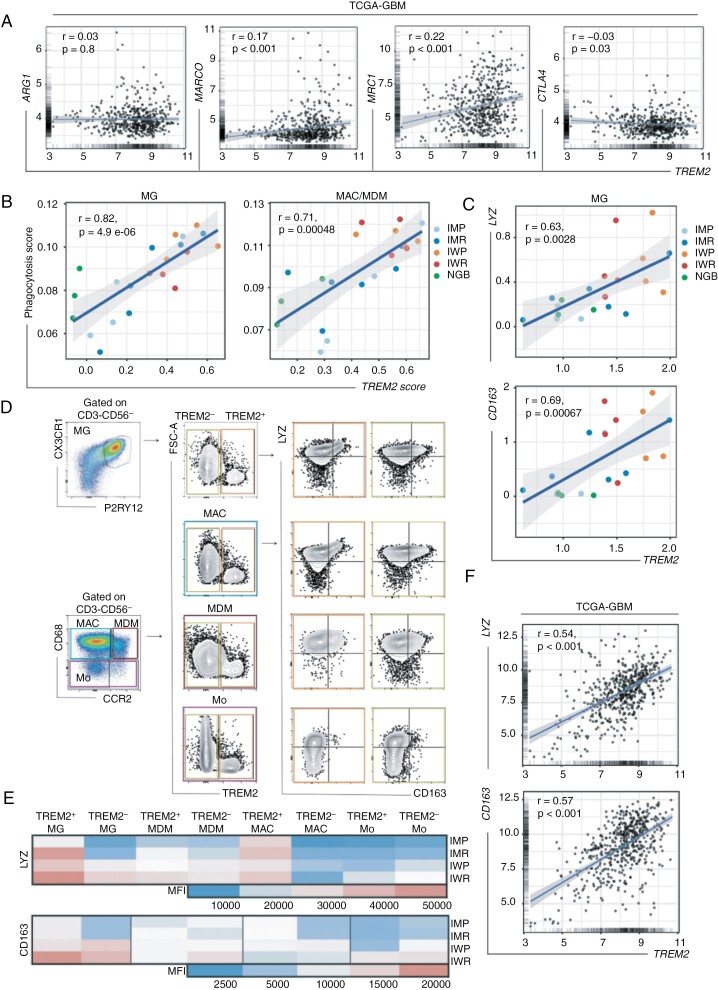
Results: We discovered that TREM2 expression does not correlate with immunosuppressive pathways, but rather showed strong a positive association with the canonical phagocytosis markers lysozyme (LYZ) and macrophage scavenger receptor (CD163) in gliomas. While Trem2 deficiency was found to be dispensable for gliomagenesis, Trem2+ myeloid cells display enhanced tumor uptake compared to Trem2- cells. Mechanistically, we demonstrate that TREM2 mediates phagocytosis via Syk signaling.

Conclusions: These results indicate that TREM2 is not associated with immunosuppression in gliomas. Instead, TREM2 is an important regulator of phagocytosis that may be exploited as a potential therapeutic strategy for brain tumors.

Keywords: TREM2; glioblastoma; microglia; phagocytosis.


Figures

Figure 1.
Figure 1.
TREM2 is associated with myeloid cells across glioma pathologies and is highly expressed in IDH-wt GBMs. (A) Violin plot showing TREM2 transcript expression in myeloid cell subsets across human gliomas (n = 18) stratified as IMP, IMR, IWP, and IWR and 3 NGB. Clinical characteristics of the patient cohort and myeloid cell types are defined previously. (B-C) Representative IHC staining of TREM2 in human gliomas obtained from GLASS consortium derived FFPE archival tissue as follows: IMP (n = 9), IMR (n = 10), IWP (n = 10), and IWR (n = 12), scale bar = 20 µm. (B) TREM2 + cells (left panel) and corresponding bar graphs representing %TREM2+ cells as mean +/− SD in different glioma subtypes (right panel). (C) Magnified areas showing ramified, intermediate, and amoeboid morphology of TREM2+ cells (left panel). Scatter plots representing % of stated morphology of TREM2+ cells as mean ± SD in different glioma subtypes (right panel). In (B and C), each data point represents an average of %TREM2+ cells of three independent tumor regions per patient. Error bars indicate SD of mean. Statistical significance was determined using one-way ANOVA followed by Tukey’s multiple comparison test. ****P < 0.0001, ***P < 0.001, *P < 5, ns = not significant. (D) Kaplan–Meier survival curve showing percent survival of patients stratified by TREM2high (top 25%) and TREM2low (bottom 25%) from TCGA-GBM dataset. Statistical significance was determined using the log-rank test. The number of samples in each group is shown in the inset.
Figure 2.
Figure 2.
TREM2 is associated with phagocytosis but not immunosuppression in gliomas. (A) Linear regression plots (with corresponding r and p-values) showing correlation between TREM2 (x axis) and indicated immunosuppressive genes (y axis) from TCGA-GBM HG-U133A. r value was computed using Pearson’s product-moment correlation. Plots were generated using the GlioVis portal. (B and C) Scatter plots (with corresponding r and P-values) showing the Spearman correlation of (B) mean scores of TREM2 versus phagocytosis pathway genes across glioma patients in MG (left) and MAC/MDM (right) or (C) mean gene expression of TREM2 versus LYZ (top) and TREM2 vs CD163 expression (bottom) in MG across glioma patients derived from our sc-RNAseq dataset (Gupta et al., 2022). The blue line in the plot represents the best fit linear regression line, while the gray shadow denotes the confidence interval (95%). Dots are colored by their pathology group. (D) Representative flow cytometry plots showing gating strategy for expression of LYZ and CD163 on TREM2+ and TREM2- myeloid cell types defined as MG (P2RY12 + CX3CR1 + gated on CD3-CD56-), MAC (CD68+ CCR2-), MDM (CD68+ CCR2+), and Mo (CD68- CCR2+ gated on CD3-CD56-). (E) Heatmap showing MFI of LYZ and CD163 in TREM2+ vs TREM2- myeloid cell types (MG, MAC, MDM, Mo). Data was derived from cytometry evaluations the Gupta et al. 2022. (F) Linear regression plots (with corresponding r and P-values) showing a correlation between TREM2 vs LYZ and TREM2 vs CD163 in TCGA-GBM HG-U133A datasets.
Figure 3.
Figure 3.
TREM2 deletion does not improve survival in mouse models of glioma. (A) KaplanMeier curve showing % survival in glioma (GL261-luc) bearing WT (purple; n = 14) and Trem2-/- (pink; n = 12) mice. Statistical significance was determined using the Log-rank test at indicated P value. (B) Quantification of bioluminescence in WT and Trem2-/- mice bearing GL261-luc at day 1, 9, 15, 21 -tumor implantation. Each point represents average radiance (p/sec/cm2/sr) values as (log) +/− SD. Statistical significance was determined using Mann–Whitney U test at *P < 0.05. (C) KaplanMeier curve showing % survival in glioma (CT-2A-luc) bearing WT −(purple; n = 9) and Trem2-/- (pink; n = 10) mice. Statistical significance was determined using Log-rank test at the indicated P value. (D) Quantification of bioluminescence in WT and Trem2-/- mice bearing CT-2A-luc at day 1, 9, 16, 23 post-tumor implantation. Each point represents average radiance (p/sec/cm2/sr) values as (log) ± SD. Statistical significance was determined using Mann–Whitney U test at *P < 0.05. (E) H&E staining of glioma bearing brains of WT vs Trem2−/− 21 days after CT-2A implantation. Scale bar = 2 mm. (F and G) Representative IHC staining of Ki-67 in the tumor core of CT-2A bearing WT vs Trem2−/− mice (Scale bar = 20 µm) is shown in (F) and corresponding bar graphs depicting %Ki-67+ cells as mean ± SD is shown in (G) 21 days after tumor implantation. Error bars indicate SD of the mean. Statistical significance was determined using a Mann–Whitney U test at ****P < 0.0001. Data are presented from 29 tumor core regions from five mice per group, which were assessed blinded by two experimentalists, and pooled. (H) Boxplots showing the distribution of normalized log2 transformed counts from nanoString nCounter data of Trem2, C3, Tgm2, Mertk, and Syk genes between WT and Trem2−/− mice (n = 5 mice per group). Statistical significance was determined by an independent two sample t-test at **P < 0.01, *P < 0.05.
Figure 4.
Figure 4.
Trem2+ myeloid cells exhibit enhanced tumor uptake capacity. (A) Illustration outlining the experimental design of CT-2A-ZsG implantation, phagocytic tumor uptake by myeloid cells, and fluorescence detection via flow cytometry. Schematic created using BioRender. (B) The flow cytometry contour plots show proportions of Trem2 and ZsG on MG, MAC and DC (left), and corresponding scatter plots showing proportions as mean +/− SD of % ZsG tumor uptake by Trem2+ and Trem2 of the indicated cell types from glioma bearing WT mice 22 days post-tumor implantation. Error bars indicate the SD of mean. Statistical significance was determined using the Wilcoxon signed-rank test at *P<0.05. (C and D) Representative flow cytometry pseudocolor plots depicting a sequential gating of CD45 vs ZsG (gated on live cells), CD11b vs FSC-A (gated on CD45+ cells) and Trem2 vs ZsG (gated on CD11b+ cells) in (C) and corresponding representative microscopic IF image (scale bar = 100 µm) of flow-sorted Trem2+ZsGreen+ cells (concentrated by cytospin) as shown in (D) from glioma bearing WT mice post 22 days post-tumor implantation.
Figure 5.
Figure 5.
TREM2 mediates phagocytosis via the Syk pathway. (A) Western blot showing expression of TREM2, Syk, p-Syk, mTOR, p-mTOR, p70S6K, and p-p70S6K in EV or TREM2-overexpressing HMC3 cells. For inflammatory groups, cells were incubated overnight with a cytokine cocktail (IL-1α, IL-1β, IL-6, TNF-α, IFN-γ, 5 ng/ml each). (B) Representative IF images of pHrodo particles (red) within HMC3 transduced with empty vector (EV-HMC3) or TREM2 (TREM2-HMC3) are shown (top panel). The lentiviral vectors used for transduction express GFP. Representative IF images of pHrodo incubation with TREM2-HMC3 treated with either Syk inhibitor or mTOR inhibitor for 2 h before phagocytosis assay (bottom panel). Scale bar = 100 µm. (C) Bar graph representing proportions of % phagocytosis as mean ± SD of EV-HMC3, TREM2-HMC3, TREM2-HMC3 with Syk inhibitor, and TREM2-HMC3 with mTOR inhibitor. Triplicates from 4 independent experiments were pooled for analysis and error bars represent the SD of the mean. Statistical significance was determined by one-way ANOVA; ****P < 0.0001, ns = not significant.

Update of

Comment in

References

    1. Ostrom QT, et al.. CBTRUS statistical report: primary brain and central nervous system tumors diagnosed in the United States in 2008–2012. Neuro Oncol. 2015;17(Suppl 4):iv1–iv62. - PMC - PubMed
    1. Stupp R, Mason WP, van den Bent MJ, et al.. European Organisation for Research and Treatment of Cancer Brain Tumor and Radiotherapy Groups. Radiotherapy plus concomitant and adjuvant temozolomide for glioblastoma. N Engl J Med. 2005;352(10):987–996. - PubMed
    1. Hegi ME, Diserens A-C, Gorlia T, et al.. MGMT gene silencing and benefit from temozolomide in glioblastoma. N Engl J Med. 2005;352(10):997–1003. - PubMed
    1. Reardon DA, Brandes AA, Omuro A, et al.. Effect of nivolumab vs bevacizumab in patients with recurrent glioblastoma: the checkmate 143 phase 3 randomized clinical trial. JAMA Oncol. 2020;6(7):1003–1010. - PMC - PubMed
    1. Sade-Feldman M, Yizhak K, Bjorgaard SL, et al.. Defining T cell states associated with response to checkpoint immunotherapy in melanoma. Cell. 2018;175(4):998–1013.e20. - PMC - PubMed

Publication types