

Thalamo-cortical evoked potentials during stimulation of the dentato-rubro-thalamic tract demonstrate synaptic filtering
- PMID: 38237402
- PMCID: PMC10903089
- DOI: 10.1016/j.neurot.2023.10.005
Thalamo-cortical evoked potentials during stimulation of the dentato-rubro-thalamic tract demonstrate synaptic filtering
Abstract
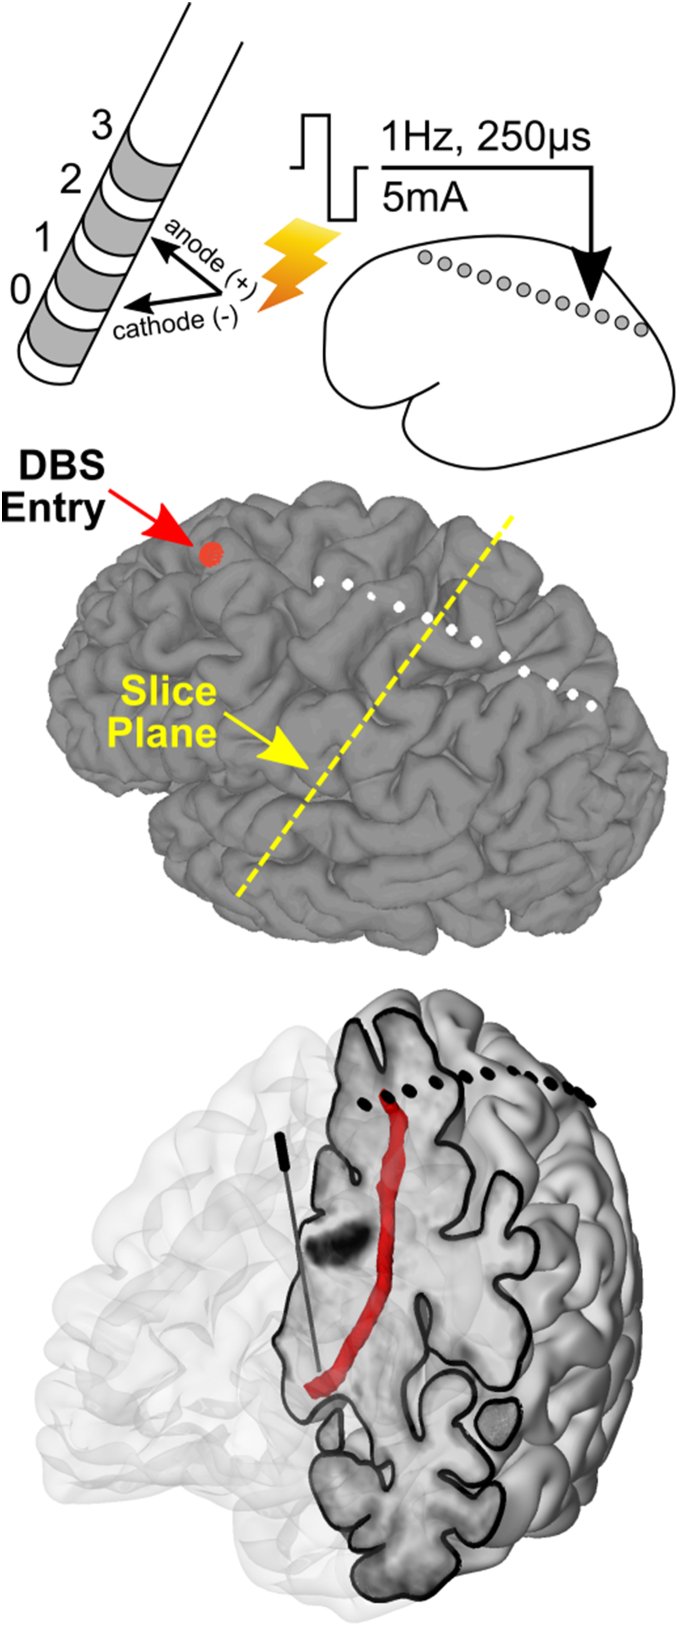
Essential tremor DBS targeting the ventral intermediate nucleus (Vim) of the thalamus and its input, the dentato-rubro-thalamic tract (DRTt), has proven to be an effective treatment strategy. We examined thalamo-cortical evoked potentials (TCEPs) and cortical dynamics during stimulation of the DRTt. We recorded TCEPs in primary motor cortex during clinical and supra-clinical stimulation of the DRTt in ten essential tremor patients. Stimulation was varied over pulse amplitude (2-10 mA) and pulse width (30-250 μs) to allow for strength-duration testing. Testing at clinical levels (3 mA, 60 μs) for stimulation frequencies of 1-160 Hz was performed and phase amplitude coupling (PAC) of beta phase and gamma power was calculated. Primary motor cortex TCEPs displayed two responses: early and all-or-none (<20 ms) or delayed and charge-dependent (>50 ms). Strength-duration curve approximation indicates that the chronaxie of the neural elements related to the TCEPs is <200 μs. At the range of clinical stimulation (amplitude 2-5 mA, pulse width 30-60 μs), TCEPs were not noted over primary motor cortex. Decreased pathophysiological phase-amplitude coupling was seen above 70 Hz stimulation without changes in power spectra and below the threshold of TCEPs. Our findings demonstrate that DRTt stimulation within normal clinical bounds does not excite fibers directly connected with primary motor cortex but that supra-clinical stimulation can excite a direct axonal tract. Both clinical efficacy and phase-amplitude coupling were frequency-dependent, favoring a synaptic filtering model as a possible mechanism of action.
Keywords: Deep brain stimulation; Essential tremor; Evoked potential; Phase-amplitude coupling.
Copyright © 2023 The Author(s). Published by Elsevier Inc. All rights reserved.
Conflict of interest statement
Declaration of competing interest The authors declare that they have no known competing financial interests or personal relationships that could have appeared to influence the work reported in this paper.
Figures


Similar articles
-
Deep brain stimulation for essential tremor: targeting the dentato-rubro-thalamic tract?Neuromodulation. 2015 Feb;18(2):105-12. doi: 10.1111/ner.12238. Epub 2014 Sep 11. Neuromodulation. 2015. PMID: 25209587
-
Comparison of tractography-assisted to atlas-based targeting for deep brain stimulation in essential tremor.Mov Disord. 2018 Dec;33(12):1895-1901. doi: 10.1002/mds.27463. Epub 2018 Sep 5. Mov Disord. 2018. PMID: 30187527
-
Mediation of Tremor Control by the Decussating and Nondecussating Part of the Dentato-Rubro-Thalamic Tract in Deep Brain Stimulation in Essential Tremor: Which Part Should Be Stimulated?Neuromodulation. 2023 Dec;26(8):1668-1679. doi: 10.1016/j.neurom.2022.04.040. Epub 2022 Jun 15. Neuromodulation. 2023. PMID: 35715283
-
The role of tractography in the localization of the Vim nucleus of the thalamus and the dentato-rubro-thalamic tract for the treatment of tremor.Neurologia (Engl Ed). 2022 Oct;37(8):691-699. doi: 10.1016/j.nrl.2019.09.006. Epub 2020 Jan 6. Neurologia (Engl Ed). 2022. PMID: 31917004 Review. English, Spanish.
-
Determining an efficient deep brain stimulation target in essential tremor - Cohort study and review of the literature.Parkinsonism Relat Disord. 2021 Aug;89:54-62. doi: 10.1016/j.parkreldis.2021.06.019. Epub 2021 Jun 29. Parkinsonism Relat Disord. 2021. PMID: 34225135 Review.
Cited by
-
Comparison of structural connectomes for modeling deep brain stimulation pathway activation.Neuroimage. 2025 May 15;312:121211. doi: 10.1016/j.neuroimage.2025.121211. Epub 2025 Apr 11. Neuroimage. 2025. PMID: 40222498 Free PMC article.
-
Targeting the fundamentals for tremors: the frequency and amplitude coding in essential tremor.J Biomed Sci. 2025 Feb 10;32(1):18. doi: 10.1186/s12929-024-01112-8. J Biomed Sci. 2025. PMID: 39924504 Free PMC article. Review.
References
MeSH terms
Grants and funding
LinkOut - more resources
Full Text Sources
Medical
Miscellaneous
