. 2024 Feb 1;31(2):196-211.e6.
doi: 10.1016/j.stem.2023.12.012. Epub 2024 Jan 17.

SARS-CoV-2 infection causes dopaminergic neuron senescence

Affiliations

SARS-CoV-2 infection causes dopaminergic neuron senescence

Liuliu Yang et al. Cell Stem Cell. .

Abstract

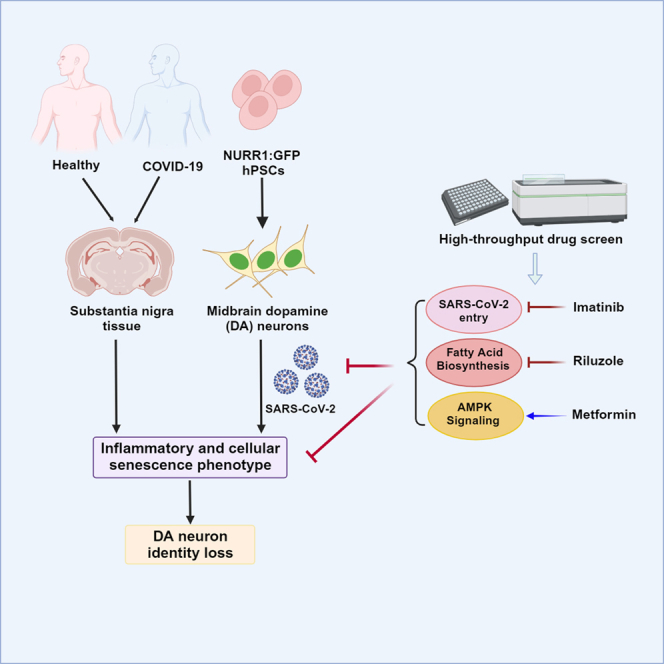
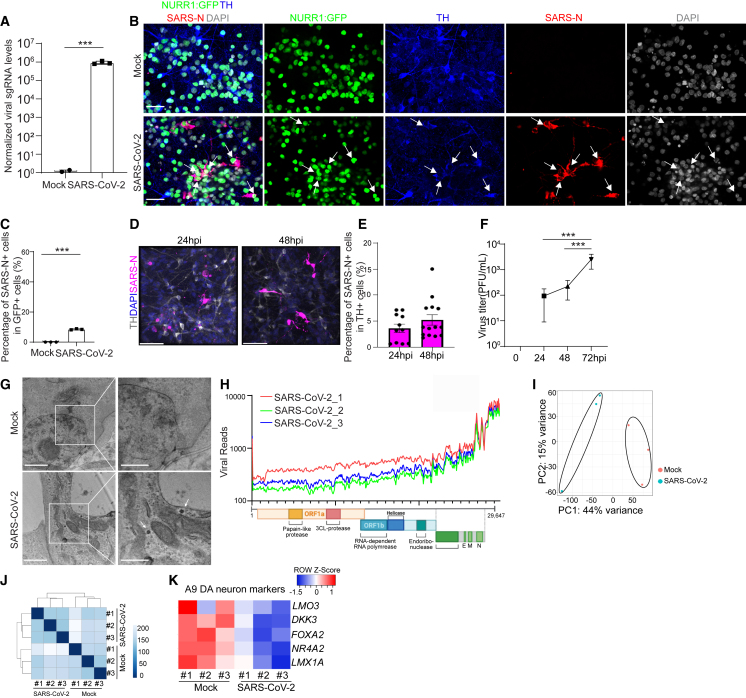
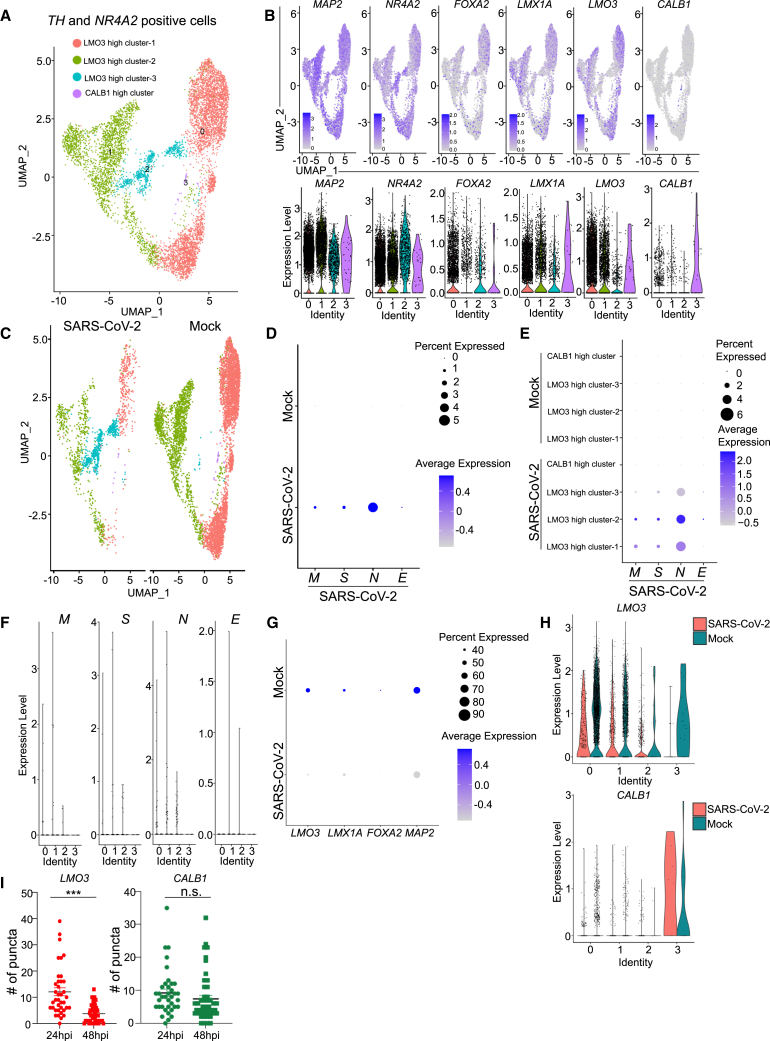
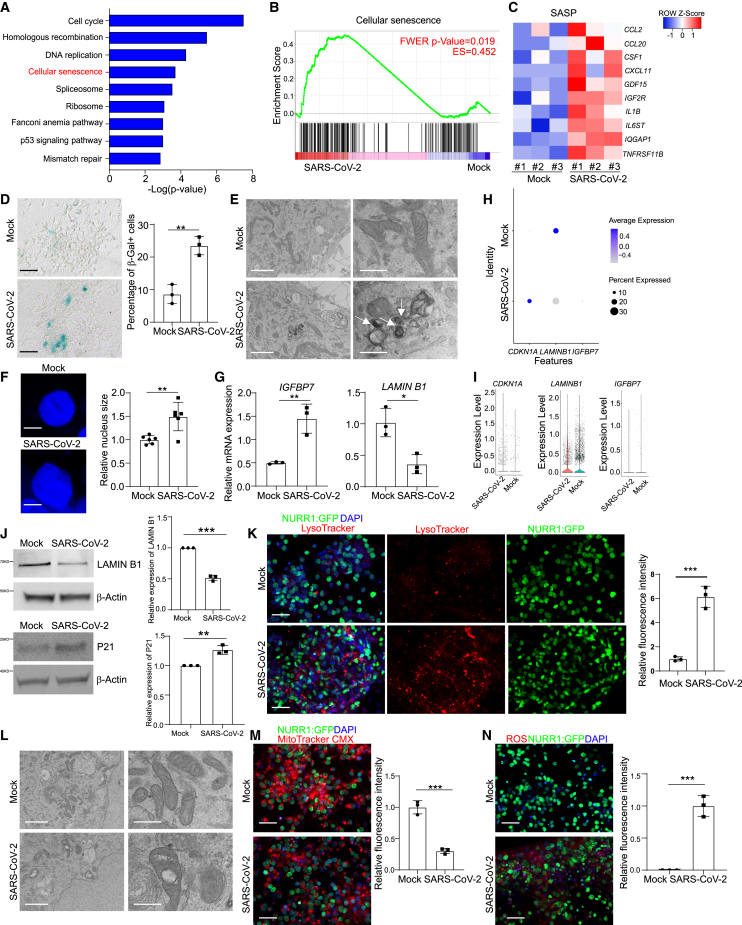
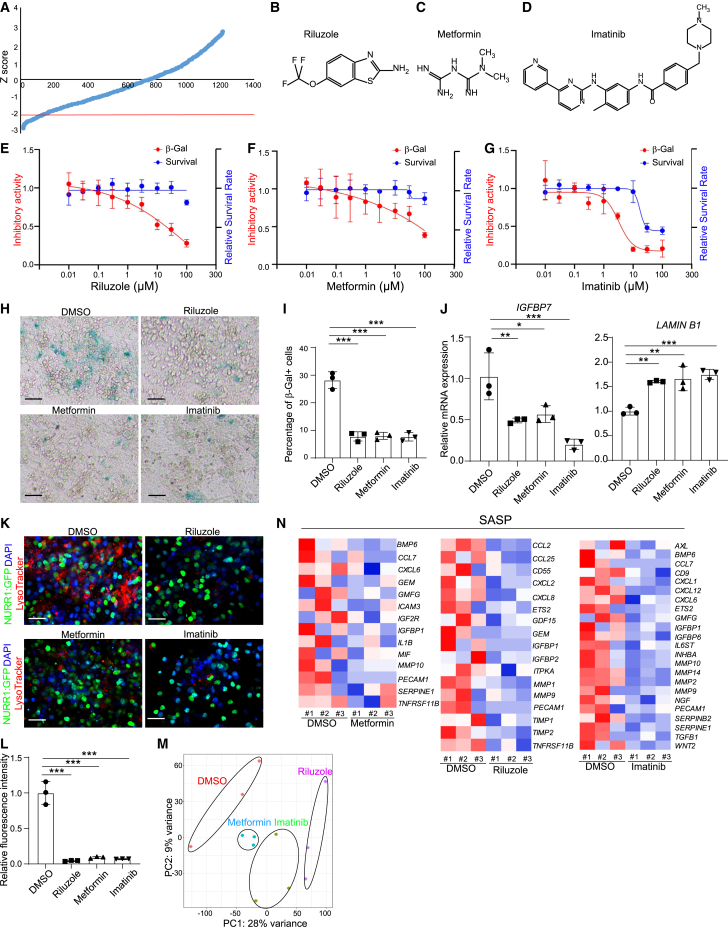
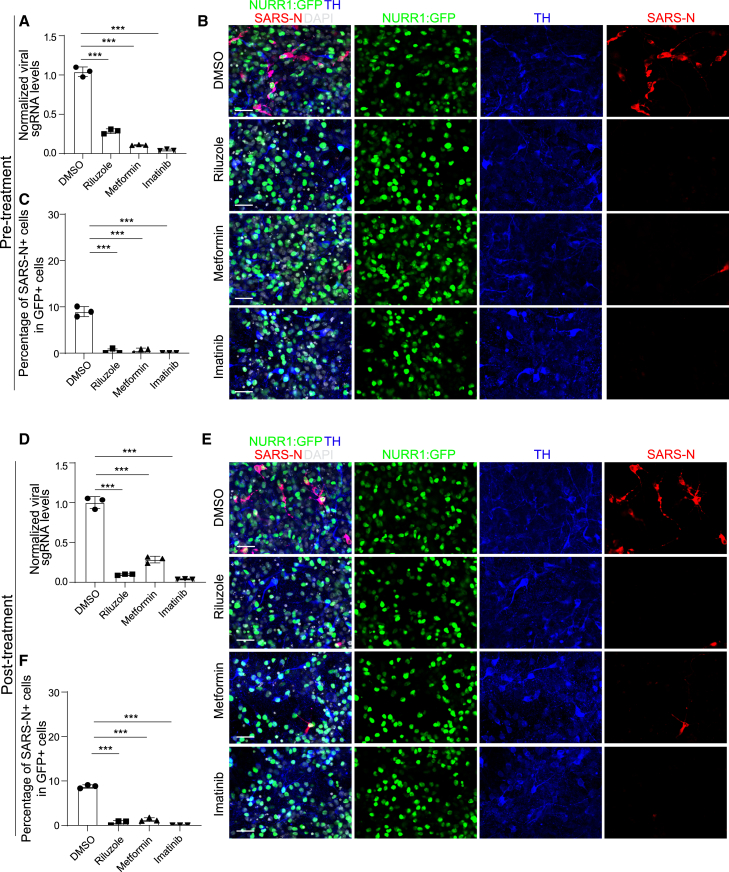
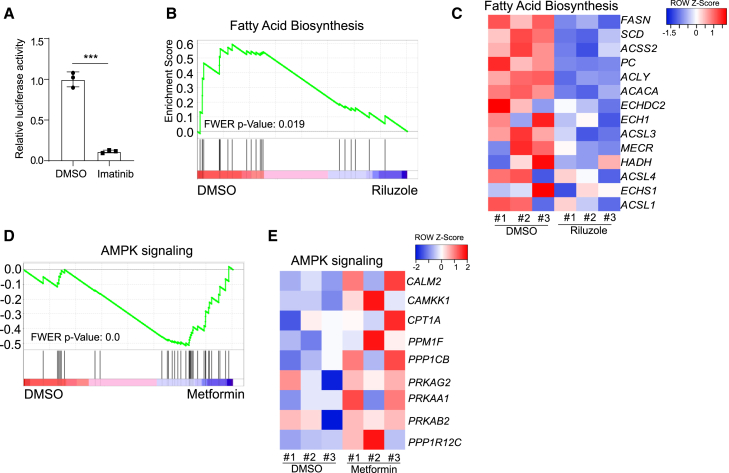
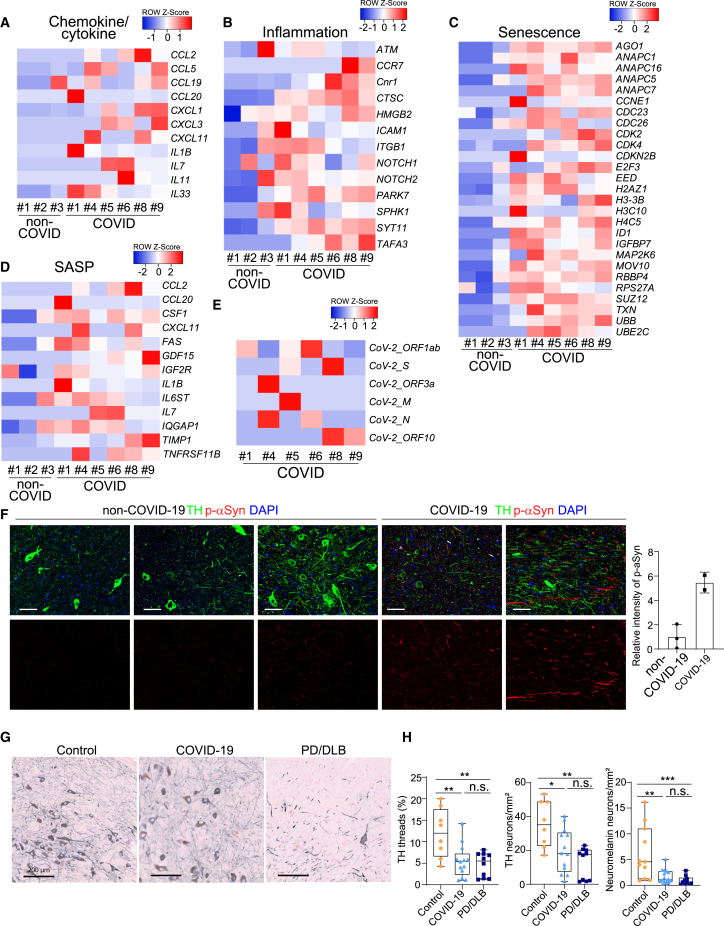
COVID-19 patients commonly present with signs of central nervous system and/or peripheral nervous system dysfunction. Here, we show that midbrain dopamine (DA) neurons derived from human pluripotent stem cells (hPSCs) are selectively susceptible and permissive to severe acute respiratory syndrome coronavirus 2 (SARS-CoV-2) infection. SARS-CoV-2 infection of DA neurons triggers an inflammatory and cellular senescence response. High-throughput screening in hPSC-derived DA neurons identified several FDA-approved drugs that can rescue the cellular senescence phenotype by preventing SARS-CoV-2 infection. We also identified the inflammatory and cellular senescence signature and low levels of SARS-CoV-2 transcripts in human substantia nigra tissue of COVID-19 patients. Furthermore, we observed reduced numbers of neuromelanin+ and tyrosine-hydroxylase (TH)+ DA neurons and fibers in a cohort of severe COVID-19 patients. Our findings demonstrate that hPSC-derived DA neurons are susceptible to SARS-CoV-2, identify candidate neuroprotective drugs for COVID-19 patients, and suggest the need for careful, long-term monitoring of neurological problems in COVID-19 patients.

Keywords: SARS-CoV-2; dopaminergic neuron; human pluripotent stem cells; senescence.


Conflict of interest statement

Declaration of interests R.E.S. is on the scientific advisory board of Miromatrix Inc. and Lime Therapeutics Inc. and is a paid consultant and speaker for Alnylam Inc. L.S. is a scientific cofounder and paid consultant of BlueRock Therapeutics Inc. and a co-founder of DaCapo Brainscience Inc. S.C. is the co-founder of OncoBeat, LLC and a paid consultant of Vesalius Therapeutics.

Figures

None
Graphical abstract
Figure 1
Figure 1
hPSC-derived DA neurons are susceptible and permissive to SARS-CoV-2 infection (A) Real-time quantitative PCR analysis of total RNA from purified NURR1:GFP H9-derived DA neurons at 48 hpi of SARS-CoV-2 infection (MOI = 0.2) for viral N sgRNA (small guide RNA). The graph depicts the mean sgRNA level normalized to ACTB. n = 3 independent biological replicates. (B and C) Representative confocal images (B) and quantification (C) of purified NURR1:GFP H9-DA neurons infected with SARS-CoV-2 (MOI = 0.1) at 72 hpi using antibodies against SARS-CoV-2 nucleocapsid protein (SARS-N) and markers for DA neurons. Scale bars, 50 μm. n = 3 independent biological replicates. (D and E) Immunostaining (D) and quantification (E) of SARS-N in SARS-CoV-2 infected purified NURR1:GFP H9-derived DA neurons at 24 or 48 hpi (MOI = 0.2). n = 3 independent biological replicates. (F) Virus endpoint titration assay from supernatants of purified NURR1:GFP H9-DA neurons infected with SARS-CoV-2 (MOI = 0.2) at different time points. n = 3 independent biological replicates. (G) Transmission electron microscopy (TEM) images of purified NURR1:GFP H9-DA neurons at 72 hpi of SARS-CoV-2 (MOI = 1.0). Arrows point to SARS-CoV-2 viral particles. Right panel: zoom in images. Scale bars, 1 μm. n = 3 independent biological replicates. (H) RNA-seq read coverage of the viral genome in purified NURR1:GFP H9-DA neurons at 48 hpi (MOI = 0.2). The schematic below depicts the SARS-CoV-2 genome. (I) PCA plot of gene expression profiles from mock or SARS-CoV-2 infected purified NURR1:GFP H9-DA neurons at 48 hpi (MOI = 0.2). (J) Clustering analysis of mock or SARS-CoV-2 infected purified NURR1:GFP-DA neurons at 48 hpi (MOI = 0.2). (K) Heatmap of expression levels of DA neurons and A9 DA neuron marker genes in the mock or SARS-CoV-2 infected purified NURR1:GFP H9-DA neurons at 48 hpi (MOI = 0.2). Data were presented as mean ± SD. p values were calculated by unpaired two-tailed Student’s t test. ∗∗∗p < 0.001. See also Figures S1 and S3.
Figure 2
Figure 2
hPSC-derived TH and NR4A2 positive DA neurons are susceptible and permissive to SARS-CoV-2 infection (A) Uniform Manifold Approximation and Projection (UMAP) analysis of mock and SARS-CoV-2 infected purified NURR1:GFP H9-derived TH and NR4A2 positive DA neurons at 48 hpi (MOI = 0.2). (B) UMAP and violin plot analysis of DA neuron marker genes. (C) UMAP analysis of mock and SARS-CoV-2 infected NURR1:GFP H9-derived TH and NR4A2 positive DA neurons at 48 hpi (MOI = 0.2). (D) Dot plot analysis of SARS-CoV-2 viral transcripts in mock and SARS-CoV-2 infected NURR1:GFP H9-derived TH and NR4A2 positive DA neurons at 48 hpi (MOI = 0.2). (E) Dot plot analysis of SARS-CoV-2 viral transcripts in different populations of mock and SARS-CoV-2 infected NURR1:GFP H9-derived TH and NR4A2 positive DA neurons at 48 hpi (MOI = 0.2). (F) Violin plot analysis of SARS-CoV-2 viral transcripts in different populations of mock and SARS-CoV-2 infected NURR1:GFP H9-derived TH and NR4A2 positive DA neurons at 48 hpi (MOI = 0.2). (G) Dot plot analysis of DA neuron marker genes in mock and SARS-CoV-2 infected NURR1:GFP H9-derived TH and NR4A2 positive DA neurons at 48 hpi (MOI = 0.2). (H) Violin plot analysis of DA neuron marker genes in different populations of mock and SARS-CoV-2 infected NURR1:GFP H9-derived TH and NR4A2 positive DA neurons at 48 hpi (MOI = 0.2). (I) Fluorescence in situ hybridization and quantification of A9 DA neuron subtype marker, LMO3, and A10 DA neuron subtype marker, CALB1 in mock or SARS-CoV-2 infected purified NURR1:GFP H9-DA neurons at 48 hpi (MOI = 0.2). n = 3 independent biological replicates. Data were presented as mean ± SD. p values were calculated by unpaired two-tailed Student’s t test. ∗∗∗p < 0.001. n.s., no significance. See also Figure S2.
Figure 3
Figure 3
SARS-CoV-2 infection induces senescence of DA neurons (A) Ingenuity pathway analysis (IPA) of differentially expressed genes between mock or SARS-CoV-2 infected purified NURR1:GFP H9-DA neurons at 48 hpi (MOI = 0.2). (B) Gene set enrichment analysis (GSEA) of cellular senescence pathway in mock or SARS-CoV-2 infected purified NURR1:GFP H9-DA neurons at 48 hpi (MOI = 0.2). (C) Heatmap of SASP associated genes in mock or SARS-CoV-2 infected purified NURR1:GFP H9-DA neurons at 48 hpi (MOI = 0.2). (D) β-gal staining (left) and quantification (right) of the percentage of β-Gal+ cells of mock or SARS-CoV-2 infected purified NURR1:GFP H9-DA neurons at 72 hpi (MOI = 0.1). Scale bars, 75 μm. n = 3 independent biological replicates. (E) TEM images of mock or SARS-CoV-2 infected purified NURR1:GFP H9-DA neurons at 72 hpi (MOI = 1.0). Scale bars, 2 μm. n = 3 independent biological replicates. (F) Immunostaining of DAPI (left) and quantification (right) of relative nuclear size in mock or SARS-CoV-2 infected purified NURR1:GFP H9-DA neurons at 72 hpi (MOI = 0.1). Scale bars, 75 μm. n = 3 independent biological replicates. (G) Real-time quantitative PCR analysis of IGFBP7 and LAMIN B1 in mock or SARS-CoV-2 infected purified NURR1:GFP H9-DA neurons at 48 hpi (MOI = 0.2). n = 3 independent biological replicates. (H) Dot plot analysis of CDKN1A, IGFBP7, and LAMIN B1 in mock or SARS-CoV-2 infected purified NURR1:GFP H9-DA neurons at 48 hpi (MOI = 0.2). (I) Violin plot analysis of CDKN1A, IGFBP7, and LAMIN B1 in mock or SARS-CoV-2 infected purified NURR1:GFP H9-DA neurons at 48 hpi (MOI = 0.2). (J) Western blot analysis (left) and quantification (right) of P21 and LAMIN B1 in mock or SARS-CoV-2 infected purified NURR1:GFP H9-DA neurons at 48 hpi (MOI = 0.2). n = 3 independent biological replicates. (K) Representative confocal images (left) and quantification (right) of relative LysoTracker intensity of purified NURR1:GFP H9-DA neurons infected with mock or SARS-CoV-2 (MOI = 0.1) at 72 hpi. Scale bars, 50 μm. n = 3 independent biological replicates. (L) Representative TEM images of mitochondrial in purified NURR1:GFP H9-DA neurons infected with mock or SARS-CoV-2 (MOI = 0.1) at 72 hpi. Scale bars, 50 μm. n = 3 independent biological replicates. (M) Representative confocal images (left) and quantification (right) of MitoTracker intensity of purified NURR1:GFP H9-DA neurons infected with mock or SARS-CoV-2 (MOI = 0.1) at 72 hpi. Scale bars, 50 μm. n = 3 independent biological replicates. (N) Representative confocal images (left) and quantification (right) of ROS intensity of purified NURR1:GFP H9-DA neurons infected with mock or SARS-CoV-2 (MOI = 0.1) at 72 hpi. Scale bars, 50 μm. n = 3 independent biological replicates. Data were presented as mean ± SD. p values were calculated by unpaired two-tailed Student’s t test. ∗∗p < 0.01, and ∗∗∗p < 0.001. See also Figures S3 and S4.
Figure 4
Figure 4
Riluzole, metformin, and imatinib rescue SARS-CoV-2 induced senescence of DA neurons (A) Primary screening results. x axis is the compound number. y axis is the Z score. Red line is Z score < −2, which means the luminescent signal is lower than average-2 × SD. (B–D) Chemical structures of riluzole (B), metformin (C), and imatinib (D). (E–G) Efficacy and cytotoxicity curves of riluzole (E), metformin (F), and imatinib (G). n = 3 independent biological replicates. (H and I) β-gal staining (H) and quantification of the percentage of β-gal+ cells (I) of DMSO or drug candidates-treated purified NURR1:GFP H9-DA neurons at 72 hpi (MOI = 0.1). Scale bars, 100 μm. n = 3 independent biological replicates. (J) Real-time quantitative PCR analysis of senescence related genes of DMSO or drug candidates-treated purified NURR1:GFP H9-DA neurons at 48 hpi (MOI = 0.1). n = 3 independent biological replicates. (K and L) Immunostaining (K) and quantification of LysoTracker intensity (L) of DMSO or drug candidates-treated purified NURR1:GFP H9-DA neurons at 72 hpi (MOI = 0.1). Scale bars, 100 μm. n = 3 independent biological replicates. (M) PCA plot of gene expression profiles of DMSO or drug candidates-treated purified NURR1:GFP H9-DA neurons at 48 hpi (MOI = 0.1). (N) Heatmap of SASP associated genes of DMSO or drug candidates-treated purified NURR1:GFP H9-DA neurons at 48 hpi (MOI = 0.1). Data were presented as mean ± SD. p values were calculated by one-way ANOVA using Dunnett’s test with a setup control. p < 0.05, ∗∗p < 0.01, and ∗∗∗p < 0.001. See also Figure S5.
Figure 5
Figure 5
Riluzole, metformin, and imatinib block SARS-CoV-2 infection (A) Real-time quantitative PCR analysis of total RNA from DMSO or drug candidates-pre-treated purified NURR1:GFP H9-DA neurons following SARS-CoV-2 infection (MOI = 0.2) for viral N sgRNA at 48 hpi. The graph depicts the mean sgRNA level normalized to ACTB. n = 3 independent biological replicates. (B and C) Representative confocal images (B) and quantification of the percentage of SARS-N+ cells (C) of DMSO or drug candidates-pre-treated purified NURR1:GFP H9-DA neurons following SARS-CoV-2 infection (MOI = 0.2) at 72 hpi. Scale bars, 50 μm. n = 3 independent biological replicates. (D) Real-time quantitative PCR analysis of total RNA from DMSO or drug candidates-post-treated purified NURR1:GFP H9-derived DA neurons after SARS-CoV-2 infection (MOI = 0.2) for viral N sgRNA at 48 hpi. The graph depicts the mean sgRNA level normalized to ACTB. n = 3 independent biological replicates. (E and F) Representative confocal images (E) and quantification of the percentage of SARS-N+ cells (F) of DMSO or drug candidates-post-treated purified NURR1:GFP H9-DA neurons after SARS-CoV-2 infection (MOI = 0.2) at 72 hpi. Scale bars, 50 μm. n = 3 independent biological replicates. Data were presented as mean ± SD. p values were calculated by one-way ANOVA using Dunnett’s test with a setup control. ∗∗∗p < 0.001. See also Figure S6.
Figure 6
Figure 6
Mechanisms of three drug candidates block SARS-CoV-2 infection (A) Luciferase activity in lysates from DMSO or imatinib treated purified NURR1:GFP H9-derived DA neurons at 24 hpi following exposure to SARS-CoV-2-entry virus at MOI = 0.01. n = 3 independent biological replicates. Data were presented as mean ± SD. p values were calculated by unpaired two-tailed Student’s t test. p < 0.05. (B) Gene set enrichment analysis (GSEA) of fatty acid biosynthesis pathway in DMSO or riluzole treated purified NURR1:GFP H9-derived DA neurons at 48 hpi of SARS-CoV-2 (MOI = 0.2). (C) Heatmap of fatty acid biosynthesis pathway associated genes in DMSO or riluzole treated purified NURR1:GFP H9-derived DA neurons at 48 hpi of SARS-CoV-2 (MOI = 0.2). (D) Gene set enrichment analysis (GSEA) of AMPK signaling pathway in DMSO or metformin treated purified NURR1:GFP H9-derived DA neurons at 48 hpi of SARS-CoV-2 (MOI = 0.2). (E) Heatmap of AMPK signaling pathway associated genes in DMSO or metformin treated purified NURR1:GFP H9-derived DA neurons at 48 hpi of SARS-CoV-2 (MOI = 0.2). See also Figure S6.
Figure 7
Figure 7
Inflammatory, senescence, and DA neuron degenerative phenotypes were detected in autopsy substantia nigra samples of COVID-19 patients (A–D) Heatmap of chemokine/cytokine (A), inflammation-associated genes (B), senescence-associated genes (C), and SASP associated genes (D) in the autopsy substantia nigra sections of COVID-19 patients versus non-COVID-19 patients (cohort 1: N = 6 COVID-19 patients; N = 3 non-COVID-19 patients). (E) Heatmap of viral transcripts in autopsy substantia nigra sections of COVID-19 patients (cohort 1: N = 6 COVID-19 patients; N = 3 non-COVID-19 patients). (F) Representative confocal images (left) and quantification (right) of p-aSyn in the autopsy substantia nigra sections of COVID-19 patients versus non-COVID-19 patients (cohort 1: N = 2 COVID-19 patients; N = 3 non-COVID-19 patients). Scale bars, 50 μm. (G) Representative images of TH-immunoreactivity (gray) in the substantia nigra (cohort 2). Scale bars, 200 μm. Data were presented as mean ± SD. p values were calculated by unpaired two-tailed Student’s t test. (H) Graphs illustrating quantification of neuromelanin-containing neurons, TH-immunoreactive neurons, and threads (cohort 2). p values were calculated by a Kruskal-Wallis test. p < 0.05, ∗∗p < 0.01, and ∗∗∗p < 0.001. n.s., no significant. See also Figure S7 and Tables S1, S2, S3, and S4.

Update of

References

    1. Pezzini A., Padovani A. Lifting the mask on neurological manifestations of COVID-19. Nat. Rev. Neurol. 2020;16:636–644. - PMC - PubMed
    1. Taquet M., Geddes J.R., Husain M., Luciano S., Harrison P.J. 6-month neurological and psychiatric outcomes in 236 379 survivors of COVID-19: a retrospective cohort study using electronic health records. Lancet Psychiatry. 2021;8:416–427. - PMC - PubMed
    1. Pellegrini L., Albecka A., Mallery D.L., Kellner M.J., Paul D., Carter A.P., James L.C., Lancaster M.A. SARS-CoV-2 infects the brain choroid plexus and disrupts the blood-CSF barrier in human brain organoids. Cell Stem Cell. 2020;27:951–961.e5. - PMC - PubMed
    1. Jacob F., Pather S.R., Huang W.K., Zhang F., Wong S.Z.H., Zhou H., Cubitt B., Fan W., Chen C.Z., Xu M., et al. Human pluripotent stem cell-derived neural cells and brain organoids reveal SARS-CoV-2 neurotropism predominates in choroid plexus epithelium. Cell Stem Cell. 2020;27:937–950.e9. - PMC - PubMed
    1. Song E., Zhang C., Israelow B., Lu-Culligan A., Prado A.V., Skriabine S., Lu P., Weizman O.E., Liu F., Dai Y., et al. Neuroinvasion of SARS-CoV-2 in human and mouse brain. J. Exp. Med. 2021;218:e20202135. - PMC - PubMed