. 2024 Mar 5;36(3):575-597.e7.
doi: 10.1016/j.cmet.2023.12.024. Epub 2024 Jan 17.

Downregulation of the kidney glucagon receptor, essential for renal function and systemic homeostasis, contributes to chronic kidney disease

Affiliations

Downregulation of the kidney glucagon receptor, essential for renal function and systemic homeostasis, contributes to chronic kidney disease

May-Yun Wang et al. Cell Metab. .

Abstract

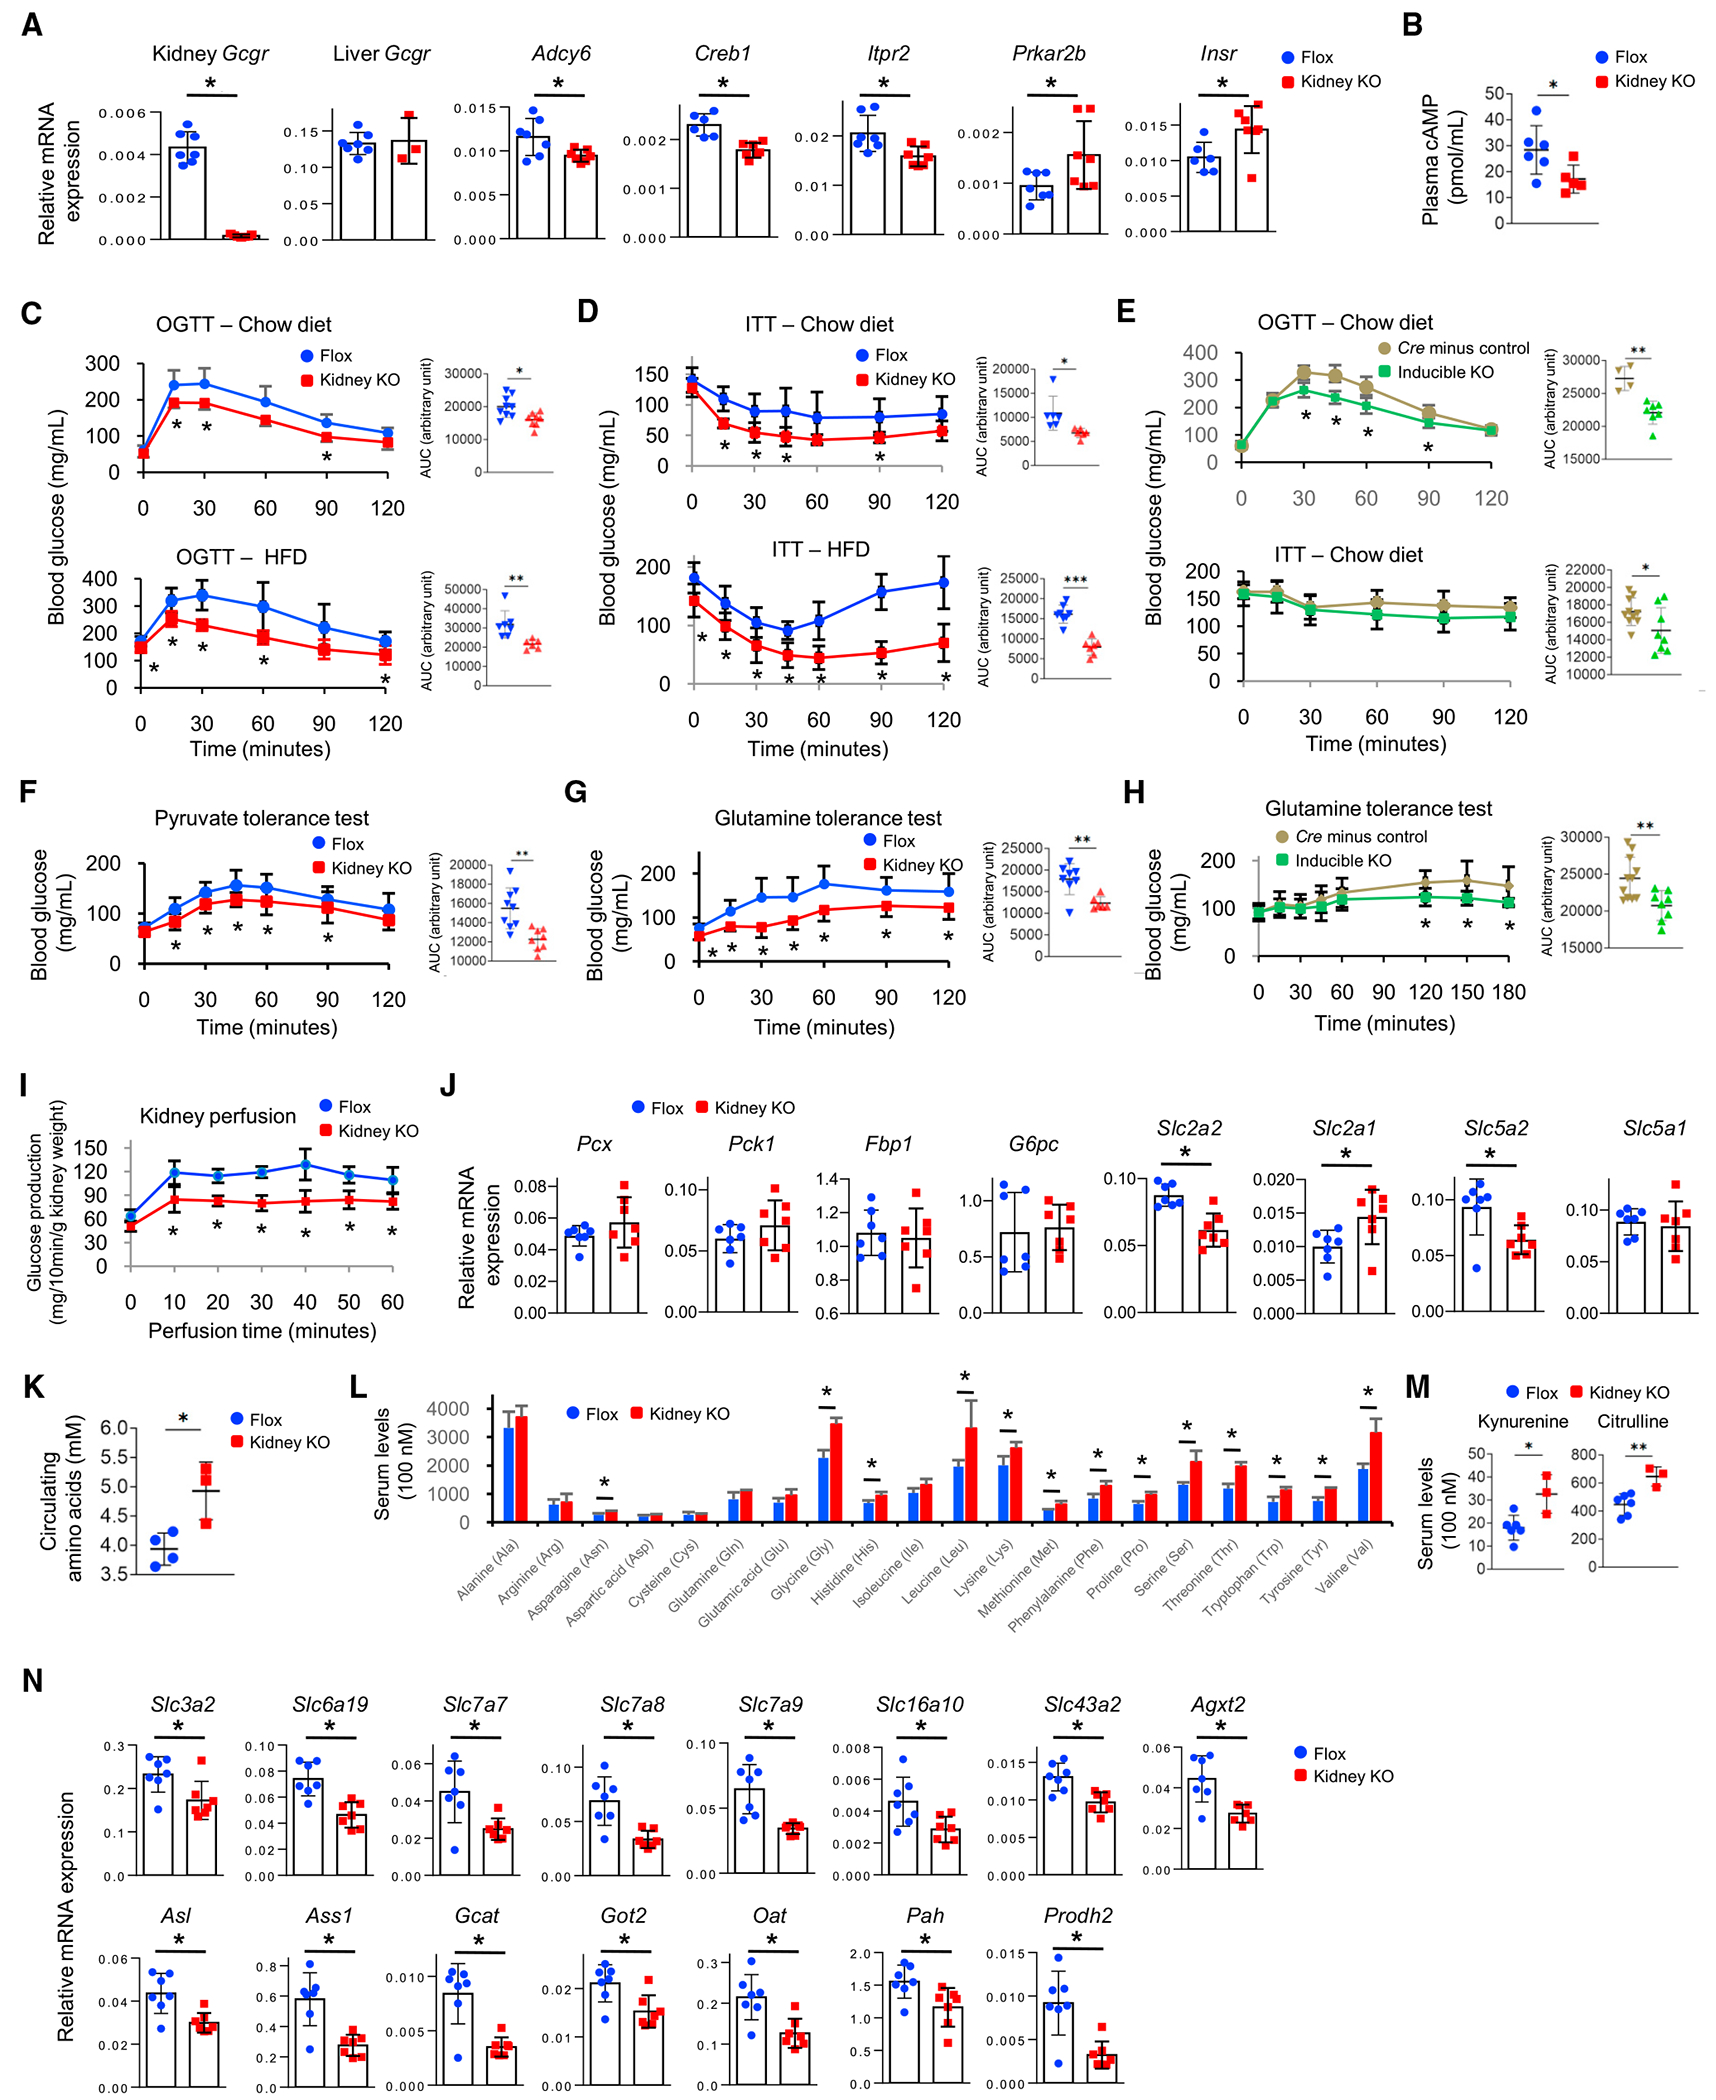
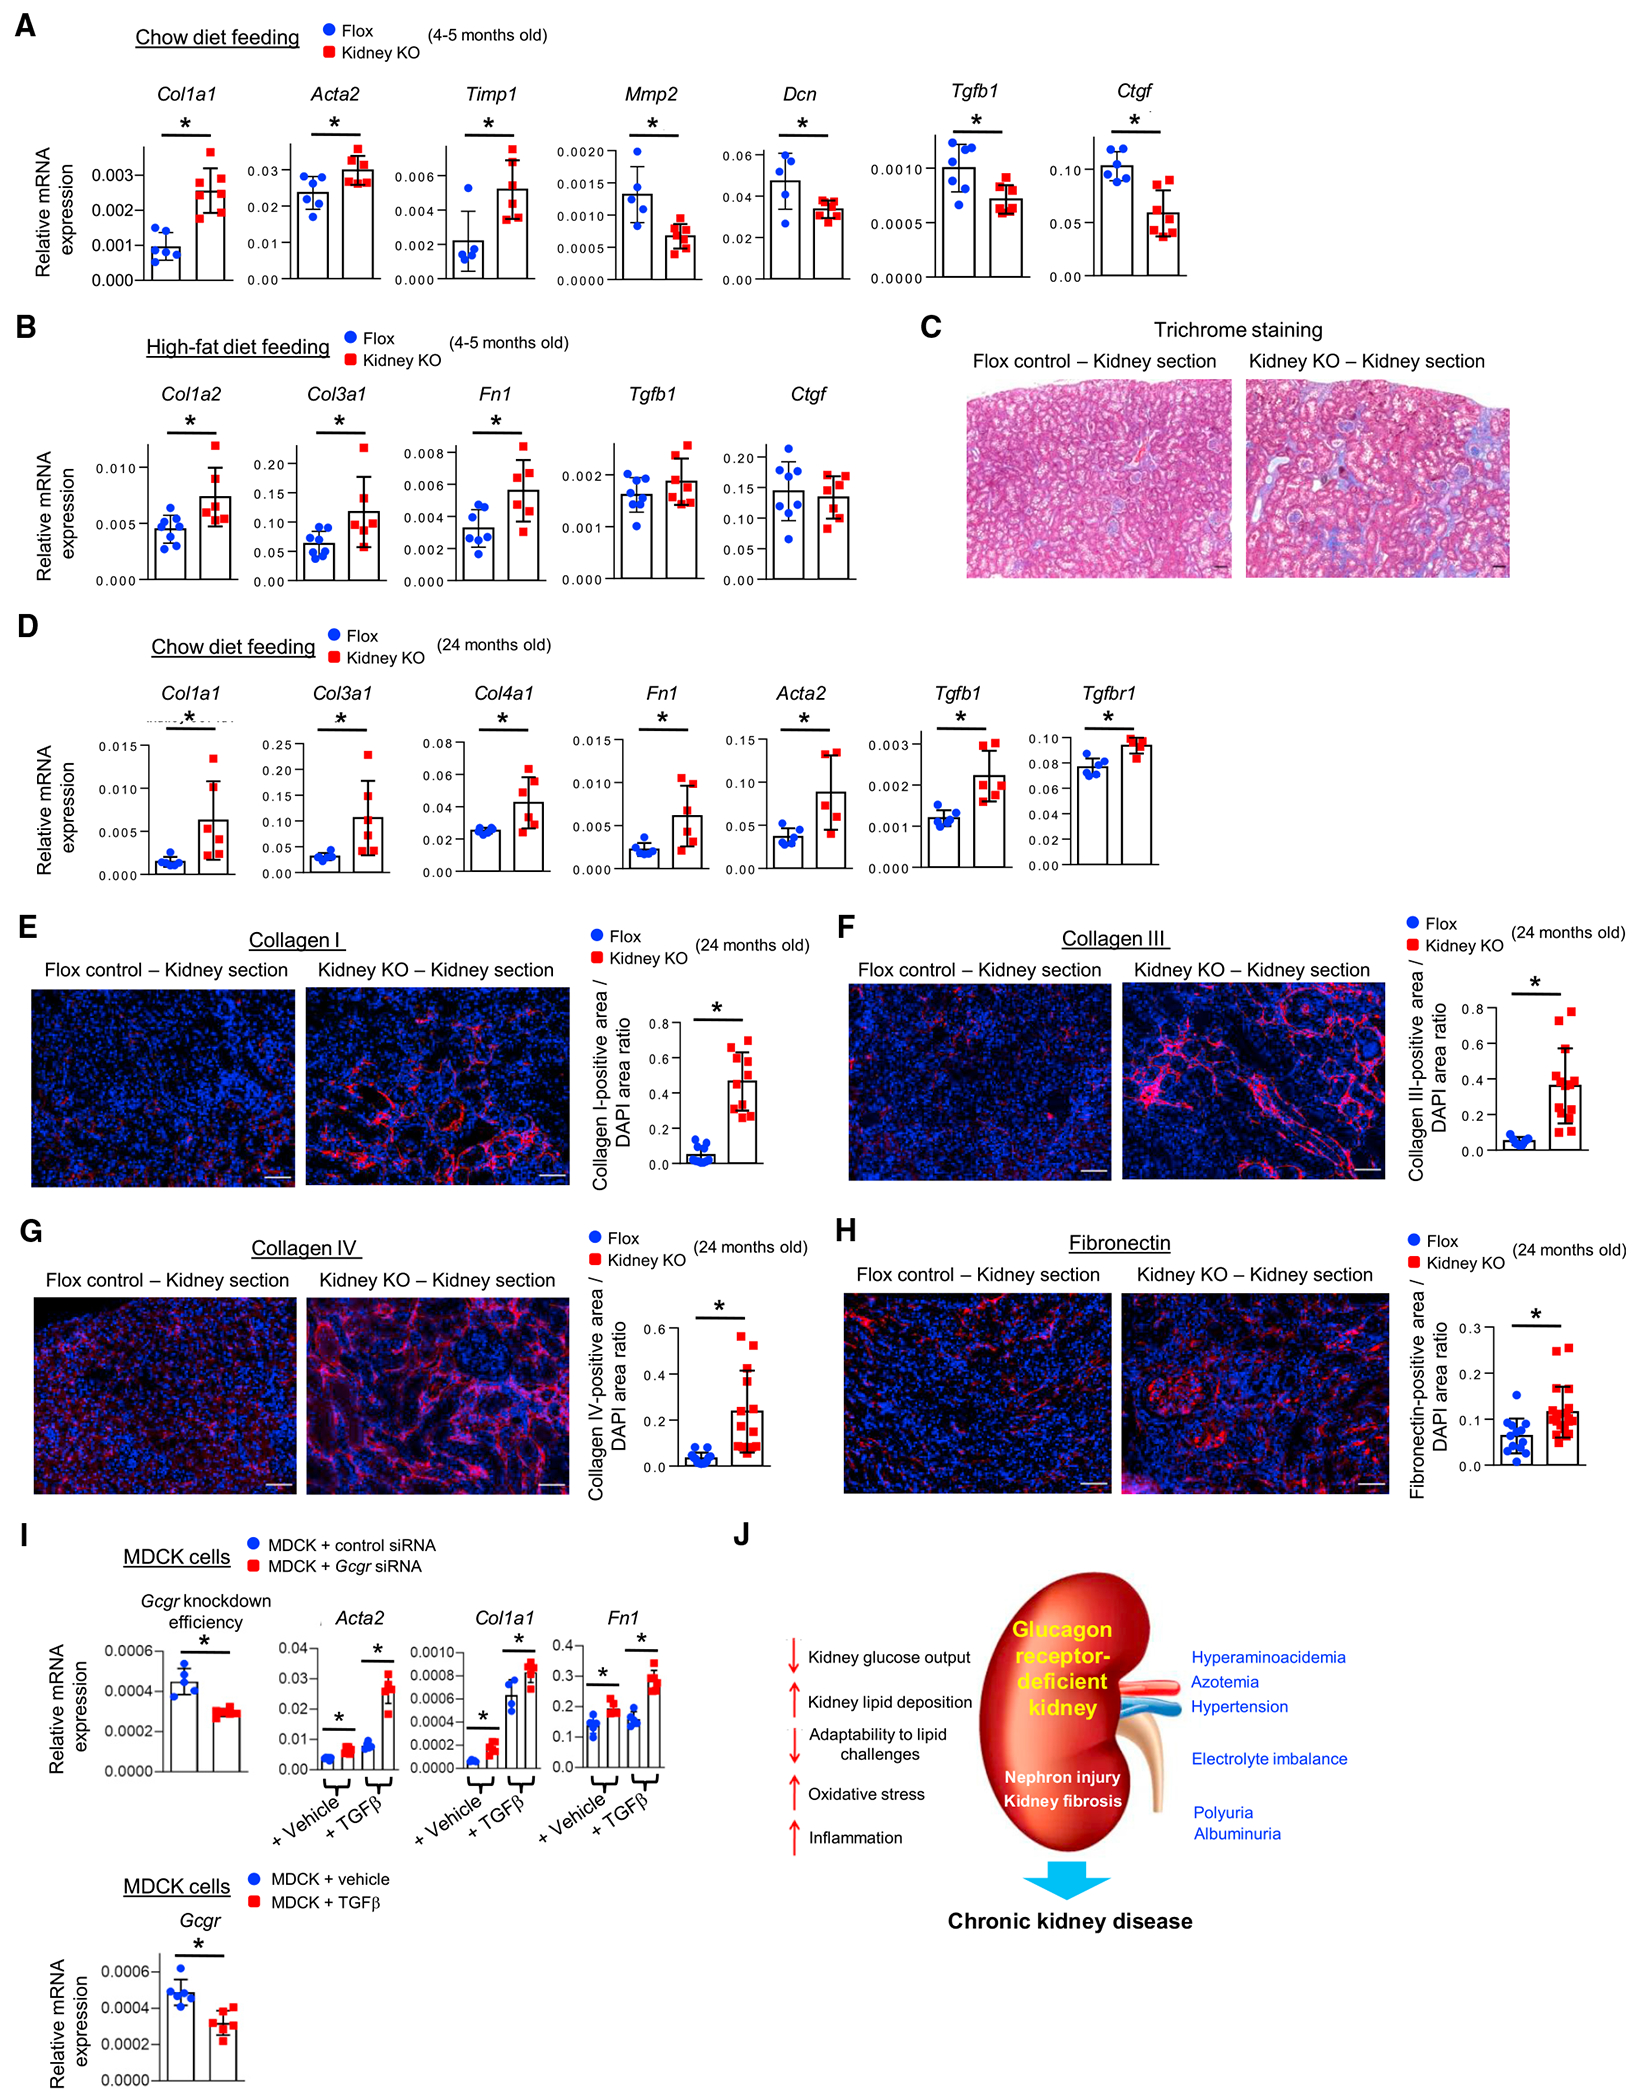
The glucagon receptor (GCGR) in the kidney is expressed in nephron tubules. In humans and animal models with chronic kidney disease, renal GCGR expression is reduced. However, the role of kidney GCGR in normal renal function and in disease development has not been addressed. Here, we examined its role by analyzing mice with constitutive or conditional kidney-specific loss of the Gcgr. Adult renal Gcgr knockout mice exhibit metabolic dysregulation and a functional impairment of the kidneys. These mice exhibit hyperaminoacidemia associated with reduced kidney glucose output, oxidative stress, enhanced inflammasome activity, and excess lipid accumulation in the kidney. Upon a lipid challenge, they display maladaptive responses with acute hypertriglyceridemia and chronic proinflammatory and profibrotic activation. In aged mice, kidney Gcgr ablation elicits widespread renal deposition of collagen and fibronectin, indicative of fibrosis. Taken together, our findings demonstrate an essential role of the renal GCGR in normal kidney metabolic and homeostatic functions. Importantly, mice deficient for kidney Gcgr recapitulate some of the key pathophysiological features of chronic kidney disease.

Keywords: chronic kidney disease; glucagon receptor; kidney.


Conflict of interest statement

Declaration of interests The authors declare no competing interests.

Figures

Figure 1.
Figure 1.. Kidney-specific Gcgr-null mice exhibit enhanced glucose tolerance, reduced renal glucose output, and hyperaminoacidemia
(A) qPCR analysis of kidney Gcgr, Adcy6, Creb1, Itpr2, Prkar2b, Insr, and liver Gcgr mRNA expression in kidney-specific Gcgr knockout (kidney KO) and floxed control (Flox) mice. Housekeeping gene 36b4 was used for normalization of gene transcript levels. Gcgr, glucagon receptor; Adcy6, adenylatecyclasetype 6; Creb1, cAMP-responsive element-binding protein 1; Itpr2, inositol 1,4,5-triphosphate receptor type 2; Prkar2b, protein kinase A (inhibitory) regulatory subunit 2 beta; Insr, insulin receptor. Results are represented as mean ± SD; n = 7 mice per group; *p < 0.05 by Student’s t test. (B) Plasma cAMP levels of kidney KO and Flox mice. n = 5–6 mice per group; *p < 0.05. (C and D) Blood glucose levels during oral glucose tolerance tests (OGTTs) (C) or insulin tolerance tests (ITTs) (D) performed in chow diet- or high-fat diet (HFD)-fed kidney KO and Flox mice. AUC, area under the curve. n = 5–7 mice per group; *p < 0.05, **p < 0.01, ***p < 0.001. (E) Blood glucose levels during OGTTs or ITTs in inducible Gcgr KO and Cre minus control mice. AUC, area under the curve. n = 4–9 mice per group; *p < 0.05, **p < 0.01. (F and G) Blood glucose levels during pyruvate tolerance tests (F) or glutamine tolerance tests (G) performed in chow diet-fed kidney KO and Flox mice. AUC, area under the curve. n = 8–10 mice per group; *p < 0.05, **p < 0.01. (H) Blood glucose levels during glutamine tolerance tests performed in inducible Gcgr KO and Cre-minus control mice. AUC, area under the curve. n = 8–11 mice per group; *p < 0.05, **p < 0.01. (I) Time course of glucose release into the perfusate solution by perfused kidneys from kidney KO and Flox mice. Gluconeogenic substrate mixture (pyruvate, glutamine, and lactate) was present at time zero. The perfusate was subsequently sampled at 10-min intervals for glucose analysis. n = 3–5 kidneys per group; *p < 0.05. (J) qPCR analysis of renal gluconeogenic and glucose transport gene expression in kidney KO and Flox mice. Pcx, pyruvate carboxylase; Pck1, phosphoenol pyruvate carboxykinase; Fbp1, fructose-1,6-biphosphatase; G6pc, glucose-6-phosphatasecatalytic subunit 1; Slc2a2, glucose transporter GLUT2; Slc2a1, glucose transporter GLUT1; Slc5a2, sodium-glucose co-transporter SGLT2; Slc5a1, sodium-glucose co-transporter SGLT1. n = 7 mice per group; *p < 0.05. (K) Serum levels of total amino acids, exclusive of glycine, in kidney KO and Flox mice. n = 3–4 mice per group; *p < 0.05. (L) Serum amino acid profiles in kidney KO and Flox mice. n = 3–6 mice per group; *p < 0.05. (M) Serum levels of kynurenine, a tryptophan metabolite, and citrulline, a urea cycle intermediate, in kidney KO and Flox mice. n = 3–6 mice per group; *p < 0.05, **p < 0.01. (N) qPCR analysis of kidney amino acid transport and degradation gene expression in kidney KO and Flox mice. Slc3a2, solute carrier family 3 member 2; Slc6a19, solute carrier family 6 member 19; Slc7a7, solute carrier family 7 member 7; Slc7a8, solute carrier family 7 member 8; Slc7a9, solute carrier family 7 member 9; Slc16a10, solute carrier family 16 member 10; Slc43a2, solute carrier family 43 member 2; Agxt2, alanine-glyoxylate aminotransferase 2; Asl, argininosuccinate lyase; Ass1, argininosuccinate synthase; Gcat, 2-amino-3-ketobutyrate coenzyme A ligase; Got2, aspartate aminotransferase; Oat, ornithineaminotransferase; Pah, phenylalanine-4-hydroxylase; Prodh2, hydroxyproline dehydrogenase. n = 6–7 mice per group; *p < 0.05.
Figure 2.
Figure 2.. Kidney-specific Gcgr-null mice display nitrogen and water imbalance
(A) Serum levels of blood urea nitrogen and creatinine in kidney-specific Gcgr knockout (kidney KO) and floxed control (Flox) mice at 5 or 24 months of age. n = 4–6 mice per group; ***p < 0.001. (B) qPCR analysis of kidney urea transporter (UTA1, UTA2, UTA3, and UTB) gene expression in kidney KO and Flox mice. n = 5–7 mice per group; *p < 0.05. (C) Concentrations of urinary urea in kidney KO and Flox mice. n = 6–8 mice per group; **p < 0.01. (D) Total daily urinary urea excretion in kidney KO and Flox mice. n = 6–10 mice per group. (E) Total daily urine output and water intake in kidney KO and Flox mice. n = 10 mice per group; ***p < 0.001. (F) Total daily urine output and water intake in inducible Gcgr KO and Cre minus control mice. n = 8 mice per group; **p < 0.01. (G) Whole-body fluid content in kidney KO and Flox mice. n = 5–7 mice per group. (H) qPCR analysis of kidney water channel (Aqp2 and Aqp11), vasopressin-V2 receptor (Avpr2), and apelin receptor (Aplnr) gene expression in kidney KO and Flox mice. n = 6–7 mice per group; *p < 0.05. (I) Urinary osmolyte concentrations in kidney KO and Flox mice in response to 4-h arginine-vasopressin treatment. n = 15–16 mice per group; ***p < 0.001.
Figure 3.
Figure 3.. Kidney-specific Gcgr-null mice show electrolyte imbalance and have chronic oxidative stress
(A) Concentrations of urinary osmolytes in kidney-specific Gcgr knockout (kidney KO) and floxed control (Flox) mice. n = 6–9 mice per group; **p < 0.01. (B) Total daily urinary osmolyte excretion in kidney KO and Flox mice. n = 6–9 mice per group. (C) Urinary osmolyte concentrations and body weight loss in kidney KO and Flox mice in response to 24-h water deprivation. n = 4 mice per group; *p < 0.05, **p < 0.01. (D) qPCR analysis of kidney mRNA expression of genes involved in handling sodium transport and homeostasis in kidney KO and Flox mice. Slc9a3, sodium-hydrogen exchanger Nhe3; Slc12a1, sodium-potassium-chloride co-transporter Nkcc2; Scnn1a, amiloride-sensitive sodium channel subunit alpha; Scnn1b, amiloride-sensitive sodium channel subunit beta; Scnn1g, amiloride-sensitive sodium channel subunit gamma; Sgk1, serine/threonine-protein kinase Sgk1; Atp1a1, sodium/potassium-ATPase subunit alpha-1; Atp1b1, sodium/potassium-ATPase subunit beta-1; Fxyd2, sodium/potassium-ATPase subunit gamma; Sik1, serine/threonine-protein kinase Sik1. n = 5–7 mice per group; *p < 0.05. (E) qPCR analysis of kidney mRNA expression of genes involved in handling chloride transport in kidney KO and Flox mice. Slc12a4, potassium-chloride co-transporter Kcc1; Clcnka, chloride channel ClC-Ka; Clcnkb, chloride channel ClC-Kb; Slc26a4, solute carrier family 26 member 4 (pendrin). n = 5–7 mice per group; *p < 0.05. (F) qPCR analysis of kidney mRNA expression of genes involved in handling calcium transport in kidney KO and Flox mice. Slc8a1, sodium-calcium exchanger Ncx1; TrpV5, transient receptor potential cation channel subfamily V member 5; Atp2b1, plasma membrane calcium-transporting ATPase. n = 5–7 mice per group; *p < 0.05. (G) qPCR analysis of kidney fatty acid oxidation and lipid transport gene expression in kidney-specific Gcgr knockout (kidney KO) and floxed control (Flox) mice. Housekeeping gene 36b4 was used for normalization of gene transcript levels. Acads, short-chain-specific acyl-CoA dehydrogenase; Acadm, medium-chain-specific acyl-CoA dehydrogenase; Slc27a2, fatty acid transport protein 2; Cd36, platelet glycoprotein 4; Cpt2, carnitine O-palmitoyltransferase 2; Acadl, long-chain-specific acyl-CoA dehydrogenase. n = 6–7 mice per group; *p < 0.05. (H) qPCR analysis of renal glycolytic and mitochondrial pyruvate transport gene expression in kidney KO and Flox mice. Hk1, hexokinase-1; Pfkl, ATP-dependent 6-phosphofructokinase, liver type; Pfkp, ATP-dependent 6-phosphofructokinase, platelet type; Pkm, pyruvate kinase Pkm; Mpc1, mitochondrial pyruvate carrier 1. n = 6–7 mice per group; *p < 0.05. (I) Levels of circulating ketone β-hydroxybutyrate in kidney KO and Flox mice in the fasting and fed states. n = 4–9 mice per group; ***p < 0.001. (J) qPCR analysis of renal ketone metabolism gene expression in kidney KO and Flox mice. Slc16a1, monocarboxylate transporter Mct1; Slc16a7, monocarboxylate transporterMct2; Slc16a3, monocarboxylate transporter Mct4; Bdh1, D-β-hydroxybutyrate dehydrogenase; Oxct1, succinyl-CoA:3-ketoacid coenzyme A transferase 1. n = 7 mice per group; *p < 0.05. (K) Ratio of serum oxidized over reduced glutathione concentrations in kidney KO and Flox mice. n = 3–8 mice per group; **p < 0.01. (L) qPCR analysis of renal antioxidant and redox-sensitive gene expression in kidney KO and Flox mice. Sod1, superoxide dismutase; Hmox1, heme oxygenase 1; Prdx5, peroxiredoxin 5; Txn1, thioredoxin 1; Ucp2, uncoupling protein 2; Pm20d1, peptidase M20 domain-containing 1; Atf4, cAMP-dependent transcription factor Atf-4; Nrf2, nuclear factor erythroid-derived 2-related factor 2. n = 6–7 mice per group; *p < 0.05.
Figure 4.
Figure 4.. Kidney-specific Gcgr-null mice display hypertension and renal injury
(A) Arterial blood pressure and resting heart rate of kidney-specific Gcgr knockout (kidney KO) and floxed control (Flox) mice. KO mice received either drinking water containing 1,3-butanediol for 4 weeks or regular water without 1,3-butanediol for the same duration prior to blood pressure measurement. n = 8–10 mice per group; *p < 0.05, **p < 0.01. (B) qPCR analysis of kidney corticosteroid 11-beta-dehydrogenase Hsd11b1 and Hsd11b2 gene expression in kidney KO and Flox mice. n = 6–7 mice per group; *p < 0.05. (C) Serum levels of corticosterone in kidney KO and Flox mice. n = 6 mice per group; *p < 0.05. (D) qPCR analysis of renal injury biomarker gene expression in kidney KO and Flox mice. Kim1, kidney injury molecule-1; Lcn2, lipocalin-2; Sostdc1, sclerostin domain-containing protein 1; Wt1, Wilm’s tumor protein homolog; Nphs1, nephrin; Podxl, podocalyxin. n = 5–7 mice per group; *p < 0.05. (E) Daily urinary albumin excretion in kidney-specific Gcgr KO, liver-specific Gcgr KO, and their respective control mice. n = 6–8 mice per group; *p < 0.05. (F)qPCR analysis of kidney M1/M2 macrophage marker and regulator gene expression in kidneyKOand Flox mice. Ym1, chitinase-like protein 3; Arg1, arginase-1; Mrc1, macrophage mannose receptor 1; Nos2, inducible nitricoxide synthase; Il4r, interleukin-4 receptor subunit alpha. n = 7 mice per group; *p < 0.05.
Figure 5.
Figure 5.. Kidney-specific Gcgr-null mice show excessive renal lipid deposition and lipid-related maladaptive responses
(A) Intrarenal triglyceride (TG) content in kidney-specific Gcgr knockout (kidney KO) and floxed control (Flox) mice. n = 4 mice per group; *p < 0.05. (B) qPCR analysis of kidney lipogenesis and transcription factor gene expression in kidney KO and Flox mice. Fasn, fatty acid synthase; Acaca, acetyl-CoA carboxylase 1; Acly, ATP-citrate synthase; Acsm2, acyl-CoA synthetase medium-chain family member 2; Hmgcr, 3-hydroxy-3-methylglutaryl-CoA reductase; Srebp1a, sterol regulatory element-binding protein 1a; Srebp1c, sterol regulatory element-binding protein 1c; Pparg, peroxisome proliferator-activated receptor gamma. n = 7 mice per group; *p < 0.05. (C) Serum levels of triglycerides and free fatty acids in kidney KO and Flox mice after 16-h fasting and 24-h refeeding. n = 7–11 mice per group; *p < 0.05. (D) Serum triglyceride levels during oral lipid tolerance tests in kidney KO and Flox mice. n = 5–7 mice per group; *p < 0.05. (E) Serum triglyceride levels during oral lipid tolerance tests in inducible Gcgr KO and Cre-minus control mice. n = 3–7 mice per group; *p < 0.05. (F) qPCR analysis of kidney adhesion-, immune-, and inflammatory-related gene expression in chow diet-fed kidney KO and Flox mice. Icam1, intercellular adhesion molecule 1; Cdh1, cadherin-1; Cd68, macrosialin; Cxcl2, C-X-C motif chemokine 2; Cxcl15, C-X-C motif chemokine 15; Nlrp3, NACHT, LRR, and PYD domain-containing protein 3; Il18, interleukin-18. n = 5–7 mice per group; *p < 0.05. (G) qPCR analysis of renal immune- and inflammatory-related gene expression in high-fat diet-fed kidney KO and Flox mice. Cd11b, integrin alpha-M; Cd68, macrosialin; Il6, interleukin-6; Il18, interleukin-18; Ccl2, C-C motif chemokine; Cxcl12, C-X-C motif chemokine 12; Adgre1, cell surface glycoprotein F4/80; Nlrp3, NACHT, LRR, and PYD domains-containing protein 3. n = 5–7 mice per group; *p < 0.05. (H) Representative microphotographs of immunofluorescent staining with anti-MyD88 (in red), CD11c (in green), or F4/80 (in red) antibodies of kidney sections from 12-month-old kidney KO and Flox mice fed a chow diet. Nuclei were stained with DAPI (in blue). Scale bars, 100 μm. *p < 0.05.
Figure 6.
Figure 6.. Kidney-specific Gcgr-null mice exhibit substantial renal accumulation of key profibrotic markers
(A) qPCR analysis of kidney fibrotic-related gene expression in 4- to 5-month-old kidney-specific Gcgr knockout (kidney KO) and floxed control (Flox) mice fed a chow diet. Col1a1, collagen type I alpha 1; Acta2, smooth muscle actin; Timp1, metalloproteinase inhibitor 1; Mmp2, matrix metalloproteinase-2; Dcn, proteoglycan decorin; Tgfb1, transforming growth factor beta 1; Ctgf, connective tissue growth factor. n = 5–7 mice per group; *p < 0.05. (B) qPCR analysis of kidney fibrotic-related gene expression in 4- to 5-month-old kidney KO and Flox mice fed a high-fat diet. Col1a2, collagen type I alpha 2; Col3a1, collagen type III alpha 1; Fn1, fibronectin 1; Tgfb1, transforming growth factor beta 1; Ctgf, connective tissue growth factor. n = 5–7 mice per group; *p < 0.05. (C) Representative microphotographs of trichrome-stained kidney sections from 12-month-old kidney KO and Flox mice fed a chow diet. Scale bars, 70 μm. (D) qPCR analysis of kidney profibrotic gene expression in 24-month-old kidney KO and Flox mice fed a chow diet. Col1a1, collagen type I alpha1; Col3a1, collagen type III alpha 1; Col4a1, collagen type IV alpha 1; Fn1, fibronectin 1; Acta2, smooth muscle actin; Tgfb1, transforming growth factor beta 1; Tgfbr1, TGF beta receptor type 1. n = 5–6 mice per group; *p < 0.05. (E) Representative microphotographs of immunofluorescent staining (in red) with anti-collagen I antibody of kidney sections from 24-month-old kidney KO and Flox mice fed a chow diet. Nuclei were stained with DAPI (in blue). Scale bars, 70 μm. *p < 0.05. (F) Representative microphotographs of immunofluorescent staining (in red) with anti-collagen III antibody of kidney sections from 24-month-old kidney KO and Flox mice fed a chow diet. Nuclei were stained with DAPI (in blue). Scale bars, 70 μm. *p < 0.05. (G) Representative microphotographs of immunofluorescent staining (in red) with anti-collagen IV antibody of kidney sections from 24-month-old kidney KO and Flox mice fed a chow diet. Nuclei were stained with DAPI (in blue). Scale bars, 70 μm. *p < 0.05. (H) Representative microphotographs of immunofluorescent staining (in red) with anti-fibronectin antibody of kidney sections from 24-month-old kidney KO and Flox mice fed a chow diet. Nuclei were stained with DAPI (in blue). Scale bars, 70 μm. *p < 0.05. (I) qPCR analysis of gene expression in MDCK cells in response to Gcgr knockdown and TGF-β treatment. Housekeeping gene for canine beta-2-microglobulin was used for normalization of gene transcript levels. Gcgr, glucagon receptor; Acta2, smooth muscle actin; Col1a1, collagen type I alpha 1; Fn1, fibronectin 1. *p < 0.05. (J) Schematic diagram illustrating the effect of kidney-specific Gcgr ablation on renal metabolism and function in mice. Kidney KO mice exhibit metabolically reprogrammed activities and impaired kidney functions. For example, they show hyperaminoacidemia, associated with reduced kidney glucose output. These mutant mice display azotemia, polyuria, and electrolyte imbalance. The deficiency of renal GCGR expression or activity can contribute to the development of chronic kidney disease.

Comment in

References

    1. Webster AC, Nagler EV, Morton RL, and Masson P (2017). Chronic kidney disease. Lancet 389, 1238–1252. - PubMed
    1. GBD; Chronic; Kidney; Disease Collaboration (2020). Global, regional, and national burden of chronic kidney disease, 1990–2017: a systematic analysis for the Global Burden of Disease Study 2017. Lancet 395, 709–733. - PMC - PubMed
    1. Bowe B, Xie Y, Xu E, and Al-Aly Z (2021). Kidney outcomes in long COVID. J. Am. Soc. Nephrol 32, 2851–2862. - PMC - PubMed
    1. Gansevoort RT, Correa-Rotter R, Hemmelgarn BR, Jafar TH, Heerspink HJL, Mann JF, Matsushita K, and Wen CP (2013). Chronic kidney disease and cardiovascular risk: epidemiology, mechanisms, and prevention. Lancet 382, 339–352. - PubMed
    1. Park J, Shrestha R, Qiu C, Kondo A, Huang S, Werth M, Li M, Barasch J, and Suszták K (2018). Single-cell transcriptomics of the mouse kidney reveals potential cellular targets of kidney disease. Science 360, 758–763. - PMC - PubMed

Publication types