. 2024 Mar 26;198(2):246-259.
doi: 10.1093/toxsci/kfae001.

Developmental exposure to pesticides that disrupt retinoic acid signaling causes persistent retinoid and behavioral dysfunction in zebrafish

Affiliations

Developmental exposure to pesticides that disrupt retinoic acid signaling causes persistent retinoid and behavioral dysfunction in zebrafish

Andrew B Hawkey et al. Toxicol Sci. .

Abstract

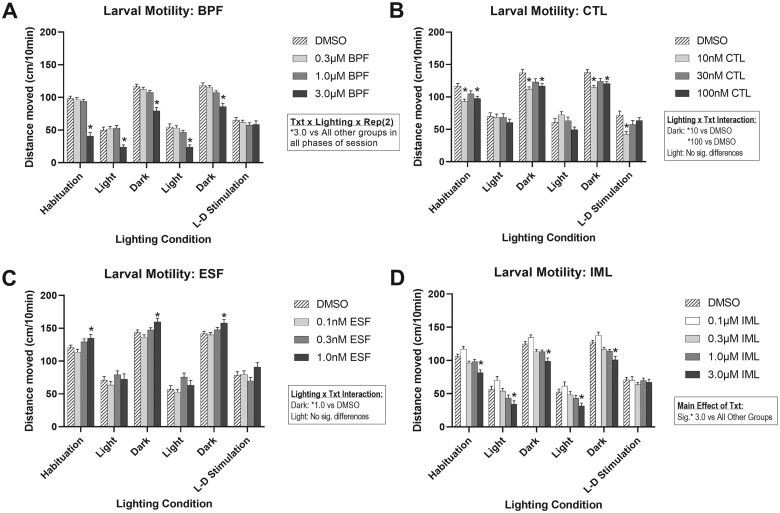
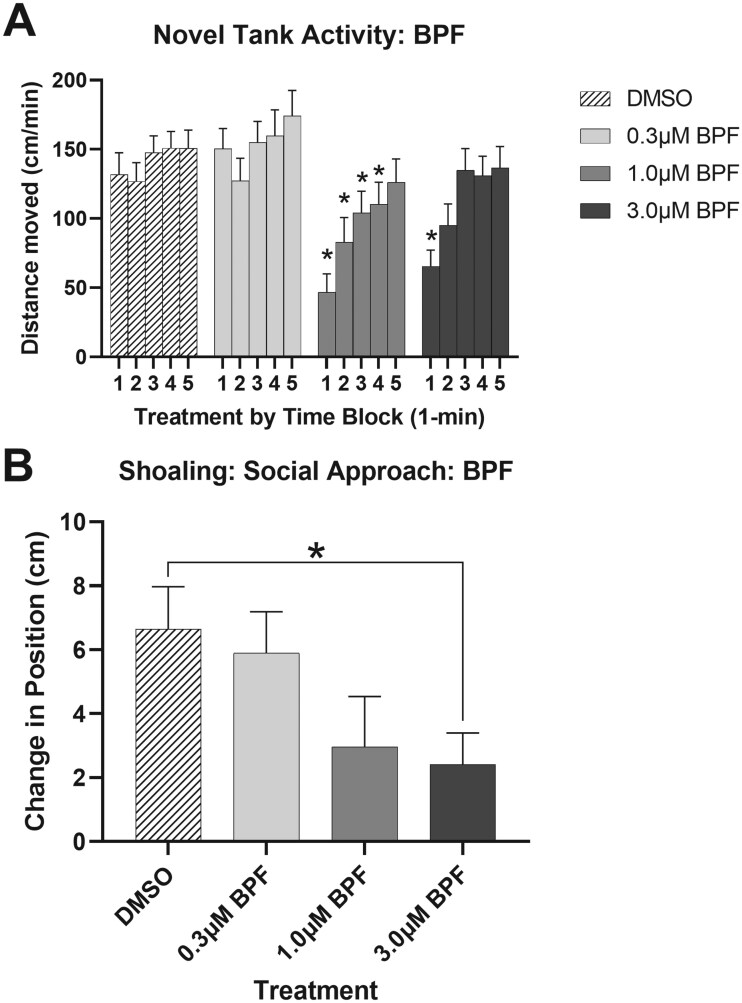
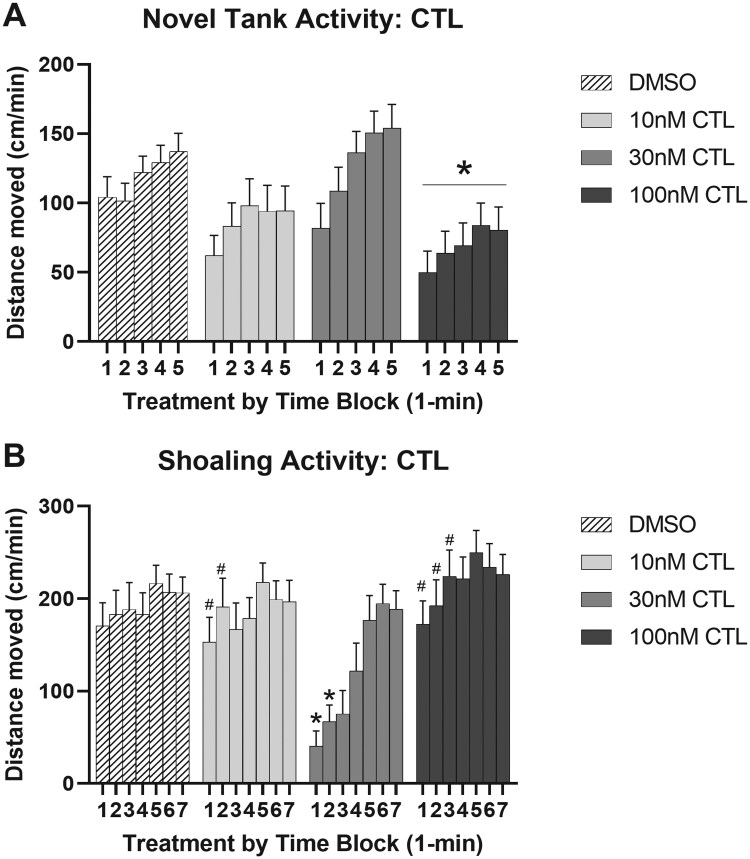
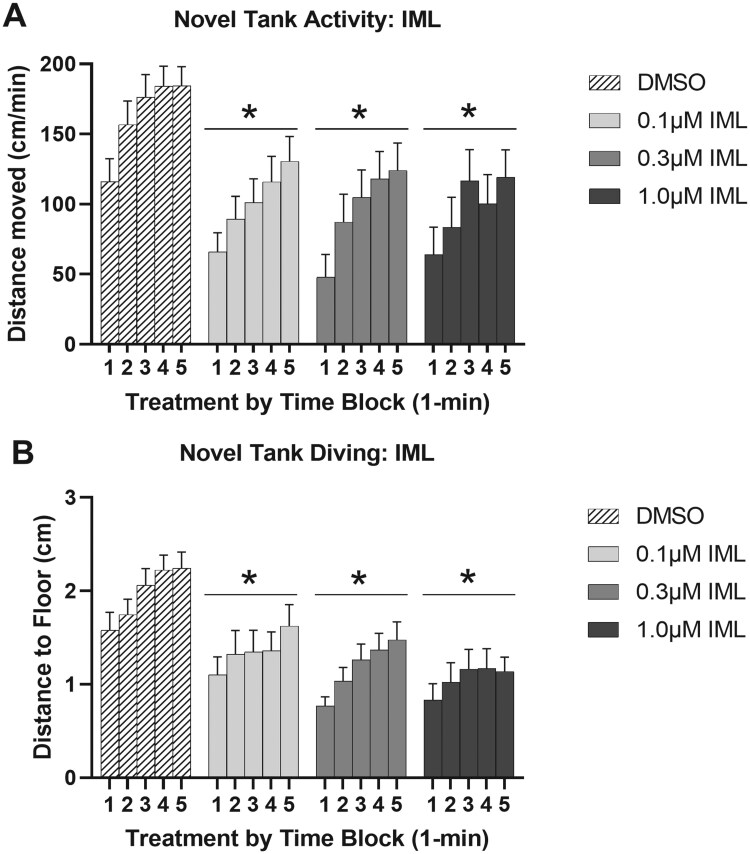
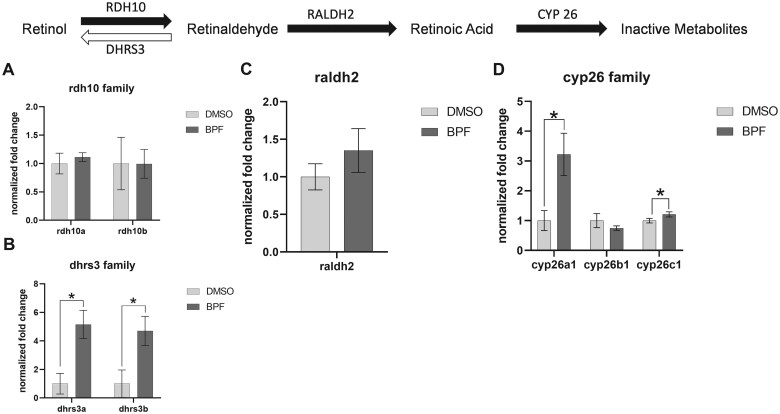
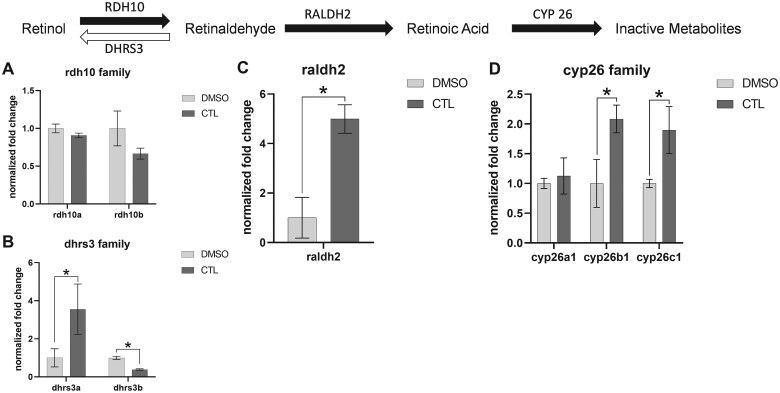
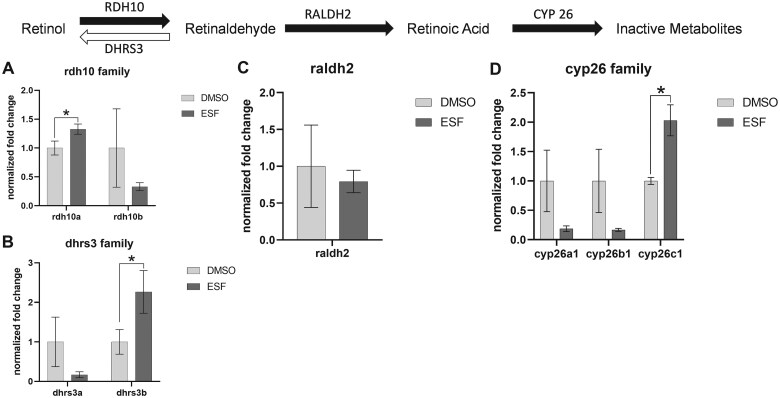
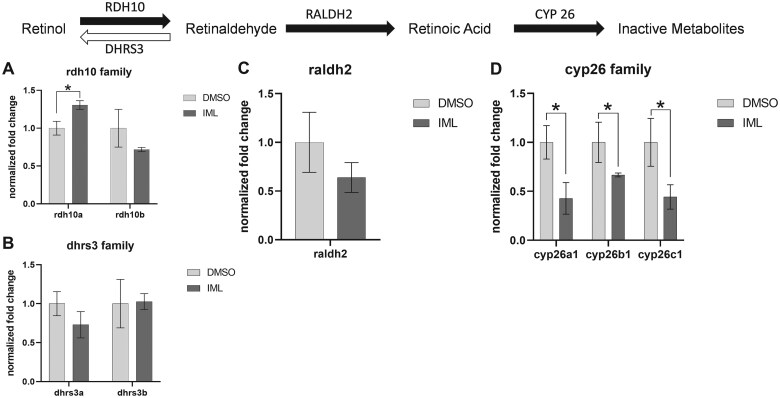
Early developmental exposure to environmental toxicants may play a role in the risk for developing autism. A variety of pesticides have direct effects on retinoic acid (RA) signaling and as RA signaling has important roles in neurodevelopment, such compounds may cause developmental neurotoxicity through an overlapping adverse outcome pathway. It is hypothesized that a pesticide's embryonic effects on retinoid function may correspond with neurobehavioral disruption later in development. In the current studies, we determined the effects of RA-acting pesticides on neurobehavioral development in zebrafish. Buprofezin and imazalil caused generalized hypoactivity in the larval motility test, whereas chlorothalonil and endosulfan I led to selective hypoactivity and hyperactivity, respectively. With buprofezin, chlorothalonil, and imazalil, hypoactivity and/or novel anxiety-like behaviors persisted in adulthood and buprofezin additionally decreased social attraction responses in adulthood. Endosulfan I did not produce significant adult behavioral effects. Using qPCR analyses of adult brain tissue, we observed treatment-induced alterations in RA synthesis or catabolic genes, indicating persistent changes in RA homeostasis. These changes were compound-specific, with respect to expression directionality, and potential patterns of homeostatic disruption. Results suggest the likely persistence of disruptions in RA signaling well into adulthood and may represent compensatory mechanisms following early life stage exposures. This study demonstrates that early developmental exposure to environmental toxicants that interfere with RA signaling causes short as well as long-term behavioral disruption in a well-established zebrafish behavioral model and expand upon the meaning of the RA adverse outcome pathway, indicating that observed effects likely correspond with the nature of underlying homeostatic effects.

Keywords: development; neurobehavioral toxicology; retinoic acid receptors; zebrafish.


Figures

Figure 1.
Figure 1.
Larval motility effects of RAR-transactivating pesticides. Locomotor activity, measured as distance moved (cm/10 min), and dark-induced stimulation (dark-light, avg in cm) are shown for each pesticide, split by phase within the session as relevant (5 × 10 min photoperiods). A, Main effect of BPF treatment, regardless of lighting. About 3.0 µM BPF caused generalized deficits in swimming across the session, relative to all other groups. B, Interaction of CTL treatment and lighting level (light/dark). About 10 and 100 µM CTL caused hypoactivity relative to controls under stimulated (dark) activity conditions. About 10 µM CTL also led to reduced dark-induced stimulation relative to controls. C, Interaction of ESF treatment and lighting level (light/dark). 1 nM ESF caused hyperactivity relative to controls under stimulated (dark) activity conditions. D, Main effect of IML treatment, regardless of lighting. About 3 µM IML caused generalized hypoactivity relative to all other groups. Data are expressed as mean ± SEM. Asterisk (*) indicates significance relative to controls. Text boxes report the effect which generated post-hoc testing and the results of those post-hoc tests. N’s = BPF 51–84; CTL 46–62; ESF 54–58; IML 44–81.
Figure 2.
Figure 2.
Adult neurobehavioral effects of embryonic BPF EXPOSURE. Locomotor activity in the novel tank test, measured as distance moved (cm/min × 5 min) (panel A), and change in position due to the social stimulus in the shoaling test (distance from screen in cm, prevideo-during video) (panel B) are shown. A, 1.0 and 3.0 µM BPF caused reductions in swimming early in the session, relative to controls. B, 3.0 µM BPF caused a significant reduction in attraction to the social video (change in position in cm) relative to controls. Data are expressed as mean ± SEM. Asterisk (*) indicates significance relative to controls. N = 28–32.
Figure 3.
Figure 3.
Adult neurobehavioral effects of embryonic CTL exposure. Locomotor activity in the novel tank and shoaling tests, measured as distance moved (cm/min) is shown. A, 100 nM CTL caused a generalized reduction in swimming within the novel tank session, relative to controls. B, 30 nM CTL caused a reduction in locomotor activity relative to all other groups at the beginning of the shoaling test session. Data are expressed as mean ± SEM. Asterisk (*) indicates significance relative to controls. Pound (#) indicates significance relative to the 30 nM CTL group. N = 27–39.
Figure 4.
Figure 4.
Adult neurobehavioral effects of embryonic IML exposure. Locomotor activity in the novel tank test, measured as distance moved (cm/min × 5 min) (Panel A), and anxiety-like diving responses in the novel tank test (distance from floor, in cm × 5 min) (panel B) are shown. A, 0.1, 0.3, and 1 µM IML caused generalized reductions in swimming across the novel tank session, relative to controls. B, 0.1, 0.3, and 1 µM IML caused generalized enhancements of the diving response (closer to the floor) in the novel tank session, relative to controls. Data are expressed as mean ± SEM. Asterisk (*) indicates significance relative to controls. N = 20–32.
Figure 5.
Figure 5.
BPF 3 µM expression of genes involved in retinoic acid metabolism. qPCR results of adult brain tissue are reported for each of the 4 gene families involved in RA homeostasis (normalized fold change of 3 µM BPF vs controls). A, No effects of BPF on Rdh10 mRNA levels. B, BPF caused increases in Dhrs3a and 3b mRNA relative to controls. C, No effects of BPF on Raldh2 mRNA levels. D, BPF caused increases in Cyp26a1 and c1 mRNA relative to controls. Cyp26b1 was not significantly affected. Data are expressed as mean ± SEM. Asterisk (*) indicates significance relative to controls. N = 3 replicates.
Figure 6.
Figure 6.
CTL 100 nM expression of genes involved in retinoic acid metabolism. qPCR results of adult brain tissue are reported for each of the 4 gene families involved in RA homeostasis (normalized fold change of 100 nM CTL vs controls). A, No effects of CTL on Rdh10 mRNA levels. B, CTL caused opposing effects in Dhrs3a (increased) and 3 b (decreased) mRNA relative to controls. C, CTL caused an increase in Raldh2 mRNA levels relative to controls. D, CTL caused increases in Cyp26b1 and c1 mRNA relative to controls. Cyp26a1 was not significantly affected. Data are expressed as mean ± SEM. Asterisk (*) indicates significance relative to controls. N = 3 replicates.
Figure 7.
Figure 7.
ESF 1 nM expression of genes involved in retinoic acid metabolism. qPCR results of adult brain tissue are reported for each of the 4 gene families involved in RA homeostasis (normalized fold change of 1 nM ESF vs controls). A, ESF caused an increase in Rdh10a mRNA relative to controls. Rdh10b was not significantly affected. B, ESF caused an increase in Dhrs3b mRNA relative to controls. Dhrs3a was not significantly affected. C, No effects of ESF on Raldh2 mRNA levels. D, ESF caused an increase in Cyp26c1 mRNA relative to controls. Cyp26a1 and b1 were not significantly affected. Data are expressed as mean ± SEM. Asterisk (*) indicates significance relative to controls. N = 3 replicates.
Figure 8.
Figure 8.
IML 1 µM expression of genes involved in retinoic acid metabolism. qPCR results of adult brain tissue are reported for each of the 4 gene families involved in RA homeostasis (normalized fold change of 1 µM IML vs controls). A, IML caused an increase in Rdh10a mRNA relative to controls. Rdh10b was not significantly affected. B, No effects of IML on Dhrs3 mRNA levels. C, No effects of IML on Raldh2 mRNA levels. D, IML caused an increase in Cyp26a1, b1, and c1 mRNA relative to controls. Data are expressed as mean ± SEM. Asterisk (*) indicates significance relative to controls. N = 3 replicates.

Similar articles

Cited by

References

    1. Bailey J. M., Oliveri A. N., Karbhari N., Brooks R. A., Amberlene J., Janardhan S., Levin E. D. (2016). Persistent behavioral effects following early life exposure to retinoic acid or valproic acid in zebrafish. Neurotoxicology 52, 23–33. - PMC - PubMed
    1. Ballard M. S., Sun M., Ko J. (2012). Vitamin a, folate, and choline as a possible preventive intervention to fetal alcohol syndrome. Med. Hypotheses. 78, 489–493. - PubMed
    1. Bedois A. M., Parker H. J., Krumlauf R. (2021). Retinoic acid signaling in vertebrate hindbrain segmentation: Evolution and diversification. Diversity 13, 398.
    1. Chaliha D., Albrecht M., Vaccarezza M., Takechi R., Lam V., Al-Salami H., Mamo J. (2020). A systematic review of the valproic-acid-induced rodent model of autism. Dev. Neurosci. 42, 12–48. - PubMed
    1. Chen H., Chidboy M. A., Robinson J. F. (2020). Retinoids and developmental neurotoxicity: Utilizing toxicogenomics to enhance adverse outcome pathways and testing strategies. Reprod. Toxicol. 96, 102–113. - PMC - PubMed