. 2024 Jan 18;7(4):e202402568.
doi: 10.26508/lsa.202402568. Print 2024 Apr.

Synaptobrevin2 monomers and dimers differentially engage to regulate the functional trans-SNARE assembly

Affiliations

Synaptobrevin2 monomers and dimers differentially engage to regulate the functional trans-SNARE assembly

Swapnali S Patil et al. Life Sci Alliance. .

Abstract

The precise cell-to-cell communication relies on SNARE-catalyzed membrane fusion. Among ∼70 copies of synaptobrevin2 (syb2) in synaptic vesicles, only ∼3 copies are sufficient to facilitate the fusion process at the presynaptic terminal. It is unclear what dictates the number of SNARE complexes that constitute the fusion pore assembly. The structure-function relation of these dynamic pores is also unknown. Here, we demonstrate that syb2 monomers and dimers differentially engage in regulating the trans-SNARE assembly during membrane fusion. The differential recruitment of two syb2 structures at the membrane fusion site has consequences in regulating individual nascent fusion pore properties. We have identified a few syb2 transmembrane domain residues that control monomer/dimer conversion. Overall, our study indicates that syb2 monomers and dimers are differentially recruited at the release sites for regulating membrane fusion events.


Conflict of interest statement

The authors declare that they have no conflict of interest.

Figures
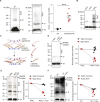
Figure 1.
Figure 1.. Syb2 dimer level in the donor membrane reduces during the SNARE complex assembly.
(A) Left—representative immunoblots showing the presence of syb2 monomers (M) and dimers (D) in synaptic vesicles (SVs) isolated from rat brains. The antibody used is mentioned. n = 10 independent blots; N = 4 independent SV isolation. Middle—representative immunoblots showing the presence of syb2 monomers (M) and dimers (D) in synaptosome fractions isolated from rat brains. The antibody used is mentioned. n = 7 independent blots; N = 3 independent synaptosome isolation. Right—dimer-to-monomer band intensity ratio is plotted as “Dimer: monomer ratio” corresponding to SV (black) and synaptosome (red). n = 7 independent blots; N = 3 independent isolation; individual data points are shown along with the mean ± SEM. The t test was performed to compare the two means, ***P < 0.001. (B) Representative immunoblot showing the presence of syb2 monomers (M) and dimers (D) in the purified protein syb2 and syb2 present in the reconstituted membranes—v-lipo and nanodisks (ND5S). The antibody used is mentioned. n = 3 independent experiments. (C) Illustration shows the involvement of syb2 monomers (M) and dimers (D) in the trans-SNARE assembly. (D) Left panel—representative immunoblots showing syb2 monomers (M) and dimers (D) in v-lipos in the absence (v-lipo) and presence (v-lipo + t-lipo) oft-lipos. SNARE complex formation is indicated. Right panel, band intensities corresponding to v-SNARE plus t-lipos (v-lipo + t-lipo) have been normalized to v-lipos, for syb2 monomers (black) and dimers (red). n = 6 independent experiments; individual data points are shown along with the mean ± SEM; N = 2 different liposome preparations. (E) Left panel—representative immunoblots showing syb2 monomers (M) and dimers (D) in v-SNARE NDs in the absence (ND5S) and presence (ND5S + t-lipo) of t-lipos. SNARE complex formation is indicated. Right panel, band intensities corresponding to ND5S plus t-lipos (ND5S + t-lipo) have been normalized to ND5S, for syb2 monomers (black) and dimers (red). n = 5 independent experiments; individual data points are shown along with the mean ± SEM; N = 3 different liposome preparations. (F) Left panel—representative immunoblots showing syb2 monomers (M) and dimers (D) in SVs in the absence (SV) and presence (SV + t-lipo) of t-lipos. SNARE complex formation is indicated. Right panel, band intensities corresponding to SV plus t-lipos (SV + t-lipo) have been normalized to SV, for syb2 monomers (black) and dimers (red). n = 4 independent experiments; individual data points are shown along with the mean ± SEM; N = 2 different SV preparations. The antibodies used are mentioned for all the immunoblots. Source data are available for this figure.
Figure S1.
Figure S1.. SV isolation and characterization.
(A, B) Representative dot blots showing the presence of Hsc70, syb2, and PSMC6 in different sucrose cushion fractions (numbered) and pellet (P), isolated during SV preparation (see the Materials and Methods section). Respective antibodies are indicated. n = 4 independent sets of experiments. (C) SV-resident syb2 was quantified in the immunoblot using recombinant syb2 standards with known concentrations. n = 3. (D) Representative immunoblot showing the effect of cross-linker DSP on the syb2 dimer population. The antibody used, syb2 dimers (D), and monomers (M) are indicated. Source data are available for this figure.
Figure S2.
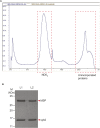
Figure S2.. ND5S preparation using SEC.
(A) Representative chromatogram showing the UV (280 nm) profile for ND5S purification in SEC (size-exclusion chromatography). The respective peaks for NDs and unincorporated proteins are marked. (B) Representative Coomassie-stained gel showing MSP (membrane scaffolding protein, MSPE3D1) and syb2 bands (marked with red arrows) in purified ND5 samples. L1 and L2 are two independent preparations. Source data are available for this figure.
Figure S3.
Figure S3.. Mass spectrometry of syb2 monomers and dimers.
Top—representative mass spectrum of syb2 monomers and dimers. Syb2 monomers and dimers were trypsin-digested and subjected to mass spec, as indicated in Fig. The m/z (mass/charge) value corresponding to each of the trypsin-digested syb2 peptides is also indicated. Bottom—a table comparing predicted and experimental masses of trypsin-digested peptides is shown.
Figure S4.
Figure S4.. Characterization of the SNARE complex assembly.
(A) Representative immunoblot showing the presence of the SNARE complex when v-lipos are treated with t-lipo; the antibody used was SNAP-25B, as indicated. n = 3 independent sets of experiments, three sets of liposomes. (B) Representative immunoblot showing the presence and absence of the SNARE complex, before and after heating the reaction mixtures at 95°C, respectively. Here, ND5S were treated with t-SNARE liposomes; the antibody used was SNAP-25B, as indicated. n = 3 independent sets of experiments. (C) Representative immunoblot showing the absence and presence of the SNARE complex, after and before heating the reaction mixtures at 95°C, respectively. Here, SVs were treated with t-SNARE liposomes; the antibody used was syb2, as indicated. n = 3 independent sets of experiments. Source data are available for this figure.
Figure S5.
Figure S5.. Quantification of higher order syb2 oligomers.
From the immunoblots of Fig 1E, the band intensity ratio corresponding to ND5S plus t-SNARE liposomes (t-lipo) was normalized to ND5S, for syb2 D/M (dimer:monomer ratio, red), for syb2 Tr/M (trimer:monomer ratio, blue), and for syb2 Te/M (tetramer:monomer ratio, green). n = 3 independent experiments; individual data points are shown along with the mean ± SEM. The t test was performed to compare the two means, *P < 0.05, ns, not significant.
Figure 2.
Figure 2.. Syb2 dimers engage in the SNARE complex assembly.
(A) Illustration shows the increase in fluorescently labeled syb2 dimer (D) population, during the SNARE assembly in the presence of t-SNARE heterodimers (T), as indicated. The syb2 monomers (M), labeled at C103 position in TMD with either cy3 (green) or cy5 (blue) fluorescent dyes, are indicated. (B) Representative data showing the change in fluorescence intensity with time, when t-lipo reacts with fluorescently labeled syb2 in v-lipo - v-lipocy3/cy5 (v-lipocy3/cy5:t-lipo—1:1 for black square, 1:6 for red circle). n = 4 independent experiments. (C) Pooled data from (B), showing fold change in maximum fluorescence intensity relative to v-lipocy3/cy5 alone; n = 4 independent experiments; individual data points are shown along with the mean ± SEM. (D) Reaction between ND5Scy3/cy5 (fluorescently labeled syb2 reconstituted in NDs) and t-lipo was resolved in SDS–PAGE and developed under fluorescence imager (excitation and emission wavelengths are 532 and 670 nm, respectively). Bands corresponding to SNARE complexes and the syb2 dimer (D) are indicated. n = 3 independent experiments. Source data are available for this figure.
Figure 3.
Figure 3.. Syb2 monomer and dimer engagement in the SNARE assembly depends on the acceptor membrane’s t-SNARE abundance.
(A) Representative immunoblots showing syb2 monomers (M) and dimers (D) in ND5S in the absence and presence of t-lipos, harboring varying t-SNARE copies as indicated. The antibody used is mentioned. n = 3 independent experiments. (A, B) Band intensities corresponding to monomers (black, left panel) and dimers (red, right panel) in the presence of t-lipos (as described in (A)) are plotted after normalizing with the corresponding band intensities of ND5S alone (t-lipo: 0). n = 3 independent experiments; individual data points are shown along with the mean ± SEM. (C) Representative immunoblots showing syb2 monomers (M), dimers (D), syp, and syt1 in SVs, before and after treating with t-lipos. Here, the number of SVs was kept constant, whereas the number of t-lipos was varied, as indicated by the ratios. SNARE complex formation is indicated. The antibodies used are mentioned. n = 4 independent experiments; N = 2 different SV preparations. (D) Band intensity corresponding to monomers (black), dimers (red), syp (green), and syt1 (purple) in the presence of t-lipos (as described in (C)) is plotted after normalizing with the corresponding band intensities of SV alone (SV: t-lipo—1:0). n = 4 independent experiments; data are represented as the mean ± SEM. Source data are available for this figure.
Figure S6.
Figure S6.. ND reconstitution with varying syb2 copies.
An illustration shows the presence of different syb2 copies (3—ND3S, 5—ND5S, and 7—ND7S) reconstituted in NDs, as indicated.
Figure 4.
Figure 4.. Syb2 dimers are dynamic in reconstituted membranes and SVs.
(A) Representative immunoblots showing syb2 monomers (M) and dimers (D) in NDs reconstituted with 3 (ND3S), 5 (ND5S), and 7 (ND7S) syb2 copies, in the absence and presence of t-lipos. SNARE complex formation is indicated. The antibody used is mentioned. n = 3 independent experiments; N = 2 different ND preparations. (B) Dimer-to-monomer band intensity ratio was normalized to ND3S without t-lipos (black square), and is plotted as “Dimer: monomer ratio” corresponding to ND3S with t-lipo (red square), ND5S without (black circle) and with (red circle) t-lipo, and ND7S without (black triangle) and with (red triangle) t-lipo. n = 3 independent experiments; N = 2 different ND preparations; individual data points are shown along with the mean ± SEM. (C) Illustration shows that the syb2 copy numbers impact D/M in the donor membrane. During the trans-SNARE assembly, syb2 dimers significantly reduce upon interaction with the t-SNAREs in the acceptor membrane. (D) Representative immunoblots showing syb2 monomers (M) and dimers (D) in syb2-reconstituted NDs with varying diameters, as indicated; suffixes “S” and “L” indicate small and large diameter NDs, respectively. The antibody used is mentioned. n = 5 independent experiments; N = 3 different ND preparations. (E) Dimer-to-monomer band intensity ratio is plotted for all NDs (as indicated). n = 5 independent experiments; N = 3 different ND preparations. The t test was performed to compare the two means, *P < 0.05 and ns > 0.05. (F) Illustration shows the impact of syb2 density on the donor membrane’s D/M. (G) Top panel, representative immunoblot showing the effect of membrane lipids on syb2 D/M. Lipid composition for ND5S and the antibody used are mentioned. Bottom panel, dimer-to-monomer band intensity ratio was normalized to ND5S composed of PE, PC, and PS (black). Data for ND5S composed of PC alone are shown in red. n = 3 independent experiments; individual data points are shown along with the mean ± SEM. The t test was performed to compare the two means, **P < 0.01. (H) Top panel, representative immunoblot showing the effect of membrane lipids on syb2 D/M. Lipid composition for ND5S and the antibody used are mentioned. Bottom panel, dimer-to-monomer band intensity ratio was normalized to ND5S composed of PC alone (black). Data for ND5S composed of PC, PE (red), PC, PS (blue), and PC, PE, PS (green) are shown. n = 3 independent experiments; individual data points are shown along with the mean ± SEM. The t test was performed to compare the means, **P < 0.01. (I) Top panel, representative immunoblot showing the effect of cholesterol on syb2 D/M. Lipid composition for ND5S and the antibody used are mentioned. Bottom panel, dimer-to-monomer band intensity ratio is plotted as a function of ND5S membrane’s cholesterol content; individual cholesterol (mol%) concentrations are indicated by black, red, blue, green, and purple. n = 3 independent experiments; individual data points are shown along with the mean ± SEM. The t test was performed to compare the two means, *P < 0.05. (J) Left panel, representative immunoblot showing syb2 monomers (M) and dimers (D) in SVs after MβCD treatment for the respective time (in hour), as indicated. Right panel, dimer band intensities for different time points were normalized to the band intensity corresponding to 0.5-h treatment, and are plotted as a function of incubation time (hr.). n = 3 independent experiments; individual data points are shown along with the mean ± SEM. N = 2 independent SV isolation. (K) Left panel, representative immunoblot showing syb2 monomers (M) and dimers (D) in ND5S with (+) or without (−) syt1. The total number of syb2 molecules was the same in both the ND preparations. Right panel, dimer-to-monomer band intensity ratio was normalized to ND5S without syt1 (black). Data for ND5S containing syt1 are shown in red. n = 3 independent experiments; individual data points are shown along with the mean ± SEM. The t test was performed to compare the two means, *P < 0.05. Source data are available for this figure.
Figure S7.
Figure S7.. Transmission electron micrograph images of ND samples.
Representative transmission electron micrograph images of ND5S (left panel) and ND55L (right panel) are shown. Scale bars are indicated. n = 3.
Figure S8.
Figure S8.. Syb2 dimer population during the SNARE assembly in the case of ND5L.
(A) Representative immunoblot showing the decrease in syb2 dimers upon t-lipo addition. The dimers (D) and monomers (M) are indicated. The antibody used is mentioned. n = 3 independent experiments. (B) Representative immunoblot showing the presence and absence of the SNARE complex before and after heating the reaction at 95°C, respectively, as the ND5L reacts with t-SNARE liposomes. The dimers (D) are indicated. The antibody used is mentioned. n = 3 independent experiments. Source data are available for this figure.
Figure S9.
Figure S9.. Role of membrane lipids and effect of cross-linked syb2 TMD on glutamate release.
(A) Representative traces showing the time course of glutamate release under indicated conditions. Top panel—membrane lipids were varied; bottom panel—a maleimide–PEG cross-linker was used to cross-link syb2 TMD (membrane lipids—PE/PS/PC). (B) Maximum percentage (%) of glutamate release for the indicated conditions is compared. Error bars indicate the SEM from seven/five independent trials under the conditions mentioned; three independent sets of NDs were used. The t test was performed to compare the two means; *P < 0.05.
Figure 5.
Figure 5.. Syb2 monomer and dimer abundance impacts individual fusion pore properties.
(A) Representative traces of single pores for ND5S (top), ND5L (middle), and ND55L (bottom), as indicated. Three different epochs of the raw traces—beginning, middle, and end—are shown. The ND5L pore’s current axis is enlarged and shown below, within the box. Closed (C), open (O), and partial open (P) states are indicated with the respective currents. (A, B) Current histograms corresponding to the traces shown in (A) (ND5S—top; ND5L—middle; and ND55L—bottom). Closed (C) and open (O) states are indicated. (C) Individual pore currents are plotted for ND5S, ND5L, and ND55L, mean ± SEM (n = 3 independent BLMs, each for ND5S and ND5L; 4 independent BLMs for ND55L; two different ND preparations were used). The t test was performed, ***P < 0.001 and *P < 0.05. (D) Open dwell time histograms of pores, as indicated. n = 3 independent BLMs, each for ND5S and ND5L; four independent BLMs for ND55L; two sets of NDs of each type were used.
Figure 6.
Figure 6.. Syb2 TMD residues that control D/M also regulate pore properties.
(A) Illustration shows the syb2 reconstituted in NDs (ND-syb2); syb2 TMD residues mutated in this set of studies are highlighted in the inset. (B) Representative immunoblot showing the presence of syb2 monomers (M) and dimers (D) in ND5S (WT and mutants as indicated), before (−) and after (+) the addition of t-lipo. The antibody used is mentioned. n = 5 (for WT), 8 (each for V101A and I105A), and 4 (for All ItoA). (C) Dimer-to-monomer band intensity ratio was normalized to WT syb2 reconstituted in ND5S without t-lipos (filled black), and is plotted as “Dimer: monomer ratio” (D/M). Individual data points corresponding to ND5S reconstituted with WT, V101A, I105A, and All ItoA syb2 mutants are represented as black, red, blue, and green, respectively. Data points without and with t-lipos are represented as “filled” and “empty” diamonds, respectively. n = 5 (for WT), 8 (each for V101A and I105A), and 4 (for All ItoA); the mean ± SEM are shown. (D) Lipid mixing (%) between t-lipo and fluorescently labeled ND5S reconstituted with WT and different syb2 mutants; plotted as a function of time (in seconds). n = 3 independent experiments; data are presented as the mean ± SEM. (E) Half-time (t1/2) for all the traces from (E) is plotted. n = 3 independent experiments; individual data points are shown with the mean ± SEM. The t test was performed to compare the two means, **P < 0.01 and *P < 0.05. (F) Representative traces of single pores for ND5S, ND5S(All ItoA), ND5S(V101A), and ND5S(I105A) (top to bottom), as indicated. Three different epochs of the raw traces—beginning, middle, and end—are shown. Closed (C), open (O), and partial open (P) states are indicated with the respective currents. (G) Open dwell time histogram of pores, as indicated. n = 4 independent BLMs, each for ND5S, ND5S(All ItoA), ND5S(V101A), and ND5S(I105A) (left to right); three sets of NDs of each type were used. Source data are available for this figure.
Figure S10.
Figure S10.. Effect of syb2 TMD mutations on dimerization.
(A, B) Representative immunoblots showing the presence of syb2 monomers (M) and dimers (D) in ND5S (WT and mutants as indicated), n = 3. (C) Data from different experiments are plotted to compare the syb2 TMD mutants’ ability to form dimers. A normalized dimer-to-monomer ratio (D/M) is plotted. The t test was performed to compare the two means, ns, not significant. Source data are available for this figure.
Figure S11.
Figure S11.. SNARE complex formation by mutated syb2 reconstituted in NDs.
Representative immunoblot showing the presence of the SNARE complex when ND5S bearing indicated syb2 variants (WT, V101A, I105A, and All ItoA) are treated with t-SNARE liposomes; the antibody used was SNAP-25B, as indicated. n = 3 independent sets of experiments. Source data are available for this figure.
Figure S12.
Figure S12.. Current histogram of pores formed by WT and mutant syb2.
(A, B) Current histograms corresponding to the traces shown in 6f; (A) ND5S, ND5S(All ItoA), and (B) ND5S(V101A) and ND5S(I105A), as indicated. Closed (C), open (O), and partial open (P) states are indicated.
Figure S13.
Figure S13.. Effect of syb2 TMD mutations on fusion pore regulation.
(A) Representative traces of single pores for ND5S (L99W) (top) and ND5S (C103W) (bottom), as indicated. Three different epochs of the raw traces—beginning, middle, and end—are shown. Closed (C) and open (O) states are indicated with the respective currents. (A, B) Current histograms corresponding to the traces shown in (A), (ND5S (L99W)—top; and ND5S (C103W)—bottom). Closed (C) and open (O) states are indicated. (C) Open dwell time histograms of pores for ND5S (L99W) (top) and ND5S (C103W) (bottom), as indicated. n = 3 independent BLMs; two sets of NDs of each type were used.
Figure 7.
Figure 7.. Syb2 dimers are involved in stimulated secretion from PC12 cells.
(A) Illustration shows the design of syb2/mCherry 11 and syb2/half-mCherry constructs. (B) Illustration of the BiFC approach used to visualize the formation of syb2 dimers in PC12 cells. mCherry fragments used in this assay are marked as mCherry N and mCherry C. (C) Representative images showing mCherry signal (561/610-nm ex/em wavelength) in PC12 cells transfected with syb2/half-mCherry and syb2/split-mCherry constructs compared with untransfected cells (scale bar—5 μm). (D) Left top—Representative images of syb2/split-mCherry–transfected cells loaded with FM1-43 (488/570-nm ex/em wavelengths) imaged at different time points before and after 70 mM KCl stimulation (scale bar—5 μm). Left bottom, the resliced images of a mCherry region at the plasma membrane imaged during the live-cell experiment over 150 s (stimulation marked by the orange arrow). Right—normalized FM1-43 and mCherry signal intensity variations at the plasma membrane with time, before and after stimulation (marked by the orange arrow). n = 9, N = 3, where n is the number of cells analyzed, and N is the number of independent experiments. Data are represented as the mean ± SEM.
Figure S14.
Figure S14.. Cloning strategy for syb2/split-mCherry construct.
(A, B) Illustration shows the plasmid map of (A) syb2/split-mCherry and (B) syb2/half-mCherry. The CMV promoter (green), coding sequences (purple), and IRES (orange) are indicated in the illustrations.
Figure S15.
Figure S15.. Bleaching control for mCherry signal intensity.
(A) Representative images of syb2/split-mCherry–transfected PC12 cells loaded with FM1-43, imaged at different time points over 150 s (scale bar—5 μm). (A, B) Data obtained from panel (A) are quantified and plotted as normalized mCherry intensity with time. n = 6, N = 3, where n is the number of cells analyzed, and N is the number of independent trials. Data are represented as the mean ± SEM.
Figure 8.
Figure 8.. Model describing syb2 monomer and dimer differential role in SNARE-mediated membrane fusion.
(A) Illustration describes different factors controlling the syb2 D/M (D—dimers; M—monomers). Upward and downward red arrows indicate increased and decreased D/M, respectively. (B) Illustration describes the differential engagement of syb2 monomers and dimers in organizing the fusion pore assembly. Monomers and dimers are shown. Upward and downward red arrows indicate increased and decreased D/M, respectively.

Similar articles

References

    1. Ahmed S, Holt M, Riedel D, Jahn R (2013) Small-scale isolation of synaptic vesicles from mammalian brain. Nat Protoc 8: 998–1009. 10.1038/nprot.2013.053 - DOI - PubMed
    1. Bao H, Goldschen-Ohm M, Jeggle P, Chanda B, Edwardson JM, Chapman ER (2016) Exocytotic fusion pores are composed of both lipids and proteins. Nat Struct Mol Biol 23: 67–73. 10.1038/nsmb.3141 - DOI - PMC - PubMed
    1. Bao H, Das D, Courtney NA, Jiang Y, Briguglio JS, Lou X, Roston D, Cui Q, Chanda B, Chapman ER (2018) Dynamics and number of trans-SNARE complexes determine nascent fusion pore properties. Nature 554: 260–263. 10.1038/nature25481 - DOI - PMC - PubMed
    1. Barg S, Knowles MK, Chen X, Midorikawa M, Almers W (2010) Syntaxin clusters assemble reversibly at sites of secretory granules in live cells. Proc Natl Acad Sci U S A 107: 20804–20809. 10.1073/pnas.1014823107 - DOI - PMC - PubMed
    1. Becher A, Drenckhahn A, Pahner I, Margittai M, Jahn R, Ahnert-Hilger G (1999) The synaptophysin-synaptobrevin complex: A hallmark of synaptic vesicle maturation. J Neurosci 19: 1922–1931. 10.1523/JNEUROSCI.19-06-01922.1999 - DOI - PMC - PubMed

Publication types

LinkOut - more resources