Related health burden with the improvement of air quality across China
- PMID: 38238152
- PMCID: PMC11611245
- DOI: 10.1097/CM9.0000000000002974
Related health burden with the improvement of air quality across China
Abstract
Background: Substantial progress in air pollution control has brought considerable health benefits in China, but little is known about the spatio-temporal trends of economic burden from air pollution. This study aimed to explore their spatio-temporal features of disease burden from air pollution in China to provide policy recommendations for efficiently reducing the air pollution and related disease burden in an era of a growing economy.
Methods: Using the Global Burden of Disease method and willingness to pay method, we estimated fine particulate matter (PM 2.5 ) and/or ozone (O 3 ) related premature mortality and its economic burden across China, and explored their spatio-temporal trends between 2005 and 2017.
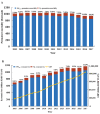
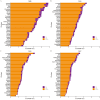
Results: In 2017, we estimated that the premature mortality and economic burden related to the two pollutants were RMB 0.94 million (68.49 per 100,000) and 1170.31 billion yuan (1.41% of the national gross domestic product [GDP]), respectively. From 2005 to 2017, the total premature mortality was decreasing with the air quality improvement, but the economic burden was increasing along with the economic growth. And the economic growth has contributed more to the growth of economic costs than the economic burden decrease brought by the air quality improvement. The premature mortality and economic burden from O 3 in the total loss from the two pollutants was substantially lower than that of PM 2.5 , but it was rapidly growing. The O 3 -contribution was highest in the Yangtze River Delta region, the Fen-Wei Plain region, and some western regions. The proportion of economic burden from PM 2.5 and O 3 to GDP significantly declined from 2005 to 2017 and showed a decreasing trend pattern from northeast to southwest.
Conclusion: The disease burden from O 3 is lower than that of PM 2.5 , the O 3 -contribution has a significantly increasing trend with the growth of economy and O 3 concentration.
Copyright © 2024 The Chinese Medical Association, produced by Wolters Kluwer, Inc. under the CC-BY-NC-ND license.
Conflict of interest statement
None.
Figures


Similar articles
-
Coordinated health effects attributable to particulate matter and other pollutants exposures in the North China Plain.Environ Res. 2022 May 15;208:112671. doi: 10.1016/j.envres.2021.112671. Epub 2022 Jan 6. Environ Res. 2022. PMID: 34999023
-
[Influence of PM2.5 Pollution on Health Burden and Economic Loss in China].Huan Jing Ke Xue. 2021 Apr 8;42(4):1688-1695. doi: 10.13227/j.hjkx.202008313. Huan Jing Ke Xue. 2021. PMID: 33742804 Chinese.
-
[Dynamic Assessment of PM2.5 Health Damage Value in China from 2015 to 2018].Huan Jing Ke Xue. 2020 Dec 8;41(12):5225-5235. doi: 10.13227/j.hjkx.202004112. Huan Jing Ke Xue. 2020. PMID: 33374038 Chinese.
-
The 2023 Latin America report of the Lancet Countdown on health and climate change: the imperative for health-centred climate-resilient development.Lancet Reg Health Am. 2024 Apr 23;33:100746. doi: 10.1016/j.lana.2024.100746. eCollection 2024 May. Lancet Reg Health Am. 2024. PMID: 38800647 Free PMC article. Review.
-
Air Pollution, Disease Burden, and Health Economic Loss in China.Adv Exp Med Biol. 2017;1017:233-242. doi: 10.1007/978-981-10-5657-4_10. Adv Exp Med Biol. 2017. PMID: 29177965 Review.
Cited by
-
Cardiovascular health and economic outcomes under improved air quality in China: a modelling study.BMJ Glob Health. 2024 Dec 5;9(12):e016974. doi: 10.1136/bmjgh-2024-016974. BMJ Glob Health. 2024. PMID: 39638607 Free PMC article.
-
Spatio-temporal distribution and socioeconomic inequality of low birthweight rate in China from 1992 to 2021 and its predictions to 2030.PLoS One. 2025 Jan 7;20(1):e0310944. doi: 10.1371/journal.pone.0310944. eCollection 2025. PLoS One. 2025. PMID: 39774343 Free PMC article.
References
-
- Guo XR, Cheng SY, Chen DS, Zhou Y, Wang HY. Estimation of economic costs of particulate air pollution from road transport in China. Atmos Environ 2010;44:3369–3377. doi: 10.1016/j.atmosenv.2010.06.018.
-
- Xie Y, Dai H, Dong H, Hanaoka T, Masui T. Economic impacts from PM2.5 pollution-related health effects in China: A provincial-level analysis. Environ Sci Technol 2016;50:4836–4843. doi: 10.1021/acs.est.5b05576. - PubMed
-
- Xie Y, Dai H, Zhang Y, Wu Y, Hanaoka T, Masui T. Comparison of health and economic impacts of PM2.5 and ozone pollution in China. Environ Int 2019;130:104881. doi: 10.1016/j.envint.2019.05.075. - PubMed
-
- Yao M, Wu G, Zhao X, Zhang J. Estimating health burden and economic loss attributable to short-term exposure to multiple air pollutants in China. Environ Res 2020;183:109184. doi: 10.1016/j.envres.2020.109184. - PubMed
MeSH terms
Substances
LinkOut - more resources
Full Text Sources
Medical

