. 2024 Jan 18;14(1):33.
doi: 10.1038/s41398-023-02678-x.

Gatad2b, associated with the neurodevelopmental syndrome GAND, plays a critical role in neurodevelopment and cortical patterning

Affiliations

Gatad2b, associated with the neurodevelopmental syndrome GAND, plays a critical role in neurodevelopment and cortical patterning

Clemer Abad et al. Transl Psychiatry. .

Abstract

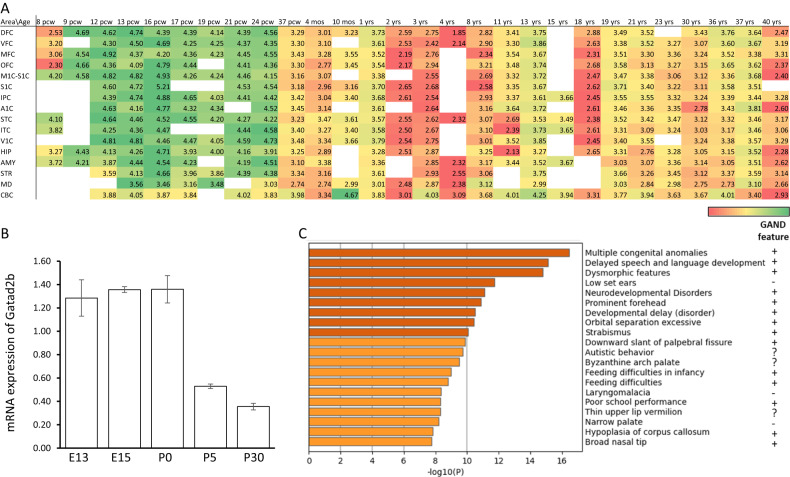
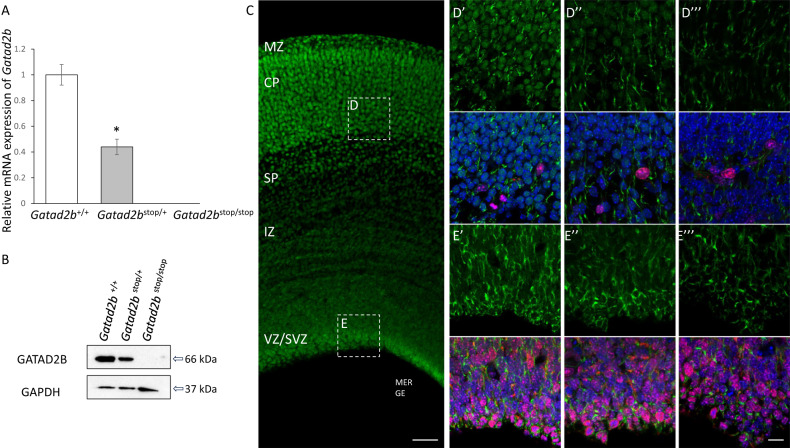
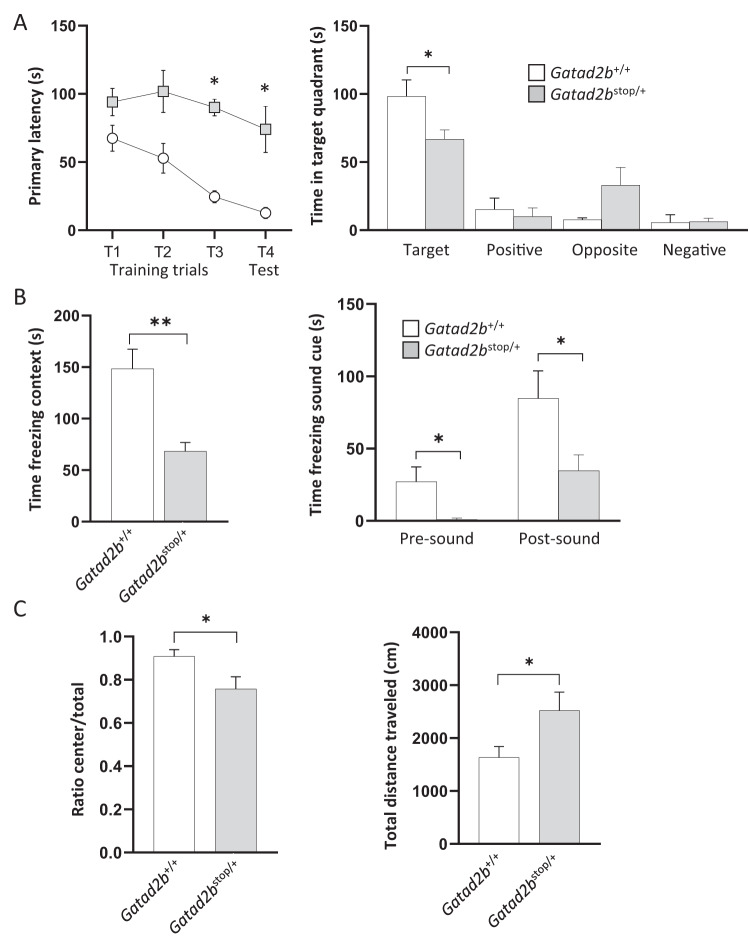
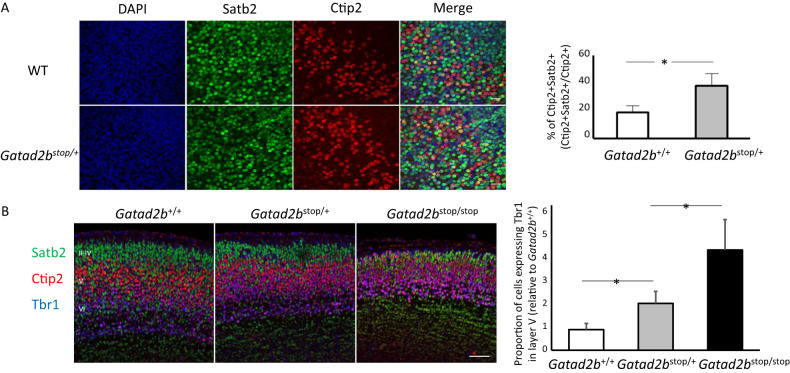
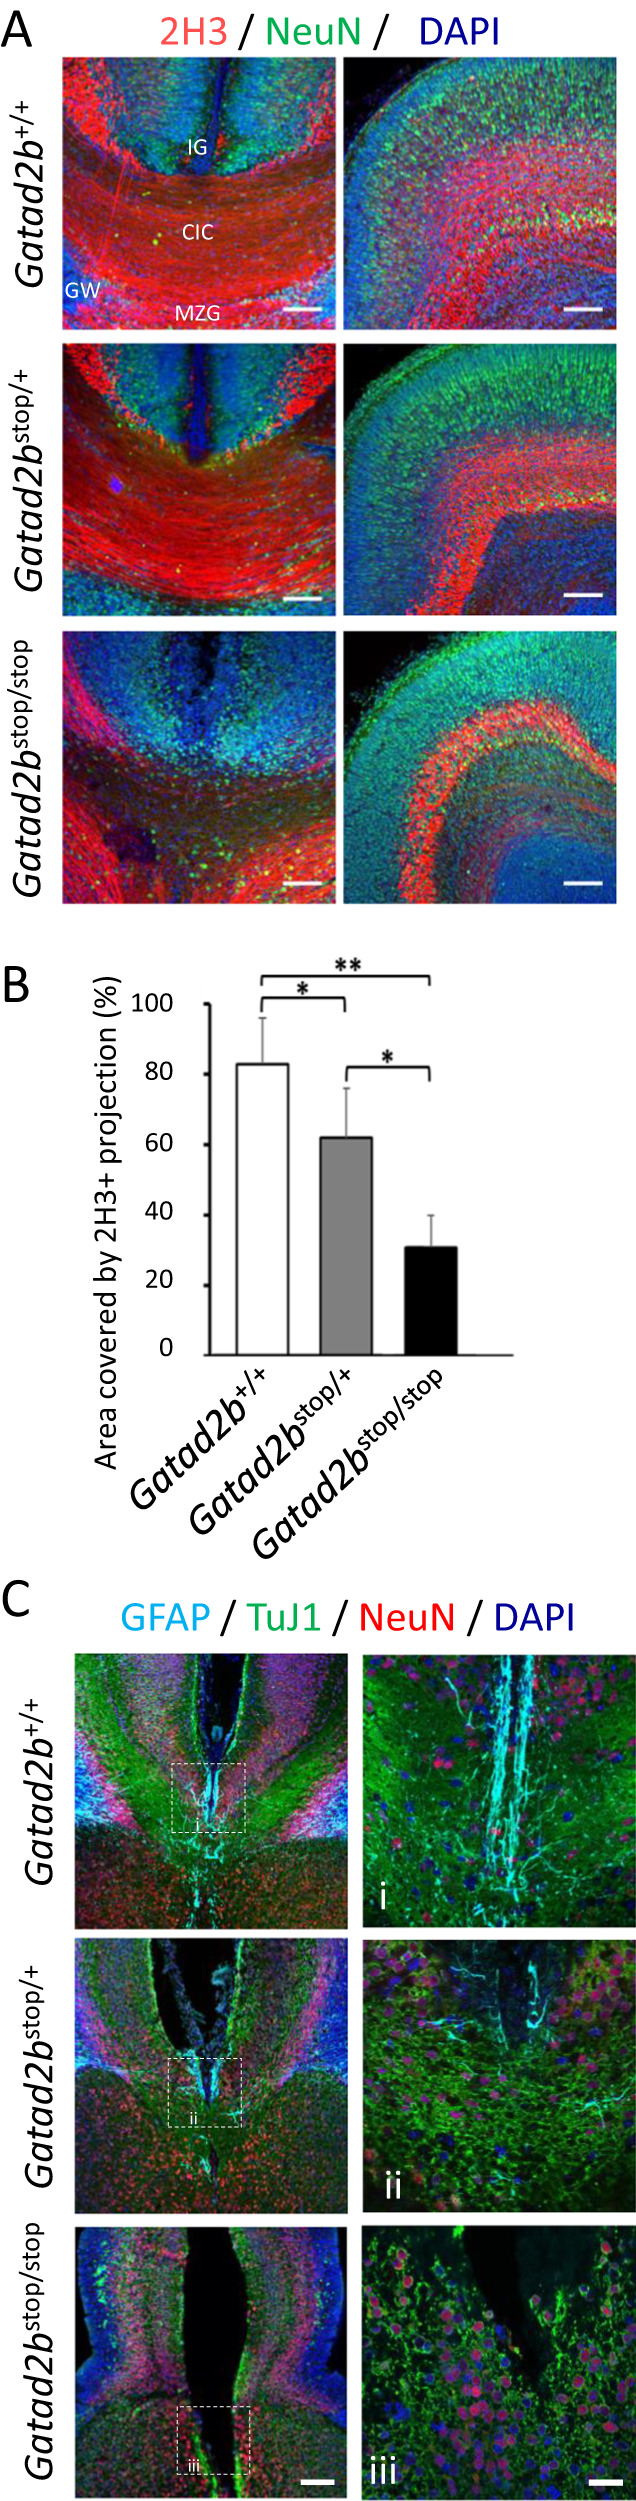
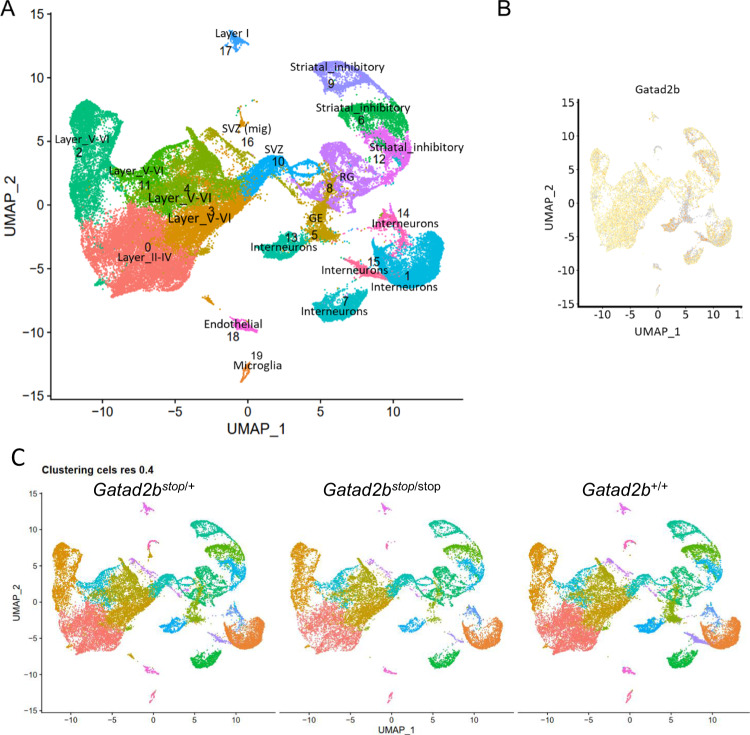
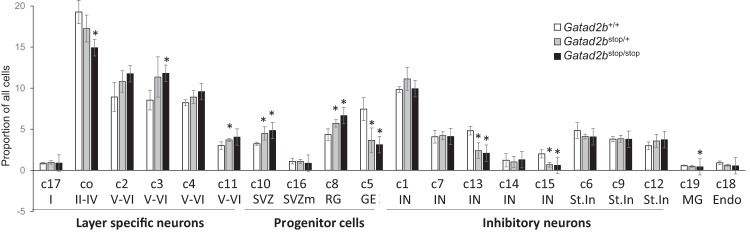
GATAD2B (GATA zinc finger domain containing 2B) variants are associated with the neurodevelopmental syndrome GAND, characterized by intellectual disability (ID), infantile hypotonia, apraxia of speech, epilepsy, macrocephaly and distinct facial features. GATAD2B encodes for a subunit of the Nucleosome Remodeling and Histone Deacetylase (NuRD) complex. NuRD controls transcriptional programs critical for proper neurodevelopment by coupling histone deacetylase with ATP-dependent chromatin remodeling activity. To study mechanisms of pathogenesis for GAND, we characterized a mouse model harboring an inactivating mutation in Gatad2b. Homozygous Gatad2b mutants die perinatally, while haploinsufficient Gatad2b mice exhibit behavioral abnormalities resembling the clinical features of GAND patients. We also observed abnormal cortical patterning, and cellular proportions and cell-specific alterations in the developmental transcriptome in these mice. scRNAseq of embryonic cortex indicated misexpression of genes key for corticogenesis and associated with neurodevelopmental syndromes such as Bcl11b, Nfia and H3f3b and Sox5. These data suggest a crucial role for Gatad2b in brain development.


Conflict of interest statement

The authors declare no competing interests

Figures

Fig. 1
Fig. 1. Developmental expression of GATAD2B and gene enrichment analysis suggest GATAD2B has a critical neurodevelopmental role.
A Expression level of human GATAD2B measured in RPKM (reads per kilobase of exon model per million mapped reads) from postmortem human brain specimens at indicated developmental stages profiled by RNA sequencing (RNA-Seq) and exon microarray hybridization. Data extracted from BrainSpan Atlas of the Developing Human Brain (http://brainspan.org.) (Allen Institute for Brain Science et al. 2023). DFC dorsolateral prefrontal cortex, VFC ventrolateral prefrontal cortex, MFC medial prefrontal cortex, OFC orbital prefrontal cortex, M1C: primary motor cortex, S1C: primary somatosensory cortex, IPC posteroinferior parietal cortex, A1C primary auditory cortex, STC superior temporal cortex, ITC inferior temporal cortex, V1C primary visual (occipital) cortex, HIP: hippocampus, AMY amygdaloid complex, STR Striatum, MD mediodorsal nucleus of thalamus, CBC cerebellar cortex, pcw postconception weeks. White rectangles: no data. B Expression of mouse Gatad2b by qRT-PCR at indicated time points during development. C DisGeNET enrichment analysis. Phenotypic features reported as present in GAND are marked with a plus sign, question marks denote uncertainty.
Fig. 2
Fig. 2. Gatad2bstop/+ mice are haploinsufficient.
A Expression of Gatad2b mRNA as determined by qRT-PCR in brains of 1day old mice (n = 4 of each genotype, *p < 0.05). B Western blot for the detection of Gatad2b in cerebellum samples from WT (Gatad2b+/+), heterozygous (Gatad2bstop/+) and homozygous (Gatad2bstop/stop) mice. C Immunostaining for Gatad2b in 40 μm sections derived from Gatad2b+/+ E16.5 brain. Scale bar: 60 μm. Boxes D and E depict the CP and VZ/SVZ areas shown in D’, E”’, where immunostaining for Gatad2b (green) and Ki67 (red) is shown for Gatad2b+/+ (D’, E’), Gatad2bstop/+ (D”, E”) and Gatad2bstop/stop (D”’, E”’) E 16.5 brain samples. DAPI (blue) was used as DNA marker to identify nuclei and showed merged with Gatad2b (green) and KI67 (red). Scale bar: 15 μm MZ marginal zone, CP cortical plate, SP subplate, IZ intermediate zone, VZ/SVZ ventricular zone and subventricular zone.
Fig. 3
Fig. 3. Gatad2b haploinsufficient mice exhibit behavioral abnormalities.
A Spatial learning and memory was assessed by the Barnes maze task at 3 months of age. The time taken to identify the target hole (primary latency) is shown in the left panel for both the training phase as well as for the probe test day in which the escape box was removed. The distribution of time during the probe test, performed 1 day after the last training session, is shown in the right panel. Two-way repeated measures ANOVA showed main effects of day (F3,20 = 46.43, P < 0.0001) and genotype (F1,20 = 8.3, P = 0.0148), indicating that Gatad2bstop/+ mice performed worse than the wild type at finding the target hole across the acquisition phase. In the probe test, Gatad2bstop/+ exhibited differences in exploratory activity. *p < 0.05, post hoc comparisons using Tukey test. B Learning and memory of contextual fear was assessed by fear conditioning. Left: Contextual test: freezing responses on the contextual testing 24 h after conditioning. There was significantly less freezing in Gatad2bstop/+ mice during contextual testing (**p < 0.01, unpaired Student’s t-test). Right: Cued test: freezing responses on the cued testing. There was significant difference between WT and Gatad2bstop/+ mice in cued conditioning during pre-tone and tone (*p < 0.05, unpaired Student’s t-test). C Activity levels were measured in the open field test. Left: analysis of the ratio of distance traveled in the center of the open field to total distance traveled suggest abnormal anxiety-related responses in Gatad2bstop/+ mice (*<p0.05, unpaired Student’s t-test). Right: total distance traveled showed novel environment-induced hyperactivity in Gatad2bstop/+ mice (*p < 0.05, unpaired Student’s t-test). N = 9 male mice per genotype. Bars represent mean ± S.E.M.
Fig. 4
Fig. 4. Gatad2b deficiency disrupts cortical neuronal development.
A Immunostaining of coronal sections of E16.5 brains (cortex) with antibodies against Satb2 (green), and Ctip2 (red). Scale bar, 60 μm. Quantification data obtained with ImageJ (n = 3 of each genotype) for the proportion of double Satb2+ Ctip2+ neurons is shown to the right of the image B Coronal sections from E18.5 cortices immunolabeled for Satb2 (green), Ctip2 (red) and Tbr1 (blue). Scale bar: 100 μm. The relative proportion of Tbr1+ cells (n = 3 of each genotype) in layer V is depicted on the right. *P < 0.05. Data are presented as the mean ± S.E.M. *p ≤ 0.05.
Fig. 5
Fig. 5. Disorganization of midline structures in Gatad2bstop/+ mice.
A Immunostaining of brain coronal sections just rostral to the fornix and the anterior commissure (which were not overtly affected in the Gatad2bstop/+ brains by bright field microscopy), from P0 mice from the indicated genotypes for 2H3 (red, stains the pioneer axons of the cingulate cortex (CIC)) and NeuN (green). DAPI (blue) was used to identify nuclei. Most Gatad2bstop/stop axons fail to reach the contralateral hemisphere, while significantly less Gatad2bstop/+ axons cross the midline. Scale bar: 100 µm. B Area covered by 2H3 projections, quantified for each genotype (n = 3 Gatad2b+/+, n = 2 Gatad2bstop/+, n = 2 Gatad2bstop/stop, all from the same litter). *P < 0.05 (Student’s t-test). Data are presented as the mean ± S.E.M. C Immunostaining for glial cells with antibodies for GFAP (teal) in E18 embryos shows less glial cells and disorganization of the indisium griseum (IG), glial wedge (GW) and midline zipper glia (MZG). Labeling of neuronal cytoskeleton with TuJ1 (green) and NeuN (red) confirms the reduction of midline crossing axons. i-iii are enhanced magnifications of the indicated areas. Scale bars: 90 µm (left panels) and 30 µm (right panels). Images are from single embryos of either sex (siblings) but representative of an additional set of single embryos of each genotype derived from another breeding pair.
Fig. 6
Fig. 6. Cell clusters and cell identities of Gatad2b mutant mice.
A Uniform manifold approximation and projection (UMAP) plot of single cells from 3 Gatad2b+/+, 4 Gatad2bstop/+ and 3 Gatad2bstop/stop embryos, with each cell colored according to cluster. B UMAP of the integrated scRNA-seq data colored for the visualization of Gatad2b expression. C UMAP visualization of scRNA-seq data from individual genotypes.
Fig. 7
Fig. 7. Alterations of cell type proportions in cortex of Gatad2b mutant mice.
Plot of proportion of cells assigned to each cell type in Gatad2b+/+ (WT), Gatad2bstop/stop (het) and Gatad2bstop/stop (ko) E16.5 developing cortex. cortical layers II-IV (Layet II-IV), interneurons (IN), cortical layers II-IV (Layer V-VI), ganglionic eminence (GE), striatal inhibitory (Str. Inh), radial glia (RG), subventricular zone (SVZ), migratory SVZ (SVZ mig), cortical layer I (Layer I), endothelial (endo) and microglia (micro) are presented as across all genotypes (% of total), and per genotype (Gatad2b+/+: WT (avg%), Gatad2bstop/+: Het (avg%), Gatad2bstop/stop: KO (avg%)). Bolded values (last two columns) highlight significant p values (p < 0.05) in both comparisons, Gatad2b+/+ vs. Gatad2bstop/+: p value (Het vs. WT), and Gatad2b+/+ vs. Gatad2bstop/stop: p value (KO vs. WT).

Similar articles

  • GATAD2B-associated neurodevelopmental disorder (GAND): clinical and molecular insights into a NuRD-related disorder.
    Shieh C, Jones N, Vanle B, Au M, Huang AY, Silva APG, Lee H, Douine ED, Otero MG, Choi A, Grand K, Taff IP, Delgado MR, Hajianpour MJ, Seeley A, Rohena L, Vernon H, Gripp KW, Vergano SA, Mahida S, Naidu S, Sousa AB, Wain KE, Challman TD, Beek G, Basel D, Ranells J, Smith R, Yusupov R, Freckmann ML, Ohden L, Davis-Keppen L, Chitayat D, Dowling JJ, Finkel R, Dauber A, Spillmann R, Pena LDM; Undiagnosed Diseases Network; Metcalfe K, Splitt M, Lachlan K, McKee SA, Hurst J, Fitzpatrick DR, Morton JEV, Cox H, Venkateswaran S, Young JI, Marsh ED, Nelson SF, Martinez JA, Graham JM Jr, Kini U, Mackay JP, Pierson TM. Shieh C, et al. Genet Med. 2020 May;22(5):878-888. doi: 10.1038/s41436-019-0747-z. Epub 2020 Jan 17. Genet Med. 2020. PMID: 31949314 Free PMC article.
  • Intellectual disability due to monoallelic variant in GATAD2B and mosaicism in unaffected parent.
    Rabin R, Millan F, Cabrera-Luque J, Pappas J. Rabin R, et al. Am J Med Genet A. 2018 Dec;176(12):2907-2910. doi: 10.1002/ajmg.a.40667. Epub 2018 Oct 22. Am J Med Genet A. 2018. PMID: 30346093
  • Clinical and molecular description of 19 patients with GATAD2B-Associated Neurodevelopmental Disorder (GAND).
    Vera G, Sorlin A, Delplancq G, Lecoquierre F, Brasseur-Daudruy M, Petit F, Smol T, Ziegler A, Bonneau D, Colin E, Mercier S, Cogné B, Bézieau S, Edery P, Lesca G, Chatron N, Sabatier I, Duban-Bedu B, Colson C, Piton A, Durand B, Capri Y, Perrin L, Wiesener A, Zweier C, Maroofian R, Carroll CJ, Galehdari H, Mazaheri N, Callewaert B, Giulianno F, Zaafrane-Khachnaoui K, Buchert-Lo R, Haack T, Magg J, Rieß A, Blandfort M, Waldmüller S, Horber V, Leonardi E, Polli R, Turolla L, Murgia A, Frebourg T, Lebre AS, Nicolas G, Saugier-Veber P, Guerrot AM. Vera G, et al. Eur J Med Genet. 2020 Oct;63(10):104004. doi: 10.1016/j.ejmg.2020.104004. Epub 2020 Jul 17. Eur J Med Genet. 2020. PMID: 32688057
  • The NuRD complex and macrocephaly associated neurodevelopmental disorders.
    Pierson TM, Otero MG, Grand K, Choi A, Graham JM Jr, Young JI, Mackay JP. Pierson TM, et al. Am J Med Genet C Semin Med Genet. 2019 Dec;181(4):548-556. doi: 10.1002/ajmg.c.31752. Epub 2019 Nov 18. Am J Med Genet C Semin Med Genet. 2019. PMID: 31737996 Review.
  • GATAD2B-related intellectual disability due to parental mosaicism and review of literature.
    Kaur P, Mishra S, Rajesh SM, Girisha KM, Shukla A. Kaur P, et al. Clin Dysmorphol. 2019 Oct;28(4):190-194. doi: 10.1097/MCD.0000000000000288. Clin Dysmorphol. 2019. PMID: 31205050 Review.

Cited by

References

    1. Allen Institute for Brain Science, Sestan N, Gerstein MB, Knowles JA, Levitt P, Fischl B, et al. BrainSpan Atlas of the Developing Human Brain. 2023; Available from: http://brainspan.org.
    1. Kochinke K, Zweier C, Nijhof B, Fenckova M, Cizek P, Honti F, et al. Systematic Phenomics Analysis Deconvolutes Genes Mutated in Intellectual Disability into Biologically Coherent Modules. Am J Hum Genet. 2016;98:149–64. doi: 10.1016/j.ajhg.2015.11.024. - DOI - PMC - PubMed
    1. Fahrner JA, Bjornsson HT. Mendelian disorders of the epigenetic machinery: tipping the balance of chromatin states. Annu Rev Genomics Hum Genet. 2014;15:269–93. doi: 10.1146/annurev-genom-090613-094245. - DOI - PMC - PubMed
    1. Kleefstra T, Schenck A, Kramer JM, van Bokhoven H. The genetics of cognitive epigenetics. Neuropharmacology. 2014;80:83–94. doi: 10.1016/j.neuropharm.2013.12.025. - DOI - PubMed
    1. Shieh C, Jones N, Vanle B, Au M, Huang AY, Silva APG, et al. Correction: GATAD2B-associated neurodevelopmental disorder (GAND): clinical and molecular insights into a NuRD-related disorder. Genet Med. 2020;22:822–2. doi: 10.1038/s41436-020-0760-2. - DOI - PMC - PubMed