. 2024 Jan 18;15(1):323.
doi: 10.1038/s41467-023-44158-2.

Clinical application of tumour-in-normal contamination assessment from whole genome sequencing

Affiliations

Clinical application of tumour-in-normal contamination assessment from whole genome sequencing

Jonathan Mitchell et al. Nat Commun. .

Abstract

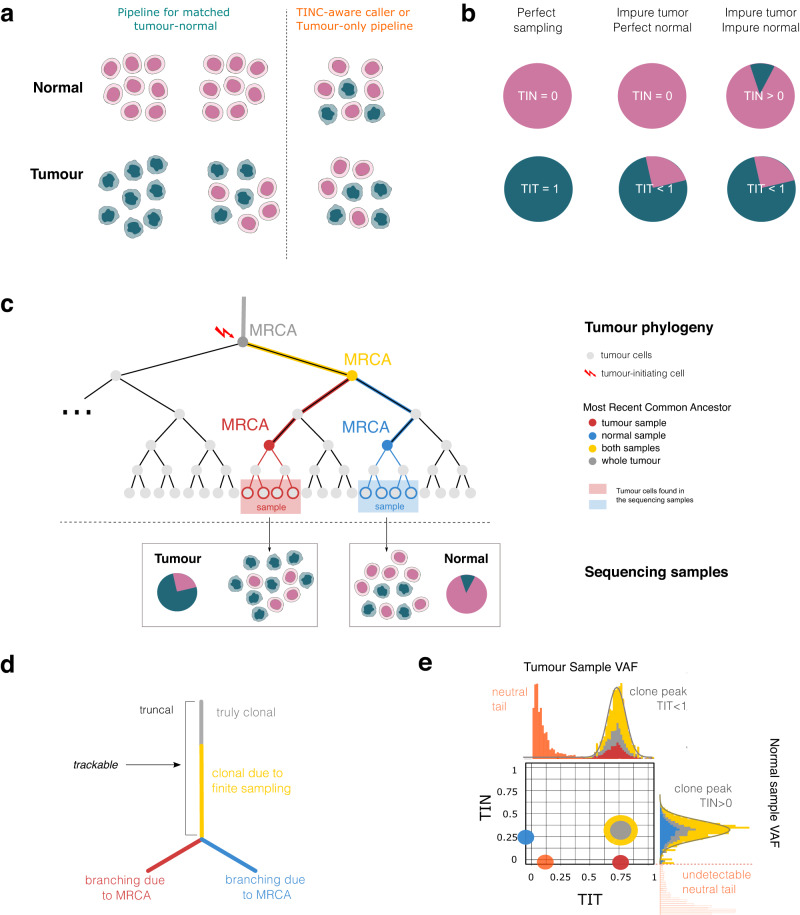
The unexpected contamination of normal samples with tumour cells reduces variant detection sensitivity, compromising downstream analyses in canonical tumour-normal analyses. Leveraging whole-genome sequencing data available at Genomics England, we develop a tool for normal sample contamination assessment, which we validate in silico and against minimal residual disease testing. From a systematic review of [Formula: see text] patients with haematological malignancies and sarcomas, we find contamination across a range of cancer clinical indications and DNA sources, with highest prevalence in saliva samples from acute myeloid leukaemia patients, and sorted CD3+ T-cells from myeloproliferative neoplasms. Further exploration reveals 108 hotspot mutations in genes associated with haematological cancers at risk of being subtracted by standard variant calling pipelines. Our work highlights the importance of contamination assessment for accurate somatic variants detection in research and clinical settings, especially with large-scale sequencing projects being utilised to deliver accurate data from which to make clinical decisions for patient care.


Conflict of interest statement

The authors declare no competing interests.

Figures

Fig. 1
Fig. 1. TINC method.
a Cellular composition of a bulk tumour and normal sample (e.g. peripheral blood, saliva, or skin biopsy). Ideally, there would be no cross-contamination between tumour and normal samples (pink and teal cells show perfect separation). In reality, all tumour samples contain normal cells. For a paired analysis, challenges in somatic variant detection arise when the normal sample is contaminated with tumour cells, resulting in subtraction of true somatic variants and a decrease in variant detection sensitivity. b The level of contamination of a bulk sample can be defined as the fraction of tumour cells in the sample. With perfect sampling tumour purity (TIT score) equals 1, and tumour-in-normal contamination (TIN score) equals 0; for most real-life samples, TIT < 1. TIN > 0 in normal sample with tumour contamination. c Tumour cell phylogeny showing cell divisions as a tree representing the evolutionary relationship between sampled tumour cells. Colours represent distinct Most Recent Common Ancestors (MRCAs) of the tumour cells, according to sampling. With TIN contamination, phylogenetically related tumour cells are found in both samples (yellow and grey trunk). Tumour cells found in the tumour and the normal carry common as well as private mutations (red for the tumour and blue for the normal). TIN and TIT are determined using the mutations accrued up to the yellow MRCA, an ancestral cell common to the tumour cells present in both samples. d Summary phylogenetic tree for the cell divisions in (c) shows a branching effect that describes a lineage division and spatial sampling bias. e Expected cell fraction distribution for tumour cells in tumour and normal samples carrying ancestral (yellow and grey) and private (blue and red) mutations for a case with TIT = 75% and TIN = 25%. Somatic mutations common to tumour cells found in both samples including the key tumour truncal driver mutations, which are frequently subtracted in tumour-normal analysis, are the yellow and grey cluster. Mutations only found in the tumour cells within the normal sample (shown in blue) have no read support in the tumour and are not considered by standard somatic variant callers.
Fig. 2
Fig. 2. In silico validation of TINC performance.
a Generation of test data by in silico contamination of patient WGS datasets. A range of TIN levels were generated from tumour and normal BAM files, injecting tumour reads in the normal BAM to achieve a desired level of TIN contamination. Somatic variant calling of small variants and CNAs was performed by pairing the original tumour BAM with the in silico contaminated normal, and the resulting calls used for TINC analysis. b Performance of TINC with the in silico contaminated haematological cancer samples. The scatter plot compares the expected TIN contamination (based on in silico contamination) to TINC estimates. Both axes report the score in read fractions for the tumour (RF). Each point is coloured by the percentage of clonal mutations used by TINC, relative to the original uncontaminated sample. The fraction of clonal mutations decreases with increasing contamination, due to the limitations of variant callers that fail to report genuine somatic variants (false negatives). With few clonal mutations, identifying clonal peaks is more difficult; in this case clonal variants are also biased towards those with lower support in the normal sample. Line fits were performed by linear regression (tests with Pearson method with two-sided p-value and squared correlation coefficient). c Performance of TINC with lung cancer samples contaminated in silico. The same information available in (b) is provided. These tumours have a higher fraction of CNAs compared with haematological cancers that are represented by triangles and squares. Fits and tests are as in (b). d, e Performance of DeTiN and TINC on the haematological and lung cancer samples shown in (b) and (c). Consistent with the definition of DeTin, the relative tumour DNA abundance in the normal and tumour samples is shown on the x-axis. This plot is restricted to cases with a maximum ratio of 20%, which includes samples within the anticipated contamination range for use in clinical reporting (full plot, Supplementary Fig. S1). The y-axis shows the ratio between TIN and TIT scores returned by the two tools. Fits and tests are as in (b). Source data are provided as a Source Data file.
Fig. 3
Fig. 3. Validation of TINC by comparison with orthogonal test data generated either by flow cytometry or molecular Minimal Residual Disease (MRD) test.
Here 63 patients are recruited through the 100,000 Genomes Project (10 AMLs and 53 ALLs), while 7 ALLs are not (criteria for project enrolment reported in Supplementary Table 1). The threshold for TIN contamination (>1% TIN) is shown with the dashed vertical line. Source data are provided as a Source Data file.
Fig. 4
Fig. 4. TINC test implementation in Genomics England pipeline.
a Somatic SNVs are used in TIN assessment; by default all variants are used. If run with CNA integration, only SNVs mapping to the most prevalent copy state are used. The supported copy states are 1:0 (loss of heterozygosity, LOH), 1:1 (heterozygous diploid), 2:0 (copy-neutral LOH), 2:1 (triploid) or 2:2 (tetraploid genome-doubled) TIN contamination is estimated for samples with tumour purity (TIT score) >25%. Samples that can be analysed are assigned a TIN score, which can be converted into tumour read fractions (RF) detected in the normal sample, and used to determine a final status for the presence or absence of contamination. The threshold implemented at Genomics England to determine PASS status (TIN contamination undetected) versus FAIL (TIN contamination detected), is set to 1% RF. b Scatter plot reporting the ratio between the number of clonal mutations over total mutational burden, against estimated sample purity (TIT) for 617 WGS samples of haematological cancers. When clonal/total mutations ratio = 1, TINC did not separate clonal somatic variants from subclonal variants and TIN estimates are less reliable. The majority of samples with ratio = 1 are clustered with TIT score < 25%. The colour of each point represents the sample contamination as estimated by our method; the vertical dashed line represents the 25% purity cutoff for TINC analysis adopted in Genomics England. Further details on this cohort and contamination assessment are shown in Fig. 6. Source data are provided as a Source Data file.
Fig. 5
Fig. 5. Hybrid variant calling pipeline for processing of samples with TIN contamination.
a Graphical representation of the pipeline that combines outputs of paired tumour-normal run with high specificity and reduced sensitivity due to TIN contamination and tumour only run (unmatched normal sample is used to satisfy input requirements) with high sensitivity and low specificity due to unsubtracted rare germline variants. b, c Extensive filtering is therefore implemented to reduce the number of variants in clinically relevant genes reported from tumour only workflow. Panel of Normals (PoN) is applied to SNVs to reduce the number of false positive findings due to sequencing artefacts. Population Frequency (PF) filter is applied to reduce the number of common germline variants in tumour only run. Filtering cut-offs are optimised for improving specificity without compromising sensitivity. Application of these two filters significantly reduces the number of SNVs (b) and SVs (c) that require clinical review. d, e Sensitivity of SNV calling for samples from Fig. 2b with standard paired tumour-normal analysis (d) and with tumour-only pipeline (e). Source data are provided as a Source Data file.
Fig. 6
Fig. 6. Application of TINC to the 100,000 Genomes Project dataset.
a Distribution of the estimated level of tumour in normal contamination for 771 tumour-normal pairs derived from participants in the 100,000 Genomes Project (n = 617 haematological cancers, n = 154 sarcomas). Data are shown for haematological cancers of the subtypes: Acute Lymphoblastic Leukaemia (ALL), Acute Myeloid Leukaemia (AML), Chronic Lymphocytic Leukaemia (CLL), Chronic Myeloid Leukaemia (CML), Diffuse Large B-cell Lymphoma (DLCBL), High-risk Myelodysplastic Syndrome (High-risk MDS), Low and moderate grade Non-Hodgkin B-cell Lymphoma (Low/mid grade NHL), Multiple Myeloma (MM) and Myeloproliferative Neoplasm (MPN). Azure bars represent normal samples with TIN score >1% expressed in read fractions, light grey bars l samples with score <1%. b Distribution of normal sample source for haematological cancers. The fraction of normal samples for which the DNA was derived from blood, saliva, fibroblasts or tissue samples is shown for haematological cancers of different subtypes (AML, MPN, High-risk MDS and CML). c The proportion of normal samples determined to have a PASS or FAIL status by TINC (1% read fraction threshold) is shown in light grey and azure respectively for AML, MPN, High-risk MDS and CML cancers. The proportion of cases that could not be analysed by Genomics England pipeline (tumour purity estimated to be below 25%) is shown in dark grey. Source data are provided as a Source Data file.
Fig. 7
Fig. 7. Examples of TINC test outputs.
a Scatter distribution of somatic mutation VAF in tumour and normal samples (af represent case 1). VAF is shown for n=982 mutations detected from WGS data which reside within heterozygous diploid regions in the tumour genome. Two variants of clinical significance are highlighted; a TP53 frameshift deletion (c.594delA) and a JAK2 V617F mutation. Neither mutation would be detected using a standard tumour-normal calling pipeline, due to the tumour contamination in the normal. b, c Histograms of VAF values for tumour and normal samples in (a). d Deconvolution analysis with TINC. n = 378 clonal mutations were identified in the tumour using MOBSTER (upper panel) with mean VAF ~45% (cluster C1). Subsequent deconvolution determines one cluster in the normal sample for the corresponding mutations with a VAF peak at about ~8% (lower panel). e Representation of somatic mutation VAF in tumour and normal samples. After deconvolution of somatic mutations (d), clonality can be attributed to the mutations in (a)—clonal mutations with teal dots. f TIT and TIN scores can be determined from the parameters fit by the deconvolution methods, accounting for the copy state of somatic SNVs. In this case, the data indicate an overall tumour purity of 90% (TIT score, high-purity tumour sample) and tumour-in-normal contamination level of ~16% (TIN score). g Representation of somatic mutation VAF in tumour and normal samples (gi represent case 2) as in (ac). For this case, a previously identified (by Fluorescence in situ hybridisation) translocation resulting in a PML-RARA fusion was not detected using a standard tumour-normal analysis pipeline. h Deconvolution identifies a cluster of clonal somatic mutations of n = 358 SNVs (cluster C1) with VAF ~30%. i Representation of contamination in tumour and normal samples. TIT and TIN scores determined by TINC, expressed in cellular proportions and adjusted for copy number states, show a tumour purity of ~60% (TIT), and tumour contamination of the normal sample of ~16% (TIN).

References

    1. Mwenifumbo JC, Marra MA. Cancer genome-sequencing study design. Nat. Rev. Genet. 2013;14:321–332. doi: 10.1038/nrg3445. - DOI - PubMed
    1. Gagan J, Van Allen EM. Next-generation sequencing to guide cancer therapy. Genome Med. 2015;7:80. doi: 10.1186/s13073-015-0203-x. - DOI - PMC - PubMed
    1. Barnell EK, et al. Standard operating procedure for somatic variant refinement of sequencing data with paired tumor and normal samples. Genet. Med. 2019;21:972–981. doi: 10.1038/s41436-018-0278-z. - DOI - PMC - PubMed
    1. Kim S, et al. Strelka2: fast and accurate calling of germline and somatic variants. Nat. Methods. 2018;15:591–594. doi: 10.1038/s41592-018-0051-x. - DOI - PubMed
    1. ICGC/TCGA PCAWG Consortium. Pan-cancer analysis of whole genomes. Nature. 2020;578:82–93. doi: 10.1038/s41586-020-1969-6. - DOI - PMC - PubMed

Publication types