. 2024 Jan 18;15(1):567.
doi: 10.1038/s41467-023-44524-0.

Longitudinal single cell atlas identifies complex temporal relationship between type I interferon response and COVID-19 severity

Affiliations

Longitudinal single cell atlas identifies complex temporal relationship between type I interferon response and COVID-19 severity

Quy Xiao Xuan Lin et al. Nat Commun. .

Abstract

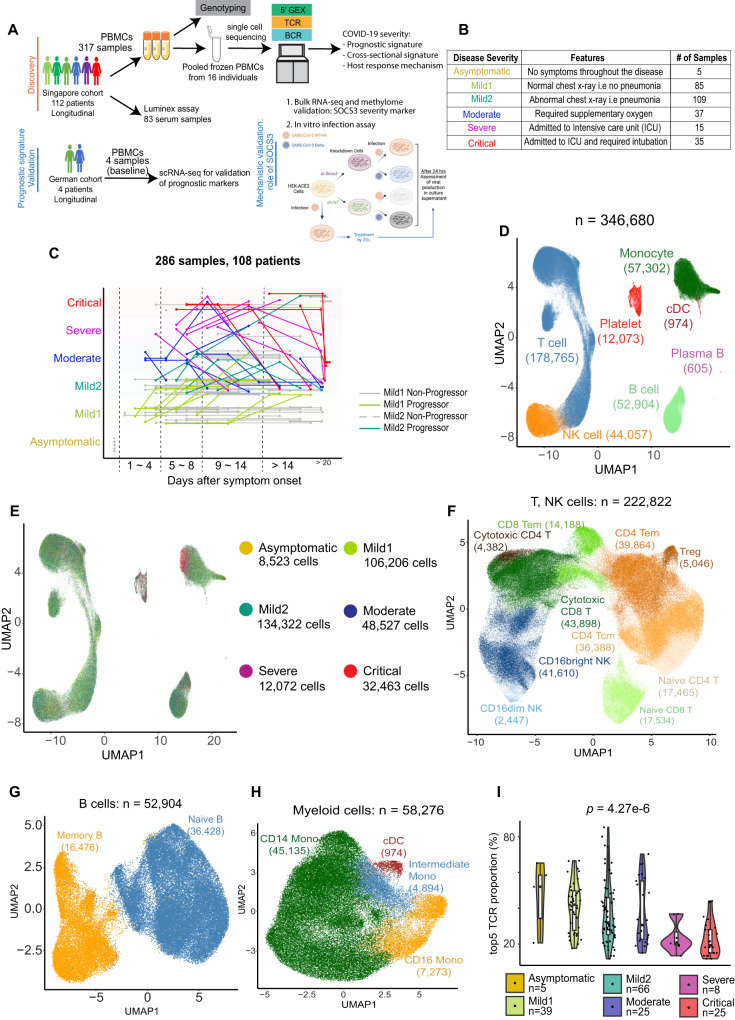
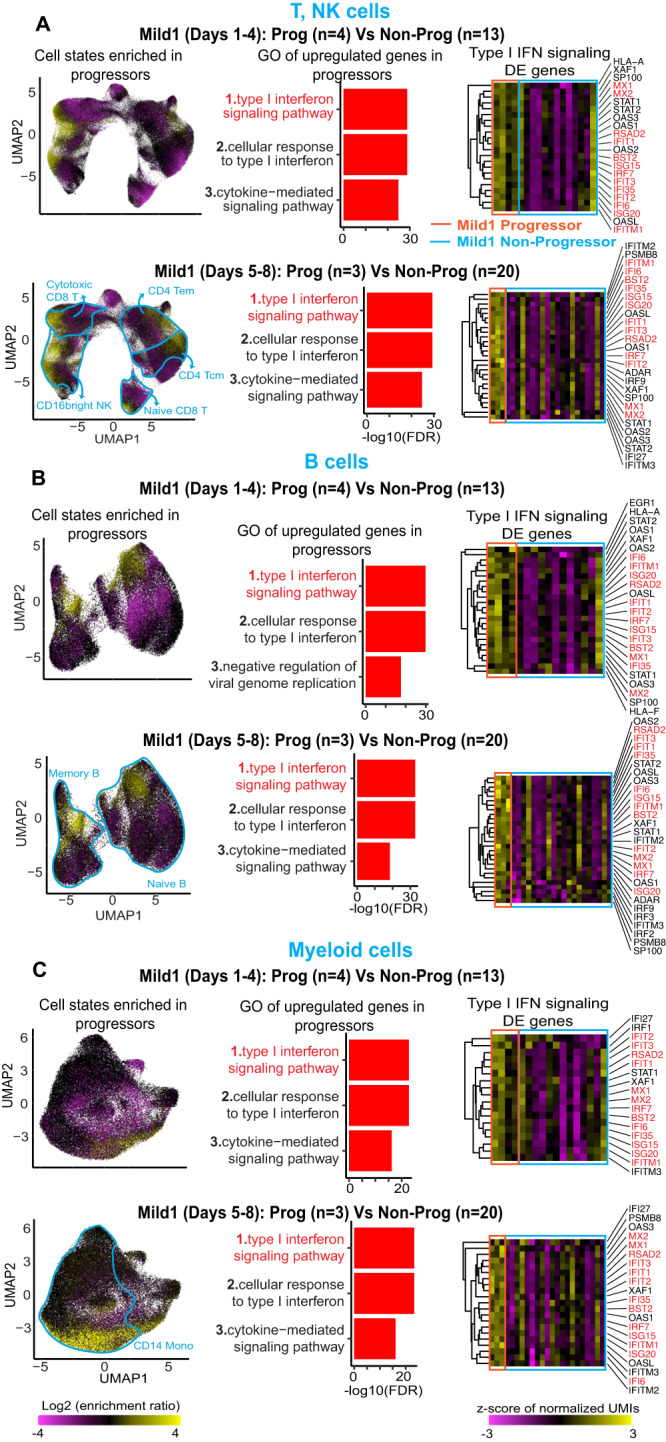
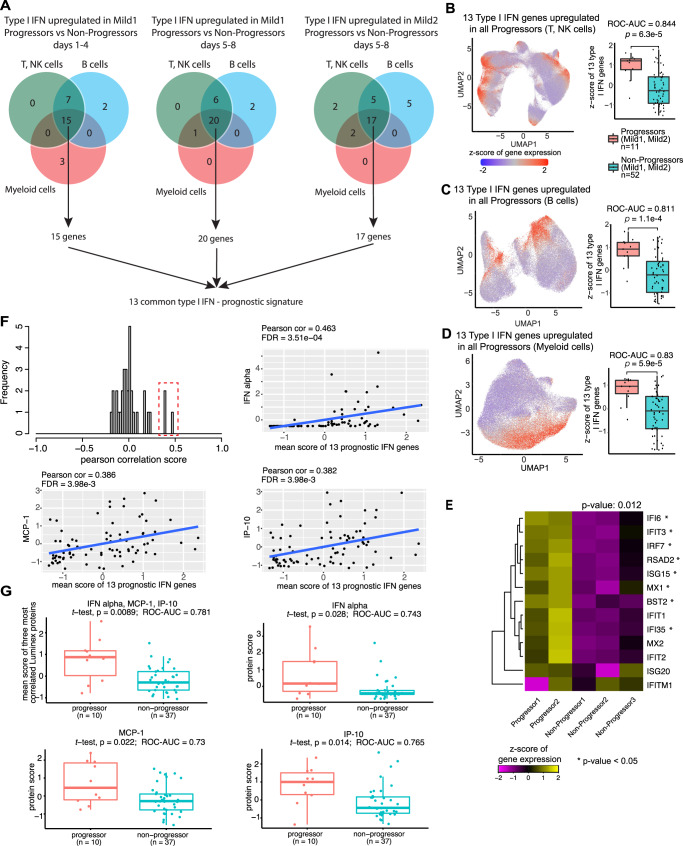
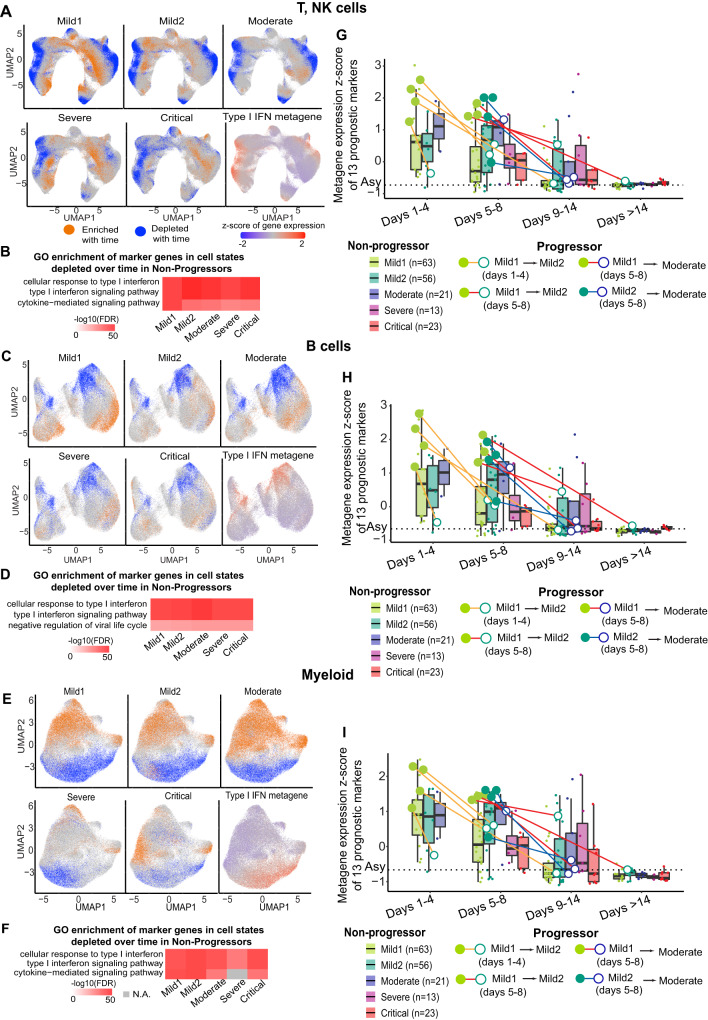
Due to the paucity of longitudinal molecular studies of COVID-19, particularly those covering the early stages of infection (Days 1-8 symptom onset), our understanding of host response over the disease course is limited. We perform longitudinal single cell RNA-seq on 286 blood samples from 108 age- and sex-matched COVID-19 patients, including 73 with early samples. We examine discrete cell subtypes and continuous cell states longitudinally, and we identify upregulation of type I IFN-stimulated genes (ISGs) as the predominant early signature of subsequent worsening of symptoms, which we validate in an independent cohort and corroborate by plasma markers. However, ISG expression is dynamic in progressors, spiking early and then rapidly receding to the level of severity-matched non-progressors. In contrast, cross-sectional analysis shows that ISG expression is deficient and IFN suppressors such as SOCS3 are upregulated in severe and critical COVID-19. We validate the latter in four independent cohorts, and SOCS3 inhibition reduces SARS-CoV-2 replication in vitro. In summary, we identify complexity in type I IFN response to COVID-19, as well as a potential avenue for host-directed therapy.


Conflict of interest statement

The authors declare no competing interests.

Figures

Fig. 1
Fig. 1. Longitudinal single-cell workflow and landscape of PBMC gene expression.
A. Schematic representation of the data generation workflow in the study. B. Disease severity definitions for categorizing each sample by clinical parameters at the time of sample collection. A number of samples under each disease severity is indicated. C. Longitudinal disease course for 108 patients (after QC). Dots represent the collection day and disease severity of each of the 286 samples (after QC). Gray lines: the trajectory of individuals with stable disease. Colored lines: individuals with variable severity, colored by the severity of the at-presentation sample. D. Uniform manifold approximation and projection (UMAP) reduced-dimensionality representation of 346,680 high-quality post-QC single cells in gene expression space, annotated with major cluster labels using supervised clustering by the Reference Component Analysis 2 (RCA2) algorithm. E. Same as D, colored by disease severity of each sample. F-H. UMAP plots of T, NK cells (F), B cells (G), and myeloid cells (H), with cells colored by subtype based on unsupervised clustering of single-cell transcriptomes. I. T-cell clonality index (fraction of T cells derived from the 5 most abundant TCR clones; beyond Day 8), estimated using the single-cell immune profiling assay. p-value: Kruskal–Wallis test. Source data are provided as a Source Data file. Box-and-whisker plots show the median (center line), 25th, and 75th percentile (lower and upper boundary), with 1.5x inter-quartile range indicated by whiskers and outliers shown as individual data points.
Fig. 2
Fig. 2. Comparison of Progressors and Non-Progressors to identify a COVID-19 prognostic signature.
UMAP representations show the cell-state enrichment fold-change between Mild1 progressors and non-progressors in T, NK cells (A), B cells (B), and myeloid cells (C). Yellow: cell states (gene expression neighborhoods) enriched in Progressors. Magenta: cell states depleted in Progressors. Red bar plots: enriched Gene Ontology (GO) terms associated with the union across all cell subtypes of genes upregulated in Progressors. Heatmaps on the right: pseudobulk expression levels of type I IFN genes upregulated in Progressors. Source data are provided as a Source Data file.
Fig. 3
Fig. 3. Identification of 13 type I IFN signaling gene prognostic signatures.
A. Venn diagrams show the overlapping of type I IFN signaling genes upregulated in Progressors compared to Non-Progressors across three cell types. In the end, 13 type I IFN signaling genes were identified as prognostic marker genes. B–D Metagene z-score (normalized relative to all samples from Days 1–4) of 13 type I IFN signaling genes in T, NK cells, B cells, and myeloid cells. Left panels: scRNA-seq UMAP plot colored by metagene z-score. Right panels: box-plots of the pseudobulk (averaged across cells in one sample) metagene z-score in Progressors (n = 11) vs. Non-Progressors (n = 52). p-value: Student’s t-test (one-sided). Receiver operating characteristic—area under curve (ROC-AUC) values show the accuracy of the 13-gene prognostic signature for predicting progression to more severe disease. E Heatmap shows the scaled pseudobulk expression levels (expression z-score) of the 13 prognostic ISGs in baseline samples from 2 Mild Progressors and 3 Mild non-Progressors in the German cohort *: p-value ≤ 0.05, Student’s t-test (one-sided) for differential expression between Progressors and non-Progressors. p-value is shown above heatmap: the difference between Progressors and non-Progressors in the trimmed mean of the 13 genes (greater). F Histogram: expression correlation of 41 plasma proteins with the prognostic 13-gene ISG signature across 83 samples. The red box indicates the three highly correlated proteins: IFN-alpha, MCP-1, and IP-10. Scatterplots illustrate the correlation between the three proteins and the prognostic 13-gene signature. Each dot represents a single sample. Blue lines: linear regression. FDR: Q-values: Benjamini Hochberg correction on linear regression p-values. G The first box plot shows the average of the protein expression scores of IFN-alpha, MCP-1, and IP-10 in baseline samples from 10 Mild Progressors (red) and 37 Mild non-Progressors (blue). The rest three box-plots: are individual plasma markers. p-values: Student’s t-test (one-sided). Box-and-whisker plots show the median (center line), 25th, and 75th percentile (lower and upper boundary), with 1.5x inter-quartile range indicated by whiskers and outliers shown as individual data points. Source data are provided as a Source Data file.
Fig. 4
Fig. 4. Longitudinal analysis of COVID-19 single-cell transcriptomes.
A UMAP representation of cell states (locations of cells in gene expression space) enriched or depleted over time in T, NK cells. A cell is colored orange if the proportion of Non-Progressor Mild1 cells (for example, top-left UMAP) in its immediate vicinity (300 nearest neighbors) increases over time, and blue if the proportion decreases. For comparison, the average scaled expression of all expressed genes related to type I IFN signaling is shown (type I IFN metagene). B Top 3 enriched GO terms of marker genes of cell states depleted over time in Non-Progressors (blue cells). C, D B cells, same as (A, B). E, F Myeloid cells, same as (A, B). GI Prognostic type I IFN metagene z-score (normalized across all samples) of Mild Progressor (circles) and Non-Progressor (box-plots) samples, grouped by disease severity and duration. Horizontal dashed line: average type I IFN metagene z-score of the 5 asymptomatic (Asy) samples. In each PBMC sample, metagene z-scores were averaged across all T, NK cells (G), B cells (H), and myeloid cells (I). Filled circles: baseline samples of Progressors. Empty circles: second samples of Progressors. Box-and-whisker plots show the median (center line), 25th, and 75th percentile (lower and upper boundary), with a 1.5x inter-quartile range indicated by whiskers and outliers shown as individual data points. Source data are provided as a Source Data file.
Fig. 5
Fig. 5. Cross-sectional analysis: the relationship between immune cell type proportions and COVID-19 disease severity.
A Box-plots indicate major cell type proportions (%) in PMBC as a function of disease severity. Each dot represents a single sample. To minimize the confounding effect of disease duration, only samples from Day 9 disease onset onwards are used in this analysis. p-values: Kruskal–Wallis test (non-parametric one-way ANOVA for each cell type). B Similar to A, indicating subtype proportions as a fraction of all T and NK cells. C Similar to A, indicating subtype proportions as a fraction of all myeloid PBMC (monocytes and cDCs). Box-and-whisker plots show the median (center line), 25th, and 75th percentile (lower and upper boundary), with 1.5x inter-quartile range indicated by whiskers and outliers shown as individual data points. Source data are provided as a Source Data file.
Fig. 6
Fig. 6. Cross-sectional cell state analysis to identify immune aberrations in severe COVID-19.
A UMAP representation of cell states (locations of cells in gene expression space) enriched or depleted with increasing COVID-19 severity. A cell is colored orange if the proportion of cells in its immediate vicinity (300 nearest neighbors) increases with increasing severity, and blue if the proportion decreases. Black outlines demarcate specific cell subtypes (clusters). B Left: Volcano plot of marker genes of CD4+ Tcm cell states enriched with increasing severity (orange Tcm cells vs all other Tcm cells). Middle: the top 3 corresponding enriched GO terms. Right: UMAP plot, each cell is colored by the average of the standardized gene expression values of the marker genes belonging to the most enriched GO term. C Same as B, for Cytotoxic CD8+ T-cell states that are depleted with increasing disease severity. D Same as A, for B cells. E Same as B, for memory B-cell states enriched with increasing severity. F Same as B, for naive B-cell states, depleted with severity. G Same as A, for myeloid cells. H Same as B, for CD14+ monocyte cell states enriched with increasing severity. I Same as B, for CD14+ monocyte cell states depleted with severity. Source data are provided as a Source Data file.
Fig. 7
Fig. 7. SOCS3 expression associates with severe COVID-19 and enhances SARS-CoV-2 replication in vitro.
A SOCS3 expression in healthy, mild, moderate, and severe COVID-19 donors, inferred from bulk RNA-seq analysis of PBMCs (N = 37, Singapore cohort). B Pseudobulk SOCS3 expression in healthy, mild/moderate, severe, and convalescent COVID-19 donors, inferred from PBMC scRNA-seq by averaging across cells (N = 37). C Upper airway (N = 22). D Nasal swab, healthy, WHO COVID-19 severity 1−5, severity 6–8, convalescent, similar to ref. (N = 51). E SOCS3 locus: 11 differentially methylated regions (DMRs) between PBMCs from severe COVID-19 and healthy donors, inferred from whole-genome bisulfite sequencing (black ticks). ENCODE chromatin profiles from 7 cell lines are shown below. F Degree of differential methylation at the 11 loci in mild, moderate, and severe COVID-19, relative to healthy. *: FDR Q-value ≤ 0.05; Kruskal–Wallis test. G Similar to A: average of methylation levels at the 11 DMRs in the 37 donors. H Schematic of in vitro knockdown assay to evaluate the modulation of replication of two strains of SARS-CoV-2 by SOCS3: WT-HK and Delta. I Abundance of SARS-CoV-2 (qRT-PCR) in the cell culture supernatant after shRNA knockdown, with non-targeting shRNA (sh-NT) as a control. Two independent experiments were performed on two distinct clones of the HEK-ACE2 cell line (B7, B8). Data from one experiment is shown. J. Effect of small-molecule inhibition of SOCS3 with zoledronic acid (ZOL), similar to I. Error bars represent SE of 4 technical replicates. p-values in AD, G and I: Kruskal–Wallis test. p-value in J: Student’s t-test (two-sided). Box-and-whisker plots in this figure show the median (center line), 25th, and 75th percentile (lower and upper boundary), with a 1.5x inter-quartile range indicated by whiskers and outliers shown as individual data points.

References

    1. Wu, Z. & McGoogan, J. M. Characteristics of and important lessons from the coronavirus disease 2019 (COVID-19) outbreak in China: summary of a report of 72314 cases from the Chinese Center for Disease Control and Prevention. JAMA323, 1239–1242 (2020). - PubMed
    1. Li Q, et al. Immune response in COVID-19: what is next? Cell Death Differ. 2022;29:1107–1122. doi: 10.1038/s41418-022-01015-x. - DOI - PMC - PubMed
    1. Ren, X. et al. COVID-19 immune features revealed by a large-scale single-cell transcriptome atlas. Cell184, 1895–1913.e19 (2021). - PMC - PubMed
    1. Bernardes JP, et al. Longitudinal multi-omics analyses identify responses of megakaryocytes, erythroid cells, and plasmablasts as hallmarks of severe COVID-19. Immunity. 2020;53:1296–1314 e1299. doi: 10.1016/j.immuni.2020.11.017. - DOI - PMC - PubMed
    1. Zhu L, et al. Single-cell sequencing of peripheral mononuclear cells reveals distinct immune response landscapes of COVID-19 and influenza patients. Immunity. 2020;53:685–696.e683. doi: 10.1016/j.immuni.2020.07.009. - DOI - PMC - PubMed

Substances