. 2024 Jan 18;15(1):599.
doi: 10.1038/s41467-024-44851-w.

A presynaptic source drives differing levels of surround suppression in two mouse retinal ganglion cell types

Affiliations

A presynaptic source drives differing levels of surround suppression in two mouse retinal ganglion cell types

David Swygart et al. Nat Commun. .

Abstract

In early sensory systems, cell-type diversity generally increases from the periphery into the brain, resulting in a greater heterogeneity of responses to the same stimuli. Surround suppression is a canonical visual computation that begins within the retina and is found at varying levels across retinal ganglion cell types. Our results show that heterogeneity in the level of surround suppression occurs subcellularly at bipolar cell synapses. Using single-cell electrophysiology and serial block-face scanning electron microscopy, we show that two retinal ganglion cell types exhibit very different levels of surround suppression even though they receive input from the same bipolar cell types. This divergence of the bipolar cell signal occurs through synapse-specific regulation by amacrine cells at the scale of tens of microns. These findings indicate that each synapse of a single bipolar cell can carry a unique visual signal, expanding the number of possible functional channels at the earliest stages of visual processing.


Conflict of interest statement

The authors declare no competing interests.

Figures

Fig. 1
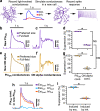
Fig. 1. Surround suppression is stronger in PixON RGCs than in ON alpha RGCs.
a En-face view of a PixON (purple) and an ON alpha (brown) dendritic arbor (maximum intensity z-projection after manual tracing). b Average dendritic stratification of PixON (n = 19) and ON alpha (n = 10) RGCs within the inner nuclear layer (INL), inner plexiform layer (IPL), and ganglion cell layer (GCL). Dotted lines refer to the ON and OFF choline acetyltransferase (ChAT) bands used to determine stratification. Shaded region indicates standard error of the mean. c Example peristimulus time histograms recorded from a PixON RGC in response to preferred size and full-field light spot stimuli. The gray horizontal bar indicates the 1-second presentation of the 250 R*/rod/s spot stimulus from a background luminance of ~0.3 R*/rod/s. d Same as (c), but recorded from an ON alpha RGC. e Mean spike rates recorded from a PixON RGC (purple) and an ON alpha RGC (brown) in response to a range of spot sizes. Shaded region indicates the standard error of the mean. Arrows indicate the preferred spot size for each RGC. f Surround suppression of spiking response for PixON (n = 55) and ON alpha (n = 90) RGCs. Dots indicate data from individual cells. Bar plots indicate average ± s.e.m., *p < 0.05, two-sided Welch’s t test. g–j Same as (c–f) but measuring excitatory conductances via whole-cell voltage clamp configuration. j PixON (n = 37) and ON alpha (n = 31). k–n Same as (c–e) but measuring inhibitory conductances via whole-cell voltage clamp configuration. n PixON (n = 32) and ON alpha (n = 21). Source data are provided as a Source Data file.
Fig. 2
Fig. 2. Excitatory conductances drive differing levels of surround suppression in PixON and ON alpha RGC spiking responses.
a Schematic illustrating dynamic clamp protocol in which previously recorded excitatory (blue) and inhibitory (red) conductances are simulated in a new RGC via current injections. Example peristimulus time histograms recorded from a PixON RGC when simulating excitatory and inhibitory conductances recorded from a different PixON RGC (b) or an ON alpha RGC (c). “Preferred-size” (dark purple) indicates the maximal spiking response when simulating conductances recorded during 200, 600, and 1200 μm diameter spot stimuli. “Full-field” (light purple) indicates simulation of conductances recorded during 1200 μm spot stimulus. d Surround suppression of PixON spiking responses when simulating conductances recorded from a different PixON (left) or an ON alpha (right) (n = 8). eg Same as (bd) but simulating conductances within an ON alpha RGC (n = 3). h Example peristimulus time histograms recorded from a PixON RGC when simulating PixON conductances to isolate the effect of full-field excitation or full-field inhibition. Purple indicates simultaneous simulation of preferred size excitation and preferred size inhibition (same as “preferred size” in (b)). Blue indicates the simulation of full-field excitation and preferred size inhibition. Orange indicates simulation of preferred size excitation and full-field inhibition. i Suppression of spiking responses induced when switching from preferred size excitation to full field excitation (blue dots, n = 4) or switching from preferred size inhibition to full field inhibition (orange dots, n = 4). d, g, i, Dots indicate data from individual cells. Bar plots indicate average ± s.e.m., *p < 0.05, Significance was determined by two-way ANOVA for (d, g) and paired, two-sided, two-sample, Student’s t test for (i). Source data are provided as a Source Data file.
Fig. 3
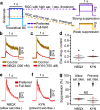
Fig. 3. Weak surround suppression of ON alpha excitatory conductances does not depend on glutamate receptor saturation or desensitization.
a Theoretical model hypothesizing how the saturation or desensitization of glutamate receptors could lead to decreased surround suppression of postsynaptic RGC excitatory conductances. Blue indicates a BC whose glutamate release has strong surround suppression. Purple indicates an RGC with glutamate receptors that do not undergo saturation or desensitization and thus responds with excitatory conductances that exhibit strong surround suppression inherited from the BC glutamate response. Brown indicates an RGC with glutamate receptors that do undergo saturation or desensitization; thus, the preferred size excitatory response is decreased relative to the full-field excitatory response. b Example ON alpha excitatory conductances evoked by a preferred spot size in control conditions (brown) or during subsaturating bath application of NBQX (red). c Same as (b), but red indicates bath application of kynurenic acid (KYN). d Proportion of ON alpha excitatory response (averaged across 1 s stimulus) evoked in NBQX (n = 3) or KYN (n = 3) compared to control conditions. e ON alpha excitatory conductances evoked by a preferred (red) or full-field (pink) spot size during bath application of NBQX. f Same as (e), but during bath application of KYN. g Surround suppression of ON alpha excitatory conductances in the presence of NBQX (n = 3) or KYN (n = 3). a, b, c, e, f Gray horizontal bar indicates a 1-second presentation of the stimulus. d, g Dots indicate data from individual cells. Bar plots indicate average ± s.e.m., *p < 0.05, paired, two-sided, two-sample Student’s t test. Source data are provided as a Source Data file.
Fig. 4
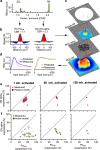
Fig. 4. A BC receptive field model of RGC excitation suggests differing BC receptive fields are necessary to evoke the differing level of surround suppression observed.
a Schematic illustrating the BC receptive field model of RGC excitation. The RGC receptive field (RGC RF) is constructed from BC receptive fields (Bipolar RF) randomly sampled across its dendritic arbor. RGC excitation is modeled as the summation of the RGC receptive field within a virtual stimulus. b Two example PixON dendritic arbors (top) and their corresponding excitatory conductances (bottom, solid line). Dotted lines indicate the model-predicted excitatory responses when using the BC RF in (c). c The BC RF that minimized the absolute error between measured and model-predicted excitatory responses from (a) (see “Methods” for details). Fitting was performed simultaneously on 6 PixON RGCs. d Experimentally measured surround suppression from PixON (n = 14) and ON alpha (n = 8) RGCs plotted against the average surround suppression predicted by the model when cross-validating against a new set of PixON and ON alpha RGCs. Note: Alignment to unity indicates perfectly accurate model prediction. eg Same as (bd), but fitting to 6 ON alpha RGCs. h–j Same as (bd), but simultaneously fitting to 3 PixON RGCs and 3 ON alpha RGCs. Source data are provided as a Source Data file.
Fig. 5
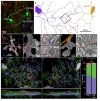
Fig. 5. PixON and ON alpha RGCs receive excitatory input from the same BCs.
a En-face view of filled PixON and ON alpha RGCs (green) imaged with 2-photon microscopy in the CCK-ires-Cre/Ai14 mouse line, which labels T6 BCs (red). Inset shows laser burn marks used as fiducial markers during SBFSEM alignment (see “Methods”). b PixON and ON alpha SBFSEM reconstructions of the tissue volume indicated by the white rectangle in (a). c Example reconstruction showing a T6 BC (semi-transparent gray mesh) forming ribbon synapses (red) onto a PixON dendrite (purple) and an ON alpha dendrite (brown). Reconstruction is taken from the approximate location indicated by the gray rectangle in (b) and rotated for better visibility of synapses. d Reconstruction of a T6 BC ribbon synapse onto a PixON dendrite (synapse #1 from (c)). e SBFSEM slices used to identify the ribbon synapse from (d) (red arrow). Top and bottom slices are situated on the same XY location, but the bottom slice is 50 nm deeper in Z. f, g, same as (d, e) but showing a T6 BC ribbon synapse onto an ON alpha dendrite (synapse #2 from (c)). h En-face (top) and orthogonal view (bottom) of BC types (T6-T9) presynaptic to the PixON RGC. i Same as (h) but for BCs presynaptic to the ON alpha RGC. j The proportion of synapses formed by each BC type onto the PixON (n = 86 synapses) and the ON alpha (n = 50 synapses) RGCs. Differences in the proportion of BC type between PixON and ON alpha were not significant. p > 0.05, two-sided two-proportions z-test with Holm-Bonferroni correction for multiple comparisons. Source data are provided as a Source Data file. Data come from one reconstruction.
Fig. 6
Fig. 6. Wide-field amacrine cell regulation near BC output synapses contributes to stronger surround suppression of PixON RGC excitatory responses.
a PixON excitatory conductances evoked before (top) and after (bottom) bath application of a glycine receptor antagonist (strychnine), a GABAA receptor antagonist (gabazine), a GABAB receptor antagonist (saclofen), a GABAC receptor antagonist (TPMPA), or NaV channel blocker (TTX). The gray horizontal bar indicates a 1-second presentation of the stimulus. Note: The response to full field stimuli in the TPMPA + TTX conditions was shifted down 2 nS to improve visibility. b Surround suppression of excitatory conductances in control and antagonists conditions. Dots indicate data from individual cells strychnine (n = 3), gabazine (n = 3), saclofen (n = 4), TPMPA (n = 6), TTX (n = 5), TPMPA + TTX (n = 5). Bar plots indicate average ± s.e.m., *p < 0.05, paired, two-sided, two-sample Student’s t test. c SBFSEM slice (top) and reconstruction (bottom) showing an AC neurite (cyan) forming an inhibitory synapse (yellow) onto a BC (gray), which then forms a ribbon synapse (red arrow) onto a PixON RGC dendrite (purple). d A zoomed-out En-face (top) and orthogonal (bottom) view of the AC from (c). e Reconstruction of nearest presynaptic ACs to T6 BC-to-PixON (left) and T6-to-ON alpha (right) ribbon synapses. f Distance to nearest inhibitory from T6 BC output synapses (PixON n = 51, ON alpha n = 26) and T7 BC output synapses (PixON n = 14, ON alpha n = 17). Dots indicate data from each BC-to-RGC synapse. Bar plots indicate average ± s.e.m., *p < 0.05, two-sided Welch’s t test. Source data are provided as a Source Data file. Data come from one reconstruction.
Fig. 7
Fig. 7. Inhibitory surround strength measured in the axons of a BC compartmental cable model.
a A SBFSEM reconstruction of a T6 BC, including 84 ribbon output synapses (blue) and 120 inhibitory input synapses (red). b Voltage of the synaptic ribbons indicated in (a) (black arrows) during simulation experiments in a passive model of the T6 BC. Blue lines indicate voltage recorded during simulations in which excitatory synapses located on the BC dendrites were stochastically activated for 1 s (gray bar). Red lines indicate simulations in which the same excitatory dendritic synapses were activated while simultaneously activating the two inhibitory axonal synapses indicated by red arrows in (a). c Same as (b), but simulations were performed in an active model of a T6 BC whose membrane contained voltage-gated channels (L-type Ca2+, KV+, and HCN2). Black arrows illustrate the measurement of the excitatory center as the average depolarization from baseline induced by stimulation of the excitatory synapses and the measurement of the inhibitory surround as the average hyperpolarization when stimulating the inhibitory synapses on the axons. d Example histogram of the center-to-surround ratio (CSR) measured at each ribbon synapse in the passive (top) and active (bottom) BC model when activating a single inhibitory synapse. Q1 indicates the quartile of ribbon synapses (21 ribbons) with the lowest CSR values, and Q4 indicates the quartile of ribbon synapses (21 ribbons) with the highest CSR values. e, f, Same as (d) but when simultaneously activating 60 (e) or 120 (f) inhibitory synapses. g Range of CSR values resulting when stimulating different numbers of N-nearest inhibitory synapses. CSR range is calculated as the difference between the average CSR value of the top quartile of ribbon synapses (Q4) and the average CSR value of the bottom quartile of ribbon synapses (Q1). Number of inhibitory synapses indicates activation of a subset of N-nearest inhibitory synapses, which was repeated for each of the 120 inhibitory synapse locations. Thick lines indicate the median range of CSR values measured, and thin lines indicate the maximum and minimum range of CSR values measured across all 120 sets of inhibitory synapses. Note: As inhibitory synapse number increases, maximum and minimum range values converge on the median as there are 120 range values obtained when activating one inhibitory synapse but only one CSR range value obtained when activating all 120 inhibitory synapses. Green lines indicate the active model of the T6 BC, and red lines indicate the passive model of the T6 BC. Source data are provided as a Source Data file.
Fig. 8
Fig. 8. Modeling suppression of RGC excitatory responses through electrical isolation of inhibition in the BC axonal arbor.
a Example histogram of CSR value measured at each of the BC ribbon output synapses when activating a single inhibitory synapse in the active compartmental cable model of the BC (see Fig. 7d). Q1 indicates the quartile of ribbons with the lowest CSR values, and Q4 indicates the quartile of ribbons with the largest CSR values. b Difference of Gaussian receptive field when using the average Q1 CSR value (left) or the average Q4 CSR value (right). Note: Center size and surround size were fixed at values obtained when fitting to PixON excitatory conductances (see Fig. 4c and “Methods”). c BC receptive field model of RGC excitation, which predicts RGC excitatory responses as the sum of BC receptive field subunits (difference of Gaussian receptive fields from (b)) sampled across the RGC dendritic arbor (see Fig. 4a and “Methods”). d RGC excitatory conductances for a range of spot sizes predicted by the BC receptive field model (dotted line) and experimentally measured (solid line). Left shows the RGC excitatory responses predicted when providing the model with PixON RGC dendritic arbors and a BC subunit receptive field with a CSR value of 1.1 (Q1 average from (a)). Right shows the RGC excitatory responses predicted when providing the model with ON alpha RGC dendritic arbors and a BC subunit receptive field with a CSR value of 2.3 (Q4 average from (a)). e, f Average surround suppression of PixON excitatory responses plotted against average surround suppression of ON alpha excitatory responses. Dots indicate values predicted from the BC receptive field model with PixON surround suppression predicted using the average Q1 CSR values, and ON alpha surround suppression predicted using the average Q4 CSR values. Note: Each dot represents a separate simulation in which a unique set of inhibitory synapses were simultaneously activated. The red cross indicates the average surround suppression of excitatory conductances experimentally measured in the PixON RGCs (81% ± 3.7%, n = 14) and the ON alpha RGCs (28% ± 3.1%, n = 8). The length of the cross lines indicates the standard error of the mean. Predictions were made with CSR values obtained when activating one inhibitory synapse (left), 60 inhibitory synapses (middle), or all 120 inhibitory synapses (right). For (e), CSR values were obtained from the passive compartmental cable model of the BC. For (f), CSR values were obtained from the active model of the T6 BC. Source data are provided as a Source Data file.

References

    1. Bae, J. A. et al. Digital museum of retinal ganglion cells with dense anatomy and physiology. Preprint at 10.1101/182758. - PMC - PubMed
    1. Kerschensteiner D. Feature detection by retinal ganglion cells. Annu Rev. Vis. Sci. 2022;8:135–169. doi: 10.1146/annurev-vision-100419-112009. - DOI - PubMed
    1. Sanes JR, Masland RH. The types of retinal ganglion cells: current status and implications for neuronal classification. Annu. Rev. Neurosci. 2015;38:221–246. doi: 10.1146/annurev-neuro-071714-034120. - DOI - PubMed
    1. Masland RH. The neuronal organization of the retina. Neuron. 2012;76:266–280. doi: 10.1016/j.neuron.2012.10.002. - DOI - PMC - PubMed
    1. Baden T, et al. The functional diversity of retinal ganglion cells in the mouse. Nature. 2016;529:345–350. doi: 10.1038/nature16468. - DOI - PMC - PubMed

LinkOut - more resources