. 2024 Jan 18;15(1):600.
doi: 10.1038/s41467-024-44835-w.

PROST: quantitative identification of spatially variable genes and domain detection in spatial transcriptomics

Affiliations

PROST: quantitative identification of spatially variable genes and domain detection in spatial transcriptomics

Yuchen Liang et al. Nat Commun. .

Abstract

Computational methods have been proposed to leverage spatially resolved transcriptomic data, pinpointing genes with spatial expression patterns and delineating tissue domains. However, existing approaches fall short in uniformly quantifying spatially variable genes (SVGs). Moreover, from a methodological viewpoint, while SVGs are naturally associated with depicting spatial domains, they are technically dissociated in most methods. Here, we present a framework (PROST) for the quantitative recognition of spatial transcriptomic patterns, consisting of (i) quantitatively characterizing spatial variations in gene expression patterns through the PROST Index; and (ii) unsupervised clustering of spatial domains via a self-attention mechanism. We demonstrate that PROST performs superior SVG identification and domain segmentation with various spatial resolutions, from multicellular to cellular levels. Importantly, PROST Index can be applied to prioritize spatial expression variations, facilitating the exploration of biological insights. Together, our study provides a flexible and robust framework for analyzing diverse spatial transcriptomic data.


Conflict of interest statement

The authors declare no competing interests.

Figures

Fig. 1
Fig. 1. Overview of PROST.
a Spatial transcriptomics (ST) techniques enable the simultaneous profiling of RNA transcripts with spatial locations. b Workflow of the calculation of PROST Index (PI). In the workflow, the spatial expression matrix of each gene is converted to an image for downstream processing. Each gene-based image is subjected to a Gaussian filtering process to suppress noise and is then divided into foreground and background, respectively, via threshold segmentation. PI scores are calculated for each gene using foreground and background signals and then applied for quantifying gene spatial expression patterns, identifying spatially variable genes (SVGs), and selecting gene features for dimensionality reduction processing. c Workflow of PROST Neural Network (PNN) processing. PNN is constructed using a directed graph based on spatial location pre-defined neighborhoods. PNN further uses a stacked graph Laplacian smoothing filter to aggregate neighbor information. The smoothed feature is then fed into a self-attention mechanism to generate a meaningful low-dimensional representation that integrates spatial and transcriptional information through adaptive learning. d The downstream analysis uses the low-dimensional representation for UMAP visualization, domain segmentation, and feature selection.
Fig. 2
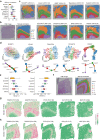
Fig. 2. PROST improves the identification of spatial domains and the detection of SVGs in the human dorsolateral prefrontal cortex (DLPFC) tissue.
a Boxplot shows the Adjusted Rand Index (ARI) to summarize the domain segmentation accuracy of each method in all 12 sections of the DLPFC dataset. The boxplot’s center line, box limits, and whiskers denote the median, upper and lower quartiles, and 1.5× interquartile range, respectively. Source data are provided as a Source Data file. b Hematoxylin and Eosin (H&E) image and the manual annotation of the DLPFC section 151672. c Spatial domains identified by SCANPY, stLearn, HMRF, BayesSpace, SpaGCN, SpaceFlow, STAGATE, BASS, and PROST, respectively, in the DLPFC section 151672. d UMAP visualizations (top) and PAGA graphs (bottom) generated by SCANPY, stLearn, SpaceFlow, STAGATE, and PROST, respectively, for the DLPFC section 151672 dataset. The UMAPs and PAGA graphs were colored by the corresponding layer annotation of spots in (b). e Boxplot shows the Moran’s I and Geary’s C values for spatial autocorrelation using 50 top-ranked SVGs detected by Seurat, SpatialDE, scGCO, SPARK-X, SINFONIA and PROST, respectively, in the DLPFC section 151672 dataset. The boxplot legend is the same as (a). Source data are provided as a Source Data file. f H&E image (left) and the manual annotation (right) of the DLPFC section 151675. Representative SVGs detected by PROST in the DLPFC section 151672 (g) show the same spatial patterns in the DLPFC section 151675 (h), demonstrating the transportability of SVGs.
Fig. 3
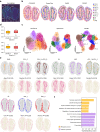
Fig. 3. PROST reveals spatial cellular patterns in mouse olfactory bulb tissue using Stereo-seq data at single-cell resolution.
a Laminar organization of the mouse olfactory bulb annotated in the DAPI-stained image generated by the original paper of SEDR. b Spatial domains identified by STAGATE, SpaceFlow, BASS, and PROST, respectively, with a fixed number of clusters (n = 11) as a clustering parameter. PROST’s spatial domains were annotated by marker genes, which are ONL_1: olfactory nerve layer_1, EPL_1: external plexiform layer_1, GCL_E: granule cell layer externa, ONL_2: olfactory nerve layer_2, MCL: mitral cell layer, GCL_I: granule cell layer internal, GCL_D: granule cell layer deep; EPL_2: external plexiform layer_2, GL: glomerular layer; IPL: internal plexiform layer; RMS: rostral migratory stream, from inside to outside, respectively. c, UMAP visualizations generated by STAGATE, SpaceFlow, and PROST, respectively. The UMAPs were colored according to the corresponding layer annotation of spots in (b). d Boxplot shows the Moran’s I and Geary’s C values that were calculated for the 20 top-ranked SVGs detected by PROST and SPARK-X, respectively. The boxplot’s center line, box limits, and whiskers denote the median, upper and lower quartiles, and 1.5× interquartile range, respectively. Source data are provided as a Source Data file. e Visualization of spatial domains (top) identified by PROST and spatial expression patterns of the corresponding marker genes (bottom). The annotation of spatial domains is the same as in (b) (PROST). f Gene Ontology (GO) enrichment analysis for the SVGs detected by PROST. The length of bars represents the enrichment of GO terms using -log10(FDR adjusted p value) metric from topGO analysis. Bars are colored into two categories according to biological process (yellow) and cellular component (purple). P values were obtained using the one-sided Fisher’s exact test with FDR correction. Source data are provided as a Source Data file.
Fig. 4
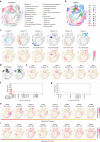
Fig. 4. PROST deciphers spatial cellular patterns in mouse embryogenesis using SeqFISH data at single-cell resolution.
a Annotation of SeqFISH-profiled mouse embryo tissue sections, which was obtained from the original publication. b Spatial domains identified by PROST using the SeqFISH data with a fixed number of clusters (n = 24) as a clustering parameter. c Visualization of representative spatial domains (top) identified by PROST and spatial expression patterns of the corresponding marker genes (bottom). d Spatial location of forebrain/midbrain/hindbrain in the original annotation (left) and the corresponding domains segmented by PROST (right). e Marker genes of the corresponding domains in forebrain/midbrain/hindbrain segmented by PROST. Distribution of PI scores of Hox (f) and Wnt gene families (g). Source data are provided as a Source Data file. Spatial expression patterns of the top-ranked members of Hox (h) and Wnt gene families (i) identified by PROST.

Similar articles

Cited by

References

    1. Palla G, Fischer DS, Regev A, Theis FJ. Spatial components of molecular tissue biology. Nat. Biotechnol. 2022;40:308–318. doi: 10.1038/s41587-021-01182-1. - DOI - PubMed
    1. Asp M, Bergenstråhle J, Lundeberg J. Spatially resolved transcriptomes—next generation tools for tissue exploration. BioEssays. 2020;42:1900221. doi: 10.1002/bies.201900221. - DOI - PubMed
    1. Rao A, Barkley D, França GS, Yanai I. Exploring tissue architecture using spatial transcriptomics. Nature. 2021;596:211–220. doi: 10.1038/s41586-021-03634-9. - DOI - PMC - PubMed
    1. Lu Y, et al. Spatial transcriptome profiling by MERFISH reveals fetal liver hematopoietic stem cell niche architecture. Cell Discov. 2021;7:47. doi: 10.1038/s41421-021-00266-1. - DOI - PMC - PubMed
    1. Lubeck E, Coskun AF, Zhiyentayev T, Ahmad M, Cai L. Single-cell in situ RNA profiling by sequential hybridization. Nat. Methods. 2014;11:360–361. doi: 10.1038/nmeth.2892. - DOI - PMC - PubMed