. 2024 Apr;130(6):908-924.
doi: 10.1038/s41416-023-02522-5. Epub 2024 Jan 18.

Redox signalling regulates breast cancer metastasis via phenotypic and metabolic reprogramming due to p63 activation by HIF1α

Affiliations

Redox signalling regulates breast cancer metastasis via phenotypic and metabolic reprogramming due to p63 activation by HIF1α

Zuen Ren et al. Br J Cancer. 2024 Apr.

Abstract

Background: Redox signaling caused by knockdown (KD) of Glutathione Peroxidase 2 (GPx2) in the PyMT mammary tumour model promotes metastasis via phenotypic and metabolic reprogramming. However, the tumour cell subpopulations and transcriptional regulators governing these processes remained unknown.

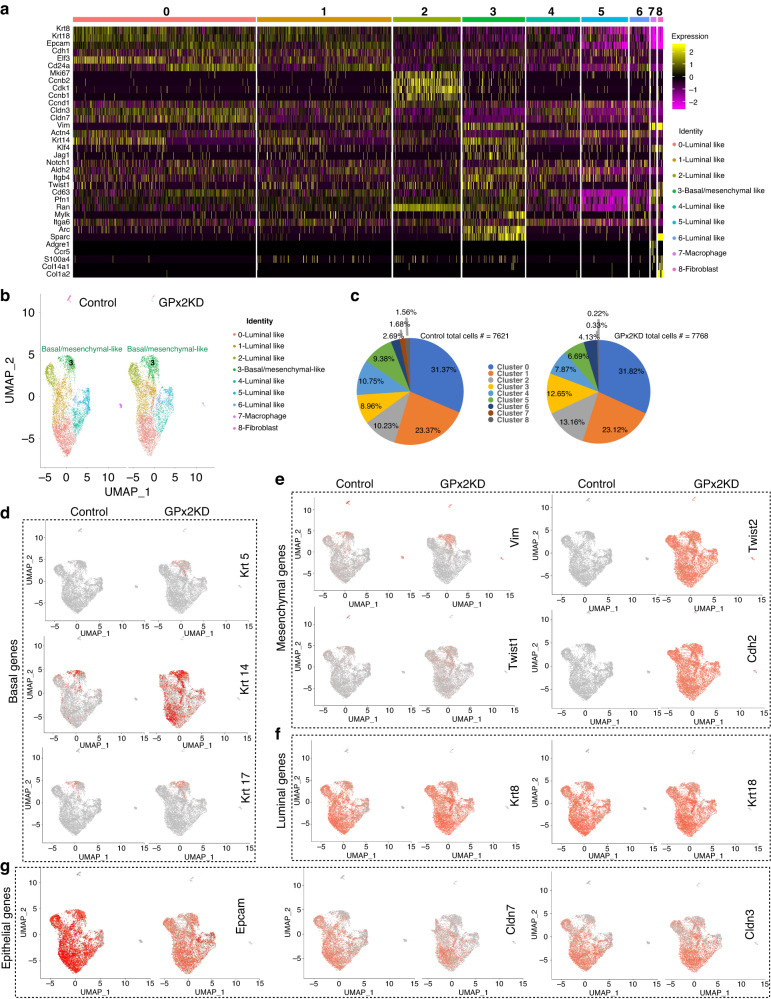
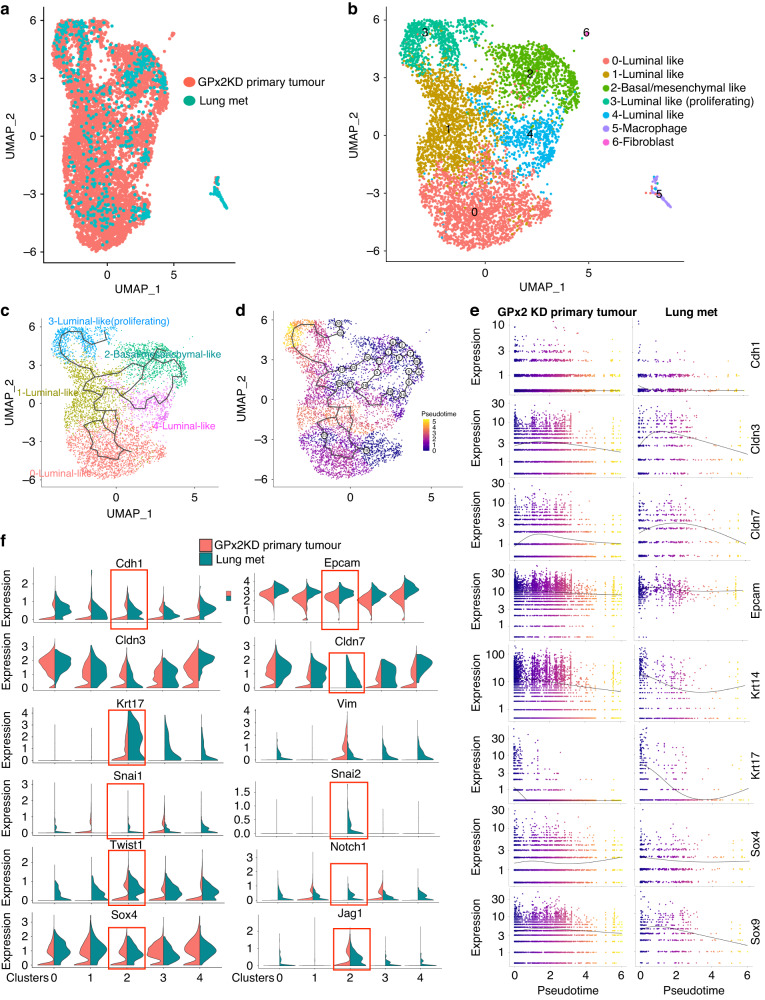
Methods: We used single-cell transcriptomics to decipher the tumour cell subpopulations stimulated by GPx2 KD in the PyMT mammary tumour and paired pulmonary metastases. We analyzed the EMT spectrum across the various tumour cell clusters using pseudotime trajectory analysis and elucidated the transcriptional and metabolic regulation of the hybrid EMT state.

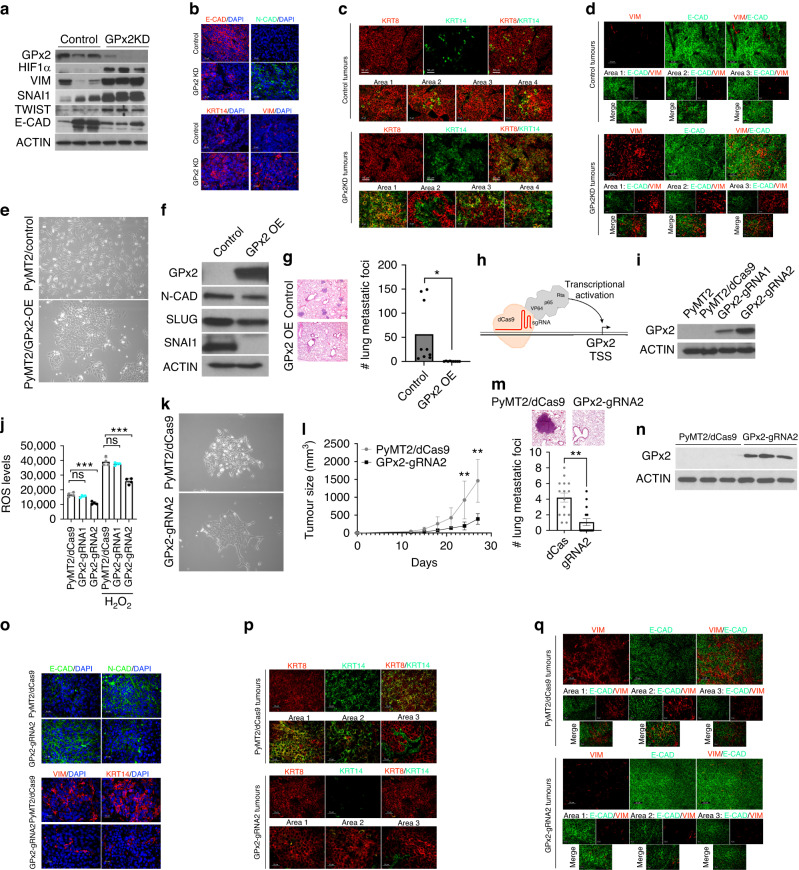
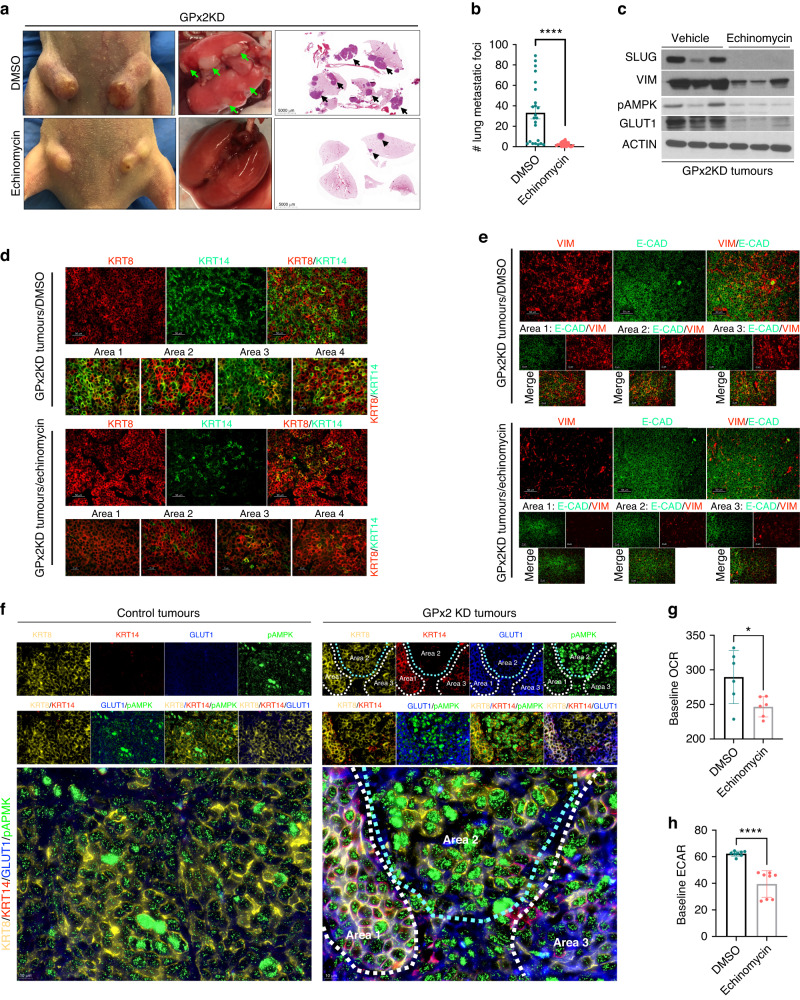
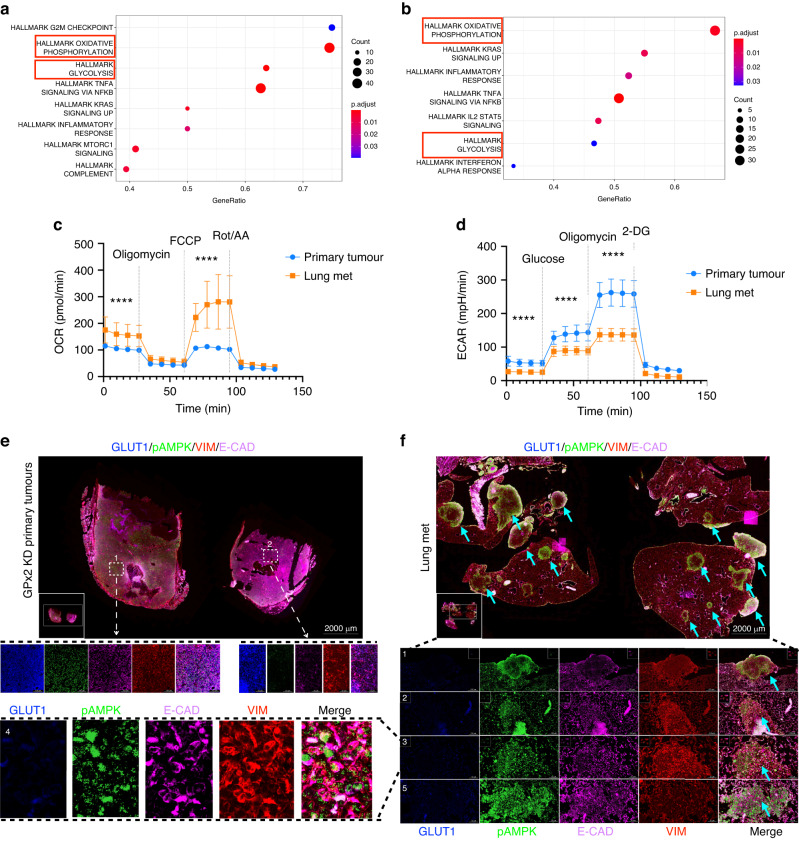
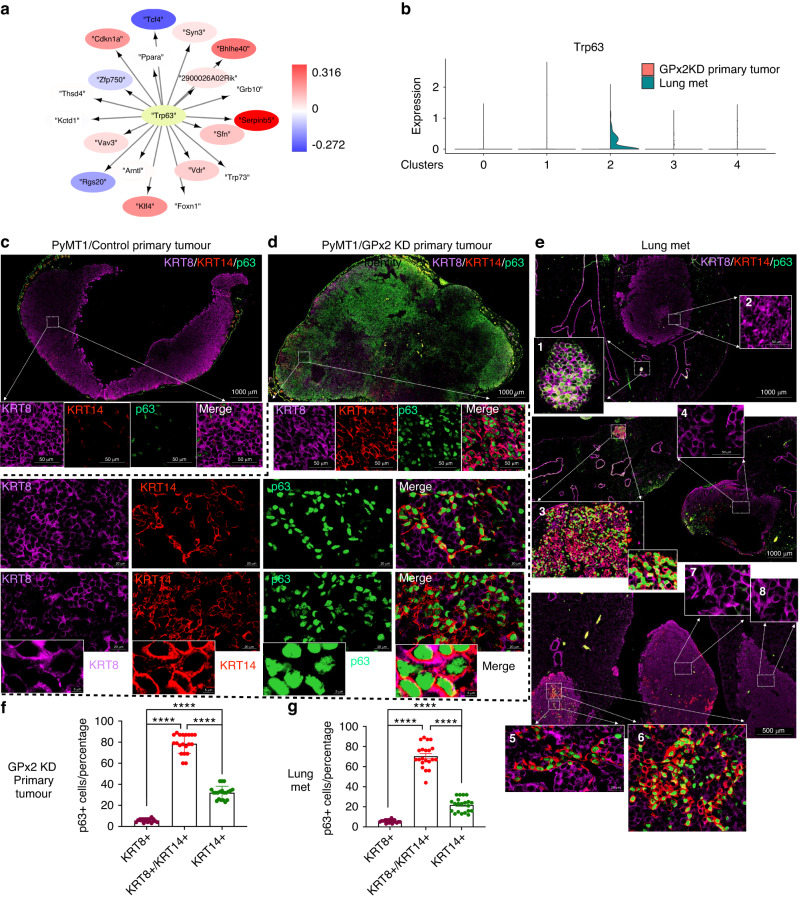
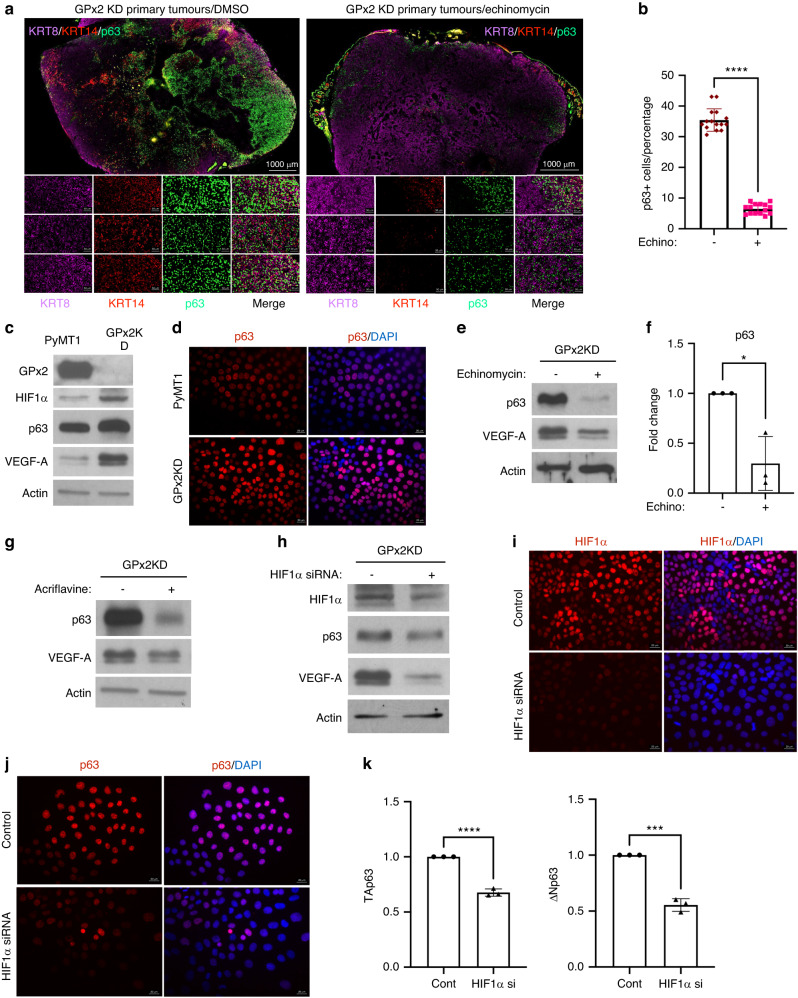
Results: Integration of single-cell transcriptomics between the PyMT/GPx2 KD primary tumour and paired lung metastases unraveled a basal/mesenchymal-like cluster and several luminal-like clusters spanning an EMT spectrum. Interestingly, the luminal clusters at the primary tumour gained mesenchymal gene expression, resulting in epithelial/mesenchymal subpopulations fueled by oxidative phosphorylation (OXPHOS) and glycolysis. By contrast, at distant metastasis, the basal/mesenchymal-like cluster gained luminal and mesenchymal gene expression, resulting in a hybrid subpopulation using OXPHOS, supporting adaptive plasticity. Furthermore, p63 was dramatically upregulated in all hybrid clusters, implying a role in regulating partial EMT and MET at primary and distant sites, respectively. Importantly, these effects were reversed by HIF1α loss or GPx2 gain of function, resulting in metastasis suppression.

Conclusions: Collectively, these results underscored a dramatic effect of redox signaling on p63 activation by HIF1α, underlying phenotypic and metabolic plasticity leading to mammary tumour metastasis.


Conflict of interest statement

The authors declare no competing interests.

Figures

Fig. 1
Fig. 1. GPx2 KD stimulates mesenchymal gene expression in M-cluster 3 and luminal clusters.
a Heatmap shows manually supervised-automated clustering of individually selected marker genes from integrated PyMT1/GPx2KD and control PyMT1 single cell RNA datasets. b UMAP projection of comprehensively integrated clustering results from one PyMT1 control and one PyMT1/GPx2 KD tumour revealed six luminal-like clusters (cluster 0, 1, 2, 4, 5, 6), one basal/mesenchymal-like cluster (cluster 3), and two non-epithelial clusters (clusters 7 and 8). c Pie graphs display the percentage of cells in each cluster in GPx2 KD vs control tumour. Pearson’s Chi-square test, p value = 2.2e−16; two-sample test for equality of proportions with continuity correction, data c (983, 683) out of c(7768, 7621), p value = 1.03e−13. dg Feature plots in low-dimensional space showing expression of basal genes (Krt5, Krt14, Krt17) (d), mesenchymal genes (Vim, Twist1, Twist2, Cdh2) (e), luminal genes (Krt8 and Krt18) (f), epithelial genes (Epcam, Cldn3/7) (g) in the GPx2 KD tumour relative to control tumour.
Fig. 2
Fig. 2. GPx2 KD promotes EMT dynamics in vivo that were reversed by GPx2 gain of function.
a Western blots of PyMT1/GPx2 KD vs control PyMT1 tumour lysates (n = 3 mice), for expression of GPx2, HIF1α, VIM, SNAI1, TWIST, E-CAD relative to ACTIN. b Immunofluorescent (IF) staining for E-CAD, N-CAD, KRT14, VIM in GPx2 KD vs control tumours (n = 5 mice; 3 sections each). c, d IF staining for KRT8 and KRT14 (c), VIM and E-CAD (d) in control and GPx2 KD tumours (n = 5 mice); Representative images illustrate different EMT states in various tumour areas. (E) Phase-contrast images of PyMT2 cells and PyMT2/GPx2OE cells at ×10 magnification. f Western blots of PyMT2 and PyMT2/GPx2OE cell lysates for expression of GPx2, N-CAD, SLUG, SNAI1 vs ACTIN. g Bar graphs show the number of metastatic foci per lung section (n = 3) from 3 female athymic mice that were tail-vein injected with PyMT2 vs PyMT2/GPx2OE cells; Mean ± SEM; *p < 0.05. Images of lung foci are shown. h Schematic of the sgRNA-dCas9-VPR complex. Transactivators VP64, p65, and Rta were directly fused with C-terminal of dCas9. i Two GPx2 targeting sgRNAs-dCas9-VPR were used to endogenously activate GPx2 expression in PyMT2 cells, and dCas9-VPR without sgRNA was used as control. j ROS levels are shown as Mean ± SEM; ***p < 0.001, ns indicates non-significance. k Phase-contrast images of PyMT2/dCas9 control and PyMT2/GPx2-gRNA2 cells at 10x magnification. l Control and GPx2-gRNA2 cells (1 × 106) were bilaterally injected into mammary fat pads of female athymic nude mice (n = 3 each group). Tumour growth curves over 28 days post tumour onset are shown as Mean of tumour volume ± SEM; **p < 0.01. m Scans of H&E stained sections of lung (boxes) from mice carrying control or GPx2-gRNA2 tumours (upper panels); Graph showing average number of foci per lung section (n = 5) from 3 mice per group; Mean ± SEM; ***p < 0.001. n IB shows GPx2 vs ACTIN in GPx2-gRNA2 vs control PyMT2 tumours (n = 3 mice). o IF images from E-CAD vs N-CAD (top panels) and KRT14 vs VIM (bottom panels) in GPx2-gRNA2 vs control tumours (n = 6). p, q Co-staining of KRT8/KRT14 (p) (top), VIM/E-CAD (q) (bottom) in GPx2-gRNA2 vs control tumours (n = 6); 3 mice each.
Fig. 3
Fig. 3. Pseudotime trajectory analysis illustrates the transcriptional EMT/MET continuum between clusters from primary GPx2 KD tumour and paired lung metastases.
a, b UMAP projection of comprehensively integrated clustering data from GPx2 KD primary tumour and paired lung mets using the integration pipeline in Seurat, unravelled 7 clusters involving four luminal-like (cluster 0, 1, 3, 4), one basal/mesenchymal-like (cluster 2); one macrophage-like (cluster 5) and one fibroblast-like (cluster 6). c, d Pseudotime time trajectories (d) of integrated clustering projected onto UMAP (c); the bifurcating line illustrates a branched trajectory from the root of one of the terminal nodes, which was arbitrarily set as cluster 2 or the most mesenchymal transcriptional node; colour changes (d) reflect pseudotime distance between clusters (basal/mesenchymal cluster 2 located at t = 0). e Gene expression levels of epithelial/luminal genes (Cdh1, Cldn3/7, Epcam), basal/mesenchymal (Krt14, Krt17) and stemness (Sox4, Sox9) across pseudotime distance between the clusters in primary GPx2 KD tumour vs lung mets are shown as curves; colours indicate individual clusters in UMAP projection over pseudotime distance. f Violin plots show relative expression of genes that were either epithelial/luminal (Cdh1, Epcam, Cldn3/7), basal/mesenchymal (Krt17,Vim, Snai1/2,Twist1), or stem-like (Notch1, Jag1, Sox4) in clusters from lung mets vs primary GPx2KD tumour, pointing to lung mets cluster 2 as the most hybrid (square).
Fig. 4
Fig. 4. HIF1α regulates metastasis via promotion of hybrid EMT state and metabolic plasticity.
a Athymic female mice (n = 10) bearing PyMT1/GPx2 KD tumours were treated post onset with daily i.p injection of vehicle (DMSO) or 10 μg/kg of echinomycin/DMSO for 21 days starting at 64 mm3 tumour volume. Representative tumours from both groups are shown (left boxes). Mice then underwent survival surgery to remove primary tumour and were left untreated for 1 week to recover. Treatment was then resumed daily for one more week as above. Four weeks later, mouse lungs were removed (second boxes), sectioned, H&E-stained and scanned; scans of whole lung lobes (third boxes) from both groups are shown (third boxes). b The number of lung foci from H&E stained sections are shown; Mean ± SEM; ****p < 0.0001. c GPx2 KD tumours from 3 independent mice that were treated with vehicle or echinomycin were immunoblotted for SLUG, VIM, pAMPK, GLUT1 vs ACTIN. d, e KRT8/KRT14 (d) or VIM and E-CAD (e) double-immunostained PyMT1/GPx2KD tumour sections treated with either or echinomycin from 3 mice each are shown. f Co-staining for four markers consisting of KRT8 (yellow), KRT14 (red), GLUT1 (blue), and pAMPK (green) shows individual and overlay staining. Robust quadruple staining was observed in GPx2KD tumours especially in Area 1 and also in part of Area 3, but not in Area 2 which was only KRT8 + /pAMPK+ (right panels). By contrast, control PyMT1 tumours were strongly KRT8 + /pAMPK+ (left panels). Staining was done in 3 mice (2 tumours each) in 3 sections from each tumour. g, h Bar graphs display baseline OCR and ECAR for GPx2 KD tumour cells treated with 5 nM echinomycin vs DMSO; normalised results are shown as Mean ± SEM; *p < 0.05, ****p < 0.0001.
Fig. 5
Fig. 5. Lung metastases use OXPHOS as bioenergetic fuel.
a, b Gene Set Enrichment Analysis (GSEA) revealed overrepresented pathways enriched in bulk lung mets (a) and in M-cluster (cluster 2) (b) indicating a clear predilection for OXPHOS over glycolysis in cluster 2. c, d PyMT1/GPx2 KD primary tumour and lung mets primary tumour cells were assayed for OCR and ECAR; normalised OCR data comparing both groups were derived for each of the mitochondrial respiration steps after 1 μM oligomycin, 1 μM FCCP, and 0.5 μM rotenone/antimycin treatment; normalised ECAR values were derived after sequential treatment with 20 mM glucose, 1 μM oligomycin, and 50 mM 2-DG; ****p < 0.0001. e, f Co-staining for GLUT1 (blue), pAMPK (green), VIM (red), and E-CAD (purple) shows individual and overlay staining on GPx2 KD primary tumour (n = 8) and paired lung mets (n = 4) from 4 mice. Representative images are shown.
Fig. 6
Fig. 6. p63 regulates the partial EMT and MET state in primary tumour and distant metastases.
a TF-TGs analysis using the Dorothea database shows abundant enrichment of Trp63 target genes in lung mets. b Violin plots show p63 upregulation in cluster 2 relative to all other clusters when comparing lung mets to primary GPx2KD tumour. ce Multiplex staining for KRT8 (purple), KRT14 (red), p63 (green) revealed that individual and overlay staining on control PyMT1 tumours (n = 8), PyMT1/GPx2 KD tumours (n = 8), and paired lung mets (4 independent lungs from 4 GPx2 KD tumour bearing mice). f, g Graphs display percentage of p63 positive cells that also expressed KRT8, KRT8/KRT14, or KRT14 in primary GPx2KD tumours (f) or lung mets (g); Mean ± SEM; ****p < 0.0001.
Fig. 7
Fig. 7. HIF1α regulates the partial EMT and MET state via p63 upregulation.
a Co-staining of KRT8, KRT14, p63 showing individual and overlay staining in GPx2 KD tumours treated with DMSO (left panels) or echinomycin (n = 6) from 3 mice each. b Bar graphs display p63 expression levels in GPx2 KD tumours that were treated with echinomycin vs DMSO (n = 6 each); ****p < 0.0001. c Western blots of GPx2, HIF1α, p63, VEGF-A vs Actin in PyMT1/GPx2 KD and control PyMT1 cells. d p63 IF staining of control and GPx2 KD cells showing upregulation/nuclear localisation of p63 in GPx2KD relative cells (bottom). e, f Western blots of p63 and VEGF-A vs Actin in GPx2 KD cells treated with DMSO or echinomycin (e); graphs show relative densitometry of p63 protein in 3 replicas (f); Mean ± SEM; *p < 0.05. g, h Western blots of p63 and VEGF-A vs Actin in GPx2 KD cells that were treated −/+ Acriflavine (g); or −/+ HIF1α siRNA (h). i, j IF staining of HIF1α (i) and p63 (j) on GPx2 KD/control cells vs GPx2 KD/HIF1α siRNA cells. k Graphs show TA and ΔN p63 isoform RNA levels in control cells vs siRNA treated GPx2KD cells; Mean ± SEM; ***p < 0.001, ****p < 0.0001.

References

    1. Lambert AW, Pattabiraman DR, Weinberg RA. Emerging biological principles of metastasis. Cell. 2017;168:670–91. doi: 10.1016/j.cell.2016.11.037. - DOI - PMC - PubMed
    1. Ye X, Tam WL, Shibue T, Kaygusuz Y, Reinhardt F, Ng Eaton E, et al. Distinct EMT programs control normal mammary stem cells and tumour-initiating cells. Nature. 2015;525:256–60. doi: 10.1038/nature14897. - DOI - PMC - PubMed
    1. Warburg O, Wind F, Negelein E. The metabolism of tumors in the body. J Gen Physiol. 1927;8:519–30. doi: 10.1085/jgp.8.6.519. - DOI - PMC - PubMed
    1. Dupuy F, Tabaries S, Andrzejewski S, Dong Z, Blagih J, Annis MG, et al. PDK1-dependent metabolic reprogramming dictates metastatic potential in breast cancer. Cell Metab. 2015;22:577–89. doi: 10.1016/j.cmet.2015.08.007. - DOI - PubMed
    1. Davis RT, Blake K, Ma D, Gabra MBI, Hernandez GA, Phung AT, et al. Transcriptional diversity and bioenergetic shift in human breast cancer metastasis revealed by single-cell RNA sequencing. Nat Cell Biol. 2020;22:310–20. doi: 10.1038/s41556-020-0477-0. - DOI - PubMed

Publication types