. 2024 Feb;27(2):249-258.
doi: 10.1038/s41593-023-01548-5. Epub 2024 Jan 18.

Microglia regulate sleep through calcium-dependent modulation of norepinephrine transmission

Affiliations

Microglia regulate sleep through calcium-dependent modulation of norepinephrine transmission

Chenyan Ma et al. Nat Neurosci. 2024 Feb.

Abstract

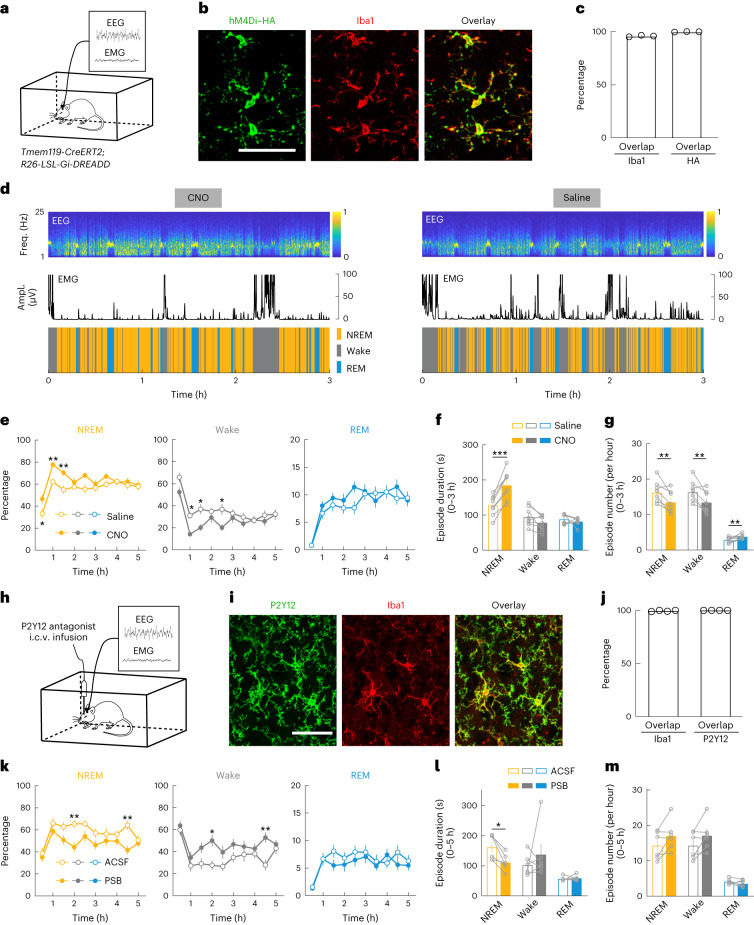
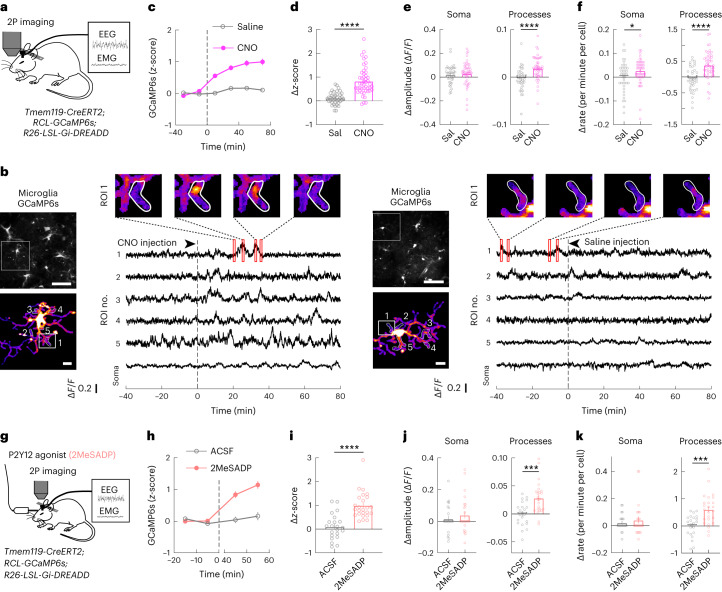
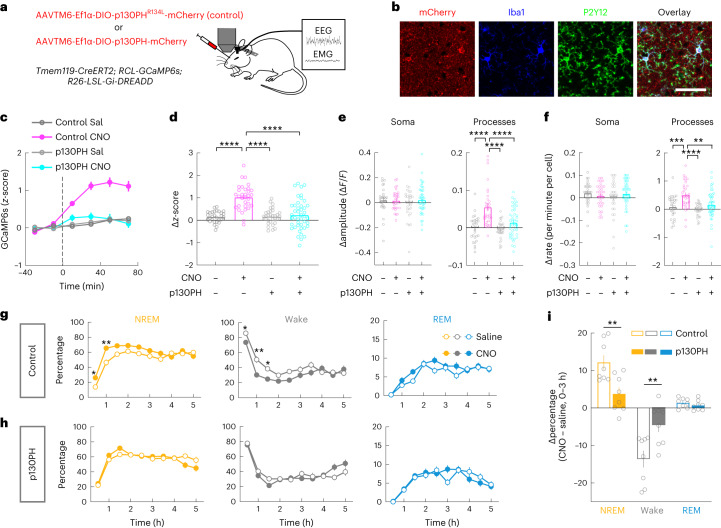
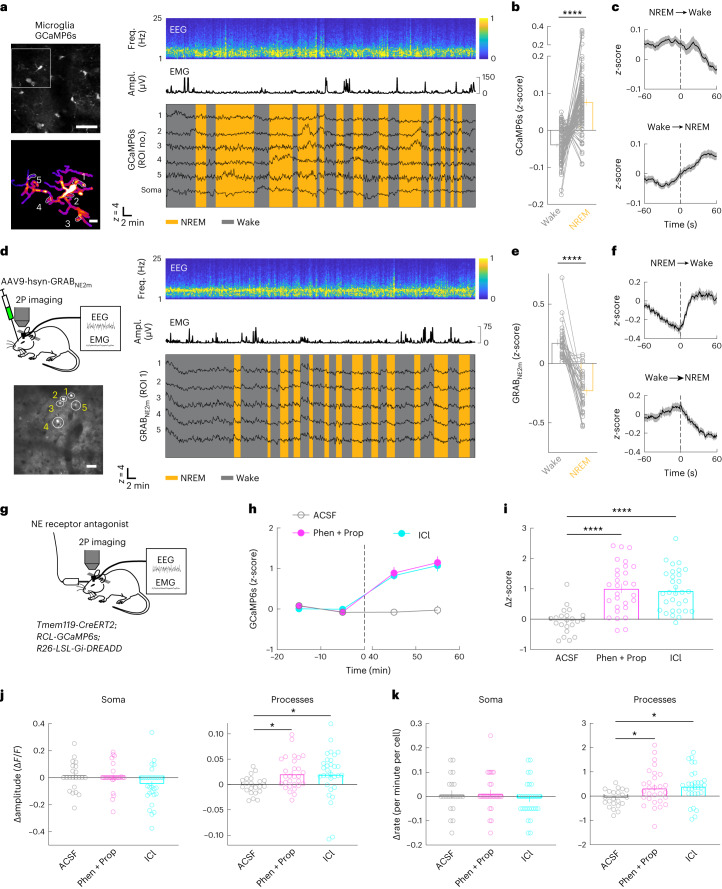
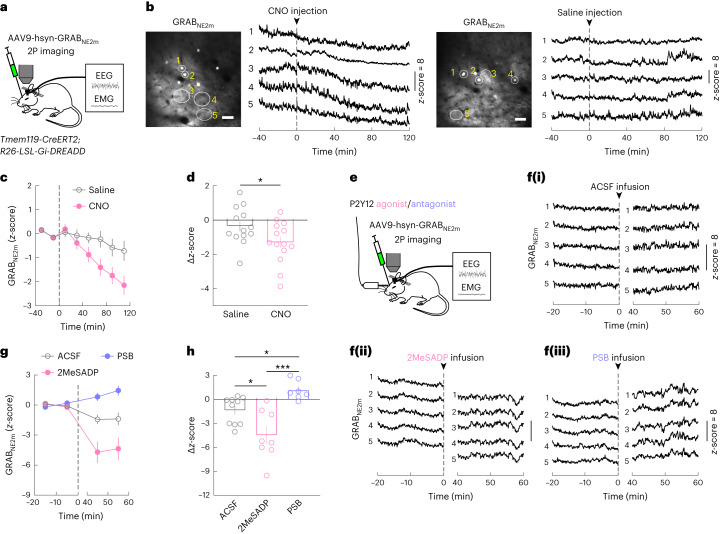
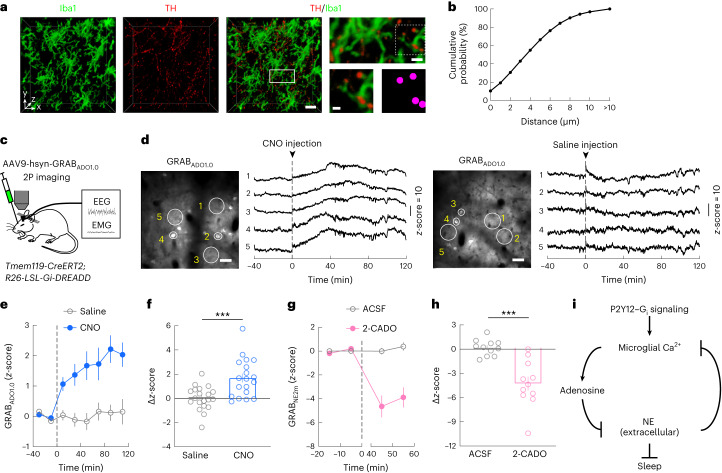
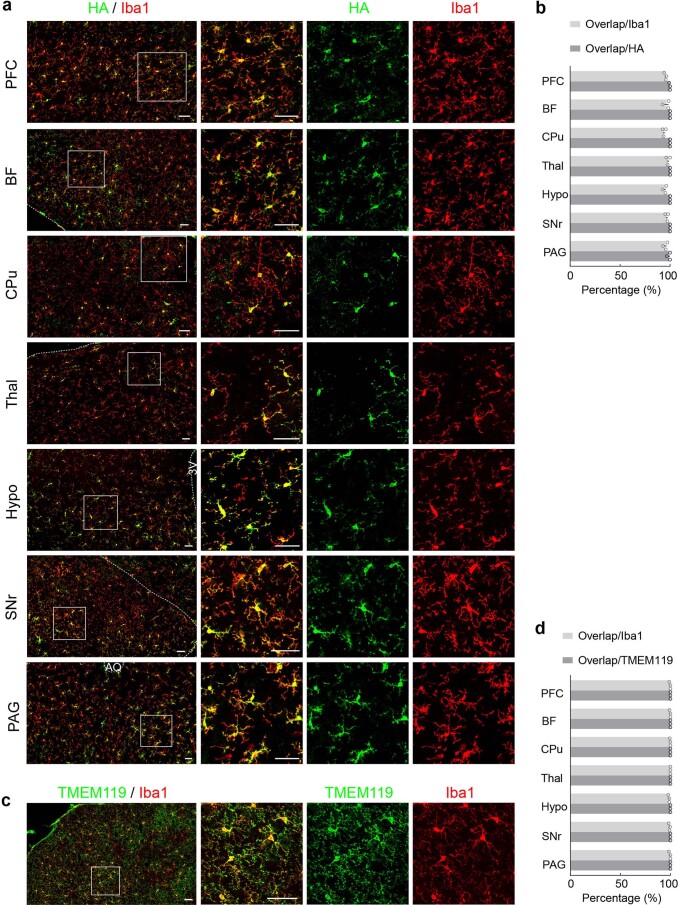
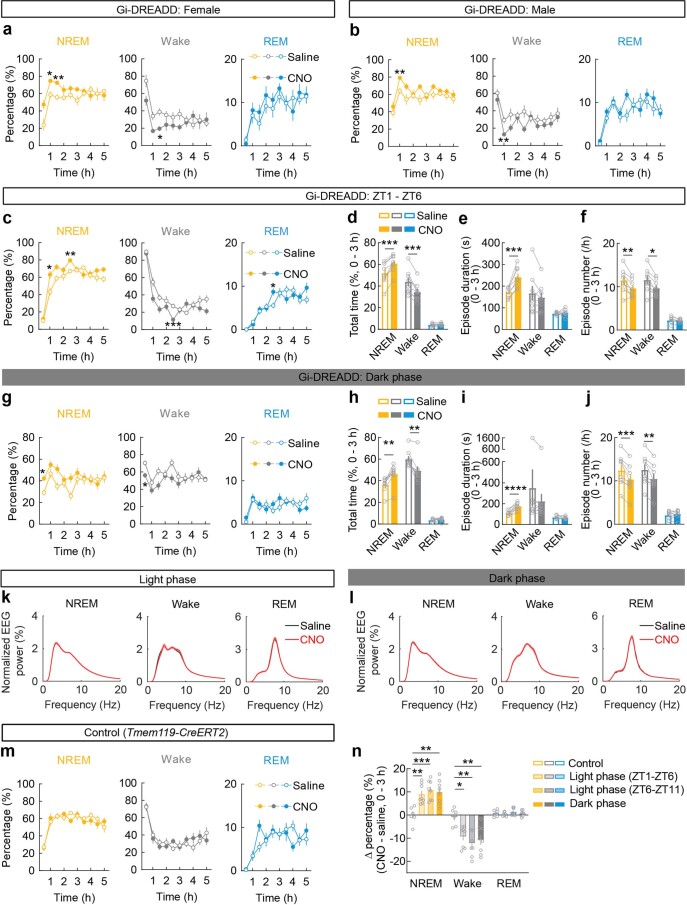
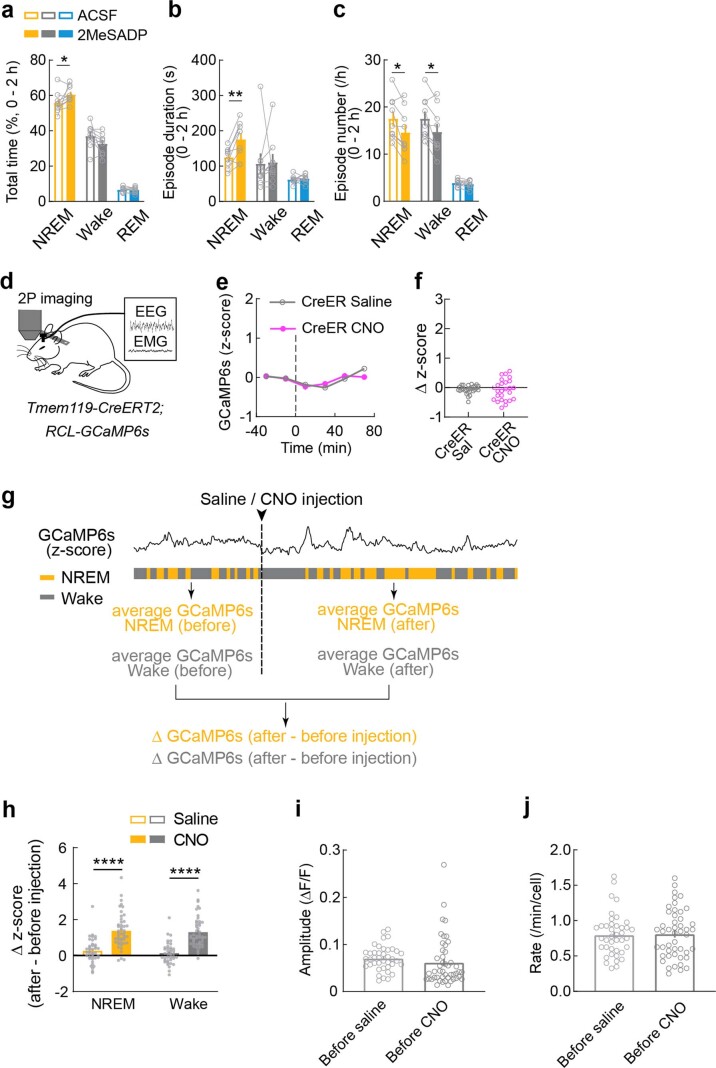
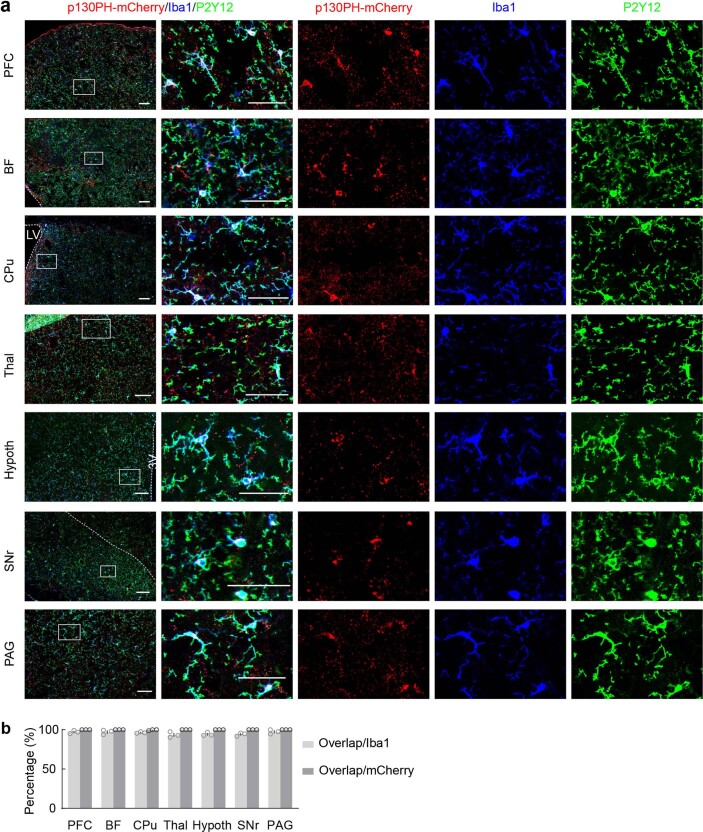
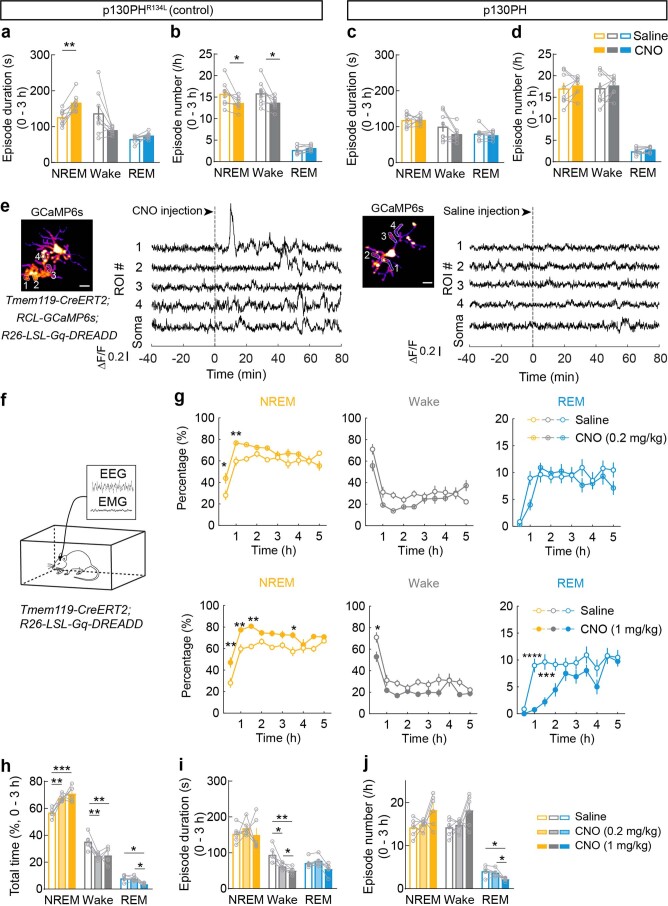
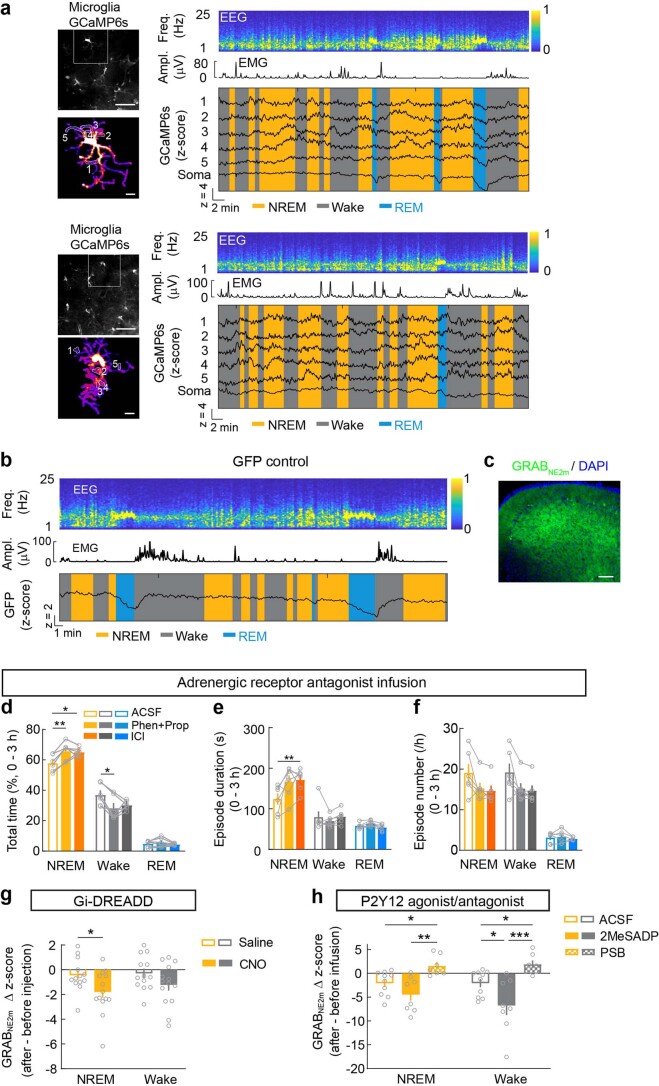
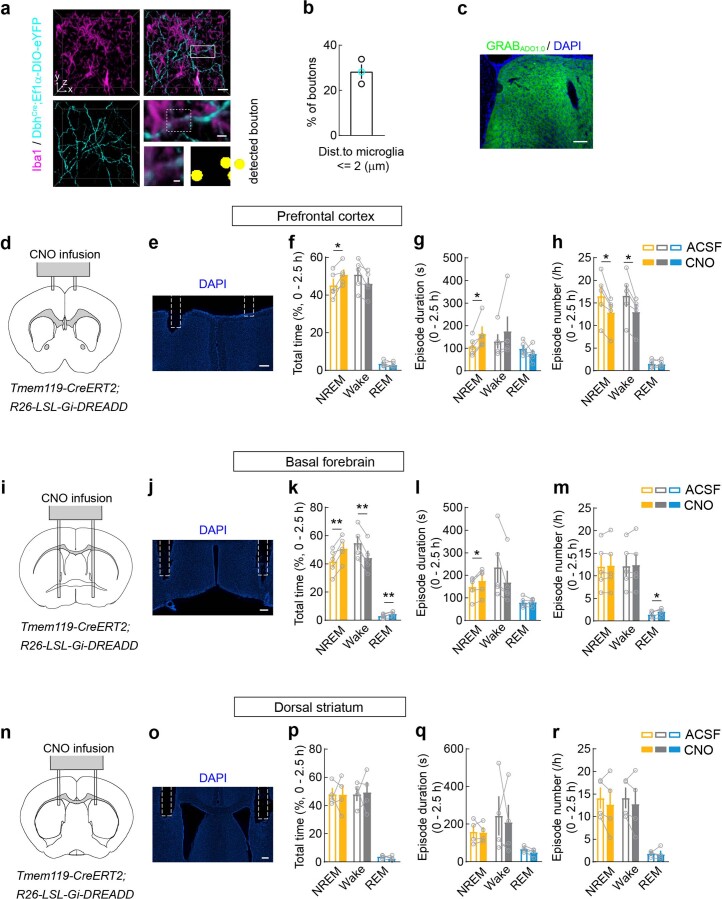
Sleep interacts reciprocally with immune system activity, but its specific relationship with microglia-the resident immune cells in the brain-remains poorly understood. Here, we show in mice that microglia can regulate sleep through a mechanism involving Gi-coupled GPCRs, intracellular Ca2+ signaling and suppression of norepinephrine transmission. Chemogenetic activation of microglia Gi signaling strongly promoted sleep, whereas pharmacological blockade of Gi-coupled P2Y12 receptors decreased sleep. Two-photon imaging in the cortex showed that P2Y12-Gi activation elevated microglia intracellular Ca2+, and blockade of this Ca2+ elevation largely abolished the Gi-induced sleep increase. Microglia Ca2+ level also increased at natural wake-to-sleep transitions, caused partly by reduced norepinephrine levels. Furthermore, imaging of norepinephrine with its biosensor in the cortex showed that microglia P2Y12-Gi activation significantly reduced norepinephrine levels, partly by increasing the adenosine concentration. These findings indicate that microglia can regulate sleep through reciprocal interactions with norepinephrine transmission.


Conflict of interest statement

The authors declare no competing interests.

Figures

Fig. 1
Fig. 1. Microglia regulate sleep through P2Y12–Gi signaling.
a, Schematic for the chemogenetic experiment. b, Confocal images from the prefrontal cortex showing hM4Di expression in Iba1+ microglia (Extended Data Fig. 1). Scale bar, 50 µm. c, Quantification of efficiency and specificity (mean ± s.e.m.; n = 3 mice). ‘Overlap’: HM4Di–HA+ and Iba1+. d, Example chemogenetic experiments. Shown are the EEG spectrogram (normalized by the maximum of each session; Freq., frequency), EMG amplitude (Ampl.) and brain states (color-coded). e, Summary of the percentages of time in each brain state following CNO and saline injection (mean ± s.e.m.; n = 8 mice: 3 female and 5 male, recorded between ZT6 and ZT11). *P < 0.05, **P < 0.01 (two-way ANOVA with Bonferroni correction; NREM: Ptreatment < 0.0001, Ptime < 0.0001, *P0.5h = 0.044, **P1h = 0.0087, **P1.5h = 0.0097; wake: Ptreatment < 0.0001, Ptime < 0.0001, *P1h = 0.020, *P1.5h = 0.022, *P2.5h = 0.024; REM: Ptreatment = 0.13, Ptime < 0.0001). f,g, Mean episode duration (f) and episode number per hour (g) for each brain state within 3 h of CNO or saline injection. Each circle indicates data from one mouse (mean ± s.e.m.; n = 8 mice). **P < 0.01, ***P < 0.001 (paired two-tailed t-test; in f, ***P = 0.0001; in g, **PNREM = 0.0091, **Pwake = 0.0070, **PREM = 0.0056). h, Schematic for P2Y12 antagonist infusion. i,j, Confocal images (i) and quantification (j) of P2Y12 expression in Iba1+ microglia in the prefrontal cortex (n = 4 mice). Scale bar, 50 μm. ‘Overlap’: Iba1+ and P2Y12+. k, Percentage of time in each brain state following PSB0739 (PSB) and ACSF infusion (mean ± s.e.m.; n = 6 mice: 1 female and 5 male). *P < 0.05, **P < 0.01 (two-way ANOVA with Bonferroni correction; NREM: Ptreatment = 0.0005, Ptime < 0.0001, **P2h = 0.0053, **P4.5h = 0.0021; wake: Ptreatment = 0.0011, Ptime < 0.0001, *P2h = 0.014, **P4.5h = 0.0037; REM: Ptreatment = 0.23, Ptime < 0.0001). l,m, Mean episode duration (l) and episode number per hour (m) for each brain state within 5 h of PSB0739 or ACSF infusion. Each circle indicates data from one mouse (mean ± s.e.m.; n = 6 mice). *P < 0.05 (two-tailed Wilcoxon signed rank test, *P = 0.031). Source data
Fig. 2
Fig. 2. Activation of microglia Gi signaling increases intracellular Ca2+.
a, Schematic for two-photon (2P) Ca2+ imaging in head-fixed mice. b, Example imaging sessions with CNO and saline injection. Top left, field of view (scale bar, 50 μm); bottom left, high-magnification view of the microglia soma and processes in the white box (scale bar, 10 μm); five regions of interest (ROIs) in microglia processes are outlined, whose Ca2+ traces are shown on the right, with snapshots of Ca2+ transients shown on top (red box and associated dashed line indicate the time period for each snapshot). The dashed line indicates the time of CNO or saline injection. c, z-scored Ca2+ activity averaged across all microglia (CNO, n = 47; saline, n = 40; from 5 mice: 3 female and 2 male; circles and error bars, mean ± s.e.m.). Dashed line, time of injection. df, Population summary of the CNO-induced change in mean Ca2+ level (d) and the amplitude (e) and frequency (f) of Ca2+ events in soma and processes (difference between before and after injection). Each circle indicates data from one cell. CNO: somas, n = 47; processes, n = 1,178; saline (Sal): somas, n = 40; processes, n = 931. Data are presented as the mean ± s.e.m.; *P < 0.05, ****P < 0.0001 (two-tailed Mann–Whitney U test; d, ****P < 0.0001; e, ****P < 0.0001; f, *P = 0.049, ****P < 0.0001). g, Schematic for two-photon Ca2+ imaging with local application of P2Y12 agonist (2MeSADP). hk, Similar to cf, but for local infusion of 2MeSADP or ACSF (2MeSADP, n = 25; ACSF, n = 22; from 5 mice: 3 female and 2 male). Dashed line, time of drug application. Each circle indicates data from one cell. 2MeSADP: somas, n = 25; processes, n = 581; ACSF: somas, n = 22; processes, n = 469. Data are shown as mean ± s.e.m.; ***P < 0.001, ****P < 0.0001 (i, two-tailed Mann–Whitney U test, ****P < 0.0001; j, unpaired two-tailed t-test, ***P = 0.0003; k, unpaired two-tailed t-test, ***P = 0.0001). Source data
Fig. 3
Fig. 3. Effect of microglia Gi activation on sleep depends on increased intracellular Ca2+.
a, Schematic for two-photon Ca2+ imaging with p130PH or p130PHR134L expression. b, Confocal images of p130PH–mCherry expression in Iba1+P2Y12+ microglia in the prefrontal cortex. Scale bar, 50 μm. c, z-scored Ca2+ activity averaged across all microglia imaged from mice expressing p130PH (CNO, n = 44; saline, n = 31; from 5 mice: 3 female and 2 male) or p130PHR134L (CNO, n = 32; saline, n = 29; from 5 mice: 2 female and 3 male). Dashed line, time of injection. df, Population summary of the CNO-induced change in mean Ca2+ level (d) and the amplitude (e) and frequency (f) of Ca2+ events in soma and processes (difference between before and after injection) in mice expressing p130PH or p130PHR134L. Each circle indicates data from one cell. p130PHCNO: n = 44 somas, n = 789 processes; p130PHsaline: n = 31 somas, n = 457 processes; p130PHR134LCNO: n = 32 somas, n = 595 processes; p130PHR134Lsaline: n = 29 somas, n = 564 processes. **P < 0.01, ****P < 0.0001 (one-way ANOVA with Holm–Šídák’s test; d, P < 0.0001, ****P < 0.0001; e, Psoma = 0.65, Pprocesses < 0.0001, ****P < 0.0001; f, Psoma = 0.50, Pprocesses < 0.0001, ***P = 0.0007, ****P < 0.0001, **P = 0.0024). g,h, Effect of microglia Gi activation on sleep in mice expressing p130PHR134L (g; n = 8 mice: 4 female and 4 male) or p130PH (h; n = 8 mice: 3 female and 5 male). *P < 0.05, **P < 0.01 (two-way ANOVA with Bonferroni correction; p130PHR134L: NREM: Ptreatment < 0.0001, Ptime < 0.0001, *P0.5h = 0.038, **P1h = 0.0036; wake: Ptreatment = 0.0002, Ptime < 0.0001, *P0.5h = 0.044, **P1h = 0.0051, *P1.5h = 0.019; REM: Ptreatment = 0.036, Ptime < 0.0001; p130PH: NREM: Ptreatment = 0.94, Ptime < 0.0001; wake: Ptreatment = 0.95, Ptime < 0.0001; REM: Ptreatment = 0.97, Ptime < 0.0001). i, Changes in each brain state induced by chemogenetic activation (difference between CNO and saline injections, averaged across 3 h after injection) in mice expressing p130PHR134L or p130PH. Each circle indicates data from one mouse (p130PHR134L, n = 8 mice; p130PH, n = 8 mice). **P < 0.01 (unpaired two-tailed t-test, **PNREM = 0.0055, **Pwake = 0.0082). Data are presented as the mean ± s.e.m. Source data
Fig. 4
Fig. 4. Modulation of microglia Ca2+ by brain state and NE.
a, An example Ca2+ imaging session. Top left, field of view containing multiple microglia (scale bar, 50 μm); bottom left, high-magnification view of the microglia soma and processes in the white box (scale bar, 10 μm); five ROIs in processes are outlined, whose Ca2+ traces are shown on the right together with the EEG spectrogram (normalized by the maximum of each session), EMG amplitude and brain states. b, Summary of microglia Ca2+ activity during wake and NREM states. Each line presents data from one cell (n = 87 cells, from 5 mice: 3 female and 2 male; two-tailed Wilcoxon signed rank test, ****P < 0.0001). c, Ca2+ activity at brain-state transitions (n = 87 cells). Dashed line, time of transition; shading, ±s.e.m. d, Imaging of NE signals. Top left, schematic for two-photon imaging of GRABNE2m fluorescence in the prefrontal cortex; bottom left, field of view (scale bar, 50 μm); right, NE traces of ROIs indicated in bottom-left image. e, Average NE signals in wake and NREM states. Each line represents data from one session (n = 30 sessions, from 14 mice: 6 female and 8 male; a total of 8–12 ROIs were assessed for each session; two-tailed Wilcoxon signed rank test, ****P < 0.0001). f, Similar to c, but for NE signals (averaged across 30 sessions). g, Schematic of microglia Ca2+ imaging with local application of NE receptor antagonist. h, Microglia Ca2+ before and after application of ICl (β2 receptor antagonist), phentolamine (Phen; α receptor antagonist) and propranolol (Prop; β receptor antagonist), or ACSF, averaged across 31 (ICl), 29 (Phen + Prop) or 22 (ACSF) cells from 5 mice: 3 female and 2 male. Dashed line, time of drug application. ik, Difference in mean Ca2+ level (i) and the amplitude (j) and frequency (k) of Ca2+ events before and after drug application. Each circle indicates data from one cell. ICl: n = 31 somas, n = 660 processes; Phen + Prop: n = 29 somas, n = 674 processes; ACSF: n = 22 somas; n = 441 processes. *P < 0.05, ****P < 0.0001 (one-way ANOVA with Holm–Šídák’s test; i, P < 0.0001, ****P < 0.0001; j, Psoma = 0.10, Pprocesses = 0.045, *PPhen+Prop = 0.0495, *PICl = 0.0495; k, Psoma = 0.44, Pprocesses = 0.014, *PPhen+Prop = 0.018, *PICl = 0.011). Data are presented as the mean ± s.e.m. Source data
Fig. 5
Fig. 5. Activation of microglia Gi signaling suppresses NE transmission.
a, Schematic of GRABNE2m imaging in the prefrontal cortex. b, Example imaging session with chemogenetic Gi activation in microglia. Left, field of view (scale bar, 50 μm); five ROIs are outlined, whose NE traces are shown on the right. Dashed line, time of CNO or saline injection. c, Effect of chemogenetic Gi activation in microglia on NE signals averaged across 13 (saline) or 14 (CNO) sessions from 5 mice: 3 female and 2 male. A total of 8–12 ROIs were assessed for each session. The dashed line indicates the time of injection. d, Difference in NE before and after (20–120 min) saline or CNO injection. Each circle represents data from one session (saline, n = 13 sessions; CNO, n = 14 sessions; from 5 mice). Data are presented as the mean ± s.e.m.; *P < 0.05 (unpaired two-tailed t-test, *P = 0.041). e, Schematic of GRABNE2m imaging with local application of P2Y12 agonist or antagonist. f, NE traces from example imaging sessions with ACSF (i), 2MeSADP (ii) or PSB0739 (iii) application. The dashed line indicates the time of drug application. g,h, Similar to c,d for local drug application experiments (e); 2MeSADP, n = 8 sessions; PSB0739, n = 7 sessions; ACSF, n = 10 sessions; from 4 mice: 2 female and 2 male. The dashed line indicates the time of drug application. *P < 0.05, ***P < 0.001 (one-way ANOVA with Holm–Šídák’s test, P = 0.0002; ACSF versus 2MeSADP, *P = 0.012; ACSF versus PSB0739, *P = 0.026; 2MeSADP versus PSB0739, ***P = 0.0001; the Δz-score was computed as the difference between the periods [−20, 0] and [40, 60] min). Data are presented as the mean ± s.e.m. Source data
Fig. 6
Fig. 6. Suppression of NE transmission by microglia Gi signaling is partly mediated by elevated adenosine level.
a, Example images of Iba1-labeled microglia (green; left) and TH-labeled axons (red; middle left) in the prefrontal cortex. Middle right, three-dimensional (3D) rendering image of a 50-μm-thick slice (scale bar, 20 μm); top right, high-magnification view of the boxed region (scale bar, 5 μm); bottom right, further enlarged view of the region in the dashed box and automatically detected axon boutons (magenta) (scale bar, 2 μm). b, Distance of boutons to the nearest microglia (n = 140,884 boutons from the prefrontal cortex of 3 mice). c, Schematic of GRABADO imaging in the prefrontal cortex. d, Example imaging session with chemogenetic Gi activation in microglia. Left, field of view (scale bar, 50 μm); five ROIs are outlined, whose adenosine traces are shown on the right. Dashed line, time of CNO or saline injection. e, Effect of chemogenetic Gi activation in microglia on adenosine signals averaged across 20 (saline) or 19 (CNO) sessions from 6 mice. A total of 8–12 ROIs were assessed for each session. The dashed line indicates the time of injection. f, Difference in adenosine before and after saline or CNO injection. Each circle represents data from one session (saline, n = 20 sessions; CNO, n = 19 sessions; from 6 mice). Data are presented as the mean ± s.e.m.; ***P < 0.001 (unpaired two-tailed t-test, ***P = 0.0005). g,h, Extracellular NE levels before and after application of 2-CADO (a metabolically stable analog of adenosine). The dashed line indicates the time of application. Each circle indicates data from one session. 2-CADO, n = 11 sessions; ACSF, n = 11 sessions; from 4 mice. Data are presented as the mean ± s.e.m.; ***P < 0.001 (unpaired two-tailed t-test, ***P = 0.0001; the Δz-score was computed as the difference between the periods [−20, 0] and [40, 60] min). i, Diagram summarizing microglia regulation of sleep through reciprocal interactions between microglia Ca2+ signaling and NE transmission. Data are presented as the mean ± s.e.m. Source data
Extended Data Fig. 1
Extended Data Fig. 1. Specificity and efficiency of Gi-DREADD expression in microglia in Tmem119-CreERT2; R26-LSL-Gi-DREADD mice.
a, Confocal images from multiple brain regions showing hM4Di (Gi-DREADD) expression (detected by an HA-tag antibody) in Iba1+ cells. White box in left panel, region enlarged on the right. Scale bar, 50 μm. PFC, prefrontal cortex; BF, basal forebrain; CPu, caudate putamen; Thal, thalamus; Hypo, hypothalamus; SNr, substantia nigra pars reticulata; PAG, periaqueductal gray. b, Quantification of efficiency and specificity (n = 3 mice; quantification in Fig. 1b includes all brain regions shown here). ‘Overlap’ refers to cells expressing both HA and Iba1. c, Confocal images from the prefrontal cortex showing TMEM119 and Iba1 expression. Scale bar, 50 μm. d, Quantification of TMEM119 and Iba1 colocalization in multiple brain regions (n = 3 mice). ‘Overlap’ refers to cells expressing both TMEM119 and Iba1 (although Iba1 can also label infiltrating macrophages, under the condition of this study it shows ~100% overlap with TMEM119 in brain parenchyma). Source data
Extended Data Fig. 2
Extended Data Fig. 2. Effect of Gi-DREADD activation on sleep in female and male mice, early light phase, dark phase, EEG power spectra within each state, and control experiments in mice without Gi-DREADD.
a, b, Summary of chemogenetic experiment, analyzed separately for female and male mice. Shown are the percentages of time in each brain state following CNO and saline injection (mean ± s.e.m.; a, n = 3 mice; two-way ANOVA with Bonferroni correction; NREM: Ptreatment = 0.015; Ptime < 0.0001; *P1h = 0.017; **P1.5h = 0.0089; Wake: Ptreatment = 0.016; Ptime < 0.0001; *P1.5h = 0.015; REM: Ptreatment = 0.36; Ptime < 0.0001; b, n = 5 mice; two-way ANOVA with Bonferroni correction; NREM: Ptreatment = 0.0001; Ptime < 0.0001; **P1h = 0.0057; Wake: Ptreatment = 0.0002; Ptime < 0.0001; **P1h = 0.0092; REM: Ptreatment = 0.21; Ptime < 0.0001). c, Summary of chemogenetic experiment performed between Zeitgeber time (ZT) 1 (8:00 am) and ZT6 (1:00 pm) (mean ± s.e.m.; n = 8 mice: 4 female and 4 male; two-way ANOVA with Bonferroni correction; NREM: Ptreatment = 0.0004; Ptime < 0.0001; *P1h = 0.032; **P2.5h = 0.0014; Wake: Ptreatment = 0.0007; Ptime < 0.0001; ***P2.5h = 0.0002; REM: Ptreatment = 0.40; Ptime < 0.0001; *P2.5h = 0.047). d, Percentage of time in each brain state within 3 h after CNO or saline injection. Each circle indicates data from one mouse (mean ± s.e.m.; n = 8 mice). ***P < 0.001 (paired two-tailed t-test; ***PNREM = 0.0005; ***PWake = 0.0006). e, f, Mean episode duration (e) and episode number per hour (f) for each brain state within 3 h after CNO or saline injection. Each circle indicates data from one mouse (mean ± s.e.m.; n = 8 mice). *P < 0.05, **P < 0.01, ***P < 0.001 (paired two-tailed t-test; e, ***PNREM = 0.0003; f, **PNREM = 0.0099; *PWake = 0.010). g, Summary of chemogenetic experiment in dark phase (beginning at ~8:00 pm). Shown are the percentages of time in each brain state following CNO and saline injection (mean ± s.e.m.; n = 8 mice; two-way ANOVA with Bonferroni correction; NREM: Ptreatment = 0.020; Ptime = 0.012; *P0.5h = 0.016; Wake: Ptreatment = 0.040; Ptime = 0.0039; *P0.5h = 0.014; REM: Ptreatment = 0.89; Ptime < 0.0001). h, Percentage of time in each brain state within 3 h after CNO or saline injection. Each circle indicates data from one mouse (mean ± s.e.m.; n = 8 mice). **P < 0.01 (two-tailed Wilcoxon signed rank test; **PNREM = 0.0078; **PWake = 0.0078). i, j, Mean episode duration (i) and episode number per hour (j) for each brain state within 3 h after CNO or saline injection. Each circle indicates data from one mouse (mean ± s.e.m.; n = 8 mice). **P < 0.01, ***P < 0.001, ****P < 0.0001 (i, paired two-tailed t-test, ****P < 0.0001; j, paired two-tailed t-test; ***PNREM = 0.0010; ***PWake = 0.0012). k, l, Comparison of normalized EEG power spectra within each brain state between saline and CNO sessions during the light phase (k) or dark phase (l), averaged across 8 mice. Shading, ± s.e.m. The EEG spectra of each session was normalized by the total power between 0 and 25 Hz before averaging. m, Percentages of time in each brain state following CNO or saline injection in Tmem119-CreERT2 control mice without Gi-DREADD expression (mean ± s.e.m.; n = 6 mice). n, Changes in each brain state induced by chemogenetic manipulation (difference between CNO and saline injections, averaged across 3-h after injection) in mice without Gi-DREADD (control) or with Gi-DREADD (treatment during light phase (ZT1 – ZT6 and ZT6 – ZT11) or dark phase). Each circle indicates data from one mouse (Control, n = 6 mice; ZT1-ZT6, n = 8 mice; ZT6-ZT11, n = 8 mice; dark phase, n = 8 mice); error bar: ± s.e.m. *P < 0.05, **P < 0.01, ***P < 0.001 (One-way ANOVA with Holm-Šídák’s test; NREM, P = 0.0005; **PZT1-ZT6 = 0.0034; ***PZT6-ZT11 = 0.0007; **Pdark = 0.0013; Wake, P = 0.002; *PZT1-ZT6 = 0.019; **PZT6-ZT11 = 0.0020; **Pdark = 0.0064; REM, P = 0.49). Source data
Extended Data Fig. 3
Extended Data Fig. 3. Effect of P2Y12 agonist on sleep, control experiments for Ca2+ imaging in mice without Gi-DREADD, comparison of microglia Ca2+ activity before and after CNO-induced Gi activation within each brain state, and Ca2+ activity during baseline period.
a-c, Percentage of time (a), mean episode duration (b), and episode number per hour (c) for each brain state within 2 h after i.c.v. infusion of P2Y12 agonist (2MeSADP) or ACSF. Each circle indicates data from one mouse; error bar: ± s.e.m. (n = 9 mice). *P < 0.05, **P < 0.01 (a, two-tailed Wilcoxon signed rank test, *P = 0.039; b, paired two-tailed t-test, **P = 0.0030; c, paired two-tailed t-test; NREM, *P = 0.012; Wake, *P = 0.015). d, Schematic for two-photon (2 P) Ca2+ imaging in head-fixed mice without Gi-DREADD expression. e, Z-scored Ca2+ activity averaged across all microglia (CNO: n = 25; saline: n = 28; from 4 mice). Dashed line, time of injection. f, Population summary of the change in mean Ca2+ level. g, Diagram illustrating the comparison of Ca2+ activity before and after CNO or saline injection within each brain state. First, Ca2+ activity in NREM or wakeful episodes are averaged separately for before and after injection; second, the difference between the averaged Ca2+ activity before and after injection are calculated for each brain state. h, CNO-induced change in microglia Ca2+ for each brain state (difference between before and after injection). CNO, n = 47; saline: n = 40; from 5 mice. Bars, mean ± s.e.m. (two-tailed Mann-Whitney U test; NREM, ****P < 0.0001; Wake, ****P < 0.0001). i, j, Amplitude (i) and frequency (j) of Ca2+ events during baseline period (before saline or CNO injection). CNO: n = 47; saline: n = 40; from 5 mice. Data are presented as mean ± s.e.m. Source data
Extended Data Fig. 4
Extended Data Fig. 4. Efficiency and specificity of p130PH-mCherry expression in microglia.
a, Confocal images of p130PH-mCherry expression in Iba1 + , P2Y12+ microglia in multiple brain regions. White box in left panel, region enlarged on the right. Scale bar: left, 100 μm; right, 50 μm. PFC, prefrontal cortex; BF, basal forebrain; CPu, caudate putamen; Thal, thalamus; Hypo, hypothalamus; SNr, substantia nigra pars reticulata; PAG, periaqueductal gray. b, Quantification of efficiency and specificity. Bars, mean ± s.e.m. (n = 3 mice). ‘Overlap’ refers to cells expressing both p130PH-mCherry and Iba1. Source data
Extended Data Fig. 5
Extended Data Fig. 5. Effects of Gi-DREADD activation in mice expressing p130PHR134L or p130PH and effect of Gq-DREADD activation on microglia Ca2+ and sleep.
a, b, Mean episode duration (a) and episode number per hour (b) for each brain state within 3 h after CNO or saline injection in mice expressing p130PHR134L. Each circle indicates data from one mouse; bars: mean ± s.e.m. (n = 8 mice). *P < 0.05, **P < 0.01 (paired two-tailed t-test; a, **P = 0.0021; b, *PNREM = 0.045; *PWake = 0.046). c, d, Similar to (a, b), but for mice expressing p130PH (n = 8 mice). e, Example imaging sessions with CNO and saline injection in mice expressing GCaMP6s and Gq-DREADD in microglia. Left, representative microglia (scale bar, 10 μm); 4 ROIs in microglia processes are outlined, whose Ca2+ traces are shown on the right. Dashed line, time of injection. f, Schematic for chemogenetic experiment with Gq-DREADD mice. g, Percentages of time in each brain state following CNO or saline injection (top, CNO: 0.2 mg/kg; bottom, CNO: 1 mg/kg; mean ± s.e.m.; n = 6 mice). *P < 0.05, **P < 0.01, ***P < 0.001, ****P < 0.0001 (two-way ANOVA with Bonferroni correction; top, NREM: Ptreatment < 0.0001; Ptime < 0.0001; *P0.5h = 0.015; **P1h = 0.0063; Wake: Ptreatment = 0.0043; Ptime < 0.0001; REM: Ptreatment = 0.78; Ptime < 0.0001; bottom, NREM: Ptreatment < 0.0001; Ptime < 0.0001; **P0.5h = 0.0011; **P1h = 0.0031; **P1.5h = 0.0012; *P3.5h = 0.019; Wake: Ptreatment = 0.0002; Ptime < 0.0001; *P0.5h = 0.012; REM: Ptreatment = 0.0002; Ptime < 0.0001; ****P1h < 0.0001; ***P1.5h = 0.0002). h-j, Percentage of time (h), mean episode duration (i) and episode number per hour (j) for each brain state within 3 h after CNO or saline injection. Each circle indicates data from one mouse, bars: mean ± s.e.m. (n = 6 mice). *P < 0.05, **P < 0.01, ***P < 0.001 (One-way ANOVA with Holm-Šídák’s test; h, NREM, P = 0.0029; **P = 0.0025; ***P = 0.0009; Wake, P = 0.0037; **P0.2mg/kg = 0.0072; **P1mg/kg = 0.0039; REM, P = 0.0011; *P1mg/kg = 0.011; *P0.2 vs. 1mg/kg = 0.011; i, NREM, P = 0.55; Wake, P = 0.003; *P0.2mg/kg = 0.028; **P1mg/kg = 0.0025; * P0.2 vs. 1mg/kg = 0.028; REM, P = 0.028; j, NREM, P = 0.074; Wake, P = 0.083; REM, P = 0.013; *P1mg/kg = 0.041; **P0.2 vs. 1mg/kg = 0.041). Source data
Extended Data Fig. 6
Extended Data Fig. 6. Ca2+ imaging sessions with episodes of wakefulness, NREM sleep, and REM sleep, control experiment for 2 P imaging with Ca2+-independent GFP, GRABNE expression, effect of adrenergic receptor antagonists on sleep, and comparison of cortical NE activity before and after microglia manipulations within the same brain state.
a, Two examples of Ca2+ imaging session. Top left, field of view containing multiple microglia (scale bar, 50 μm); Bottom left, high magnification view of the microglia soma and processes in the white box (scale bar, 10 μm); 5 ROIs in processes are outlined, whose Ca2+ traces are shown on the right together with EEG spectrogram (Freq., frequency), EMG amplitude (Ampl.), and color-coded brain states. b, An example 2 P imaging session with GFP showing consistent decrease in fluorescence during REM sleep. Top, EEG spectrogram (Freq., frequency); middle, EMG amplitude (Ampl.); bottom, GFP signal (from a Cx3cr1eGFP/+ mouse) and color-coded brain states. c, Image showing the expression of the GRABNE2m in the prefrontal cortex. Scale bar, 100 μm. d-f, Percentage of time (d), mean episode duration (e), and episode number per hour (f) within 3 h after i.c.v. infusion of Phen (α receptor antagonist) and Prop (β receptor antagonist), ICl (β2 receptor antagonist), or ACSF. Each circle indicates data from one mouse; bars, mean ± s.e.m.; n = 6 mice. *P < 0.05, **P < 0.01 (One-way ANOVA with Holm-Šídák’s test; d, NREM, P = 0.0058; ACSF vs. Phen+Prop, **P = 0.0037; ACSF vs. ICl, *P = 0.017; Wake, P = 0.023; ACSF vs. Phen+Prop, *P = 0.010; REM, P = 0.37; e, NREM, P = 0.037; ACSF vs. ICl, **P = 0.0012; Wake, P = 0.42; REM, P = 0.18; f, NREM, P = 0.053; Wake, P = 0.048; REM, P = 0.72;). g, Change of NE activity in each brain state induced by chemogenetic activation of microglia Gi signaling (difference between before (-40 – 0 min) and after (0 – 120 min) injection) (mean ± s.e.m., saline, n = 13 sessions, CNO, n = 14; from 5 mice; 8 to 12 ROIs were assessed for each session). *P < 0.05 (unpaired two-tailed t-test, *P = 0.033). h, Similar to (g), but for local perfusion experiments (difference between before (-20 – 0 min) and after (40 min – 60 min) drug perfusion) (mean ± s.e.m.; 2MeSADP, n = 8 sessions; PSB, n = 7; ACSF, n = 10, from 4 mice; 8 to 12 ROIs were assessed for each session). *P < 0.05, **P < 0.01, ***P < 0.001 (One-way ANOVA with Holm-Šídák’s test; NREM, P = 0.002; ACSF vs. PSB, *P = 0.034; 2MeSADP vs. PSB, **P = 0.0015; Wake, P = 0.001; ACSF vs. 2MeSADP, *P = 0.033; ACSF vs. PSB, *P = 0.046; 2MeSADP vs. PSB, ***P = 0.0007). Source data
Extended Data Fig. 7
Extended Data Fig. 7. Distance of adrenergic axon boutons to microglia, GRABADO expression, and effect of local Gi-DREADD activation on sleep.
a, Example images of Iba1-labeled microglia (magenta) and Dbh-eYFP-labeled axons (cyan) in prefrontal cortex. Left and top right, 3D rendering images of a 50-μm-thick slice; scale bar, 20 μm; middle right, high-magnification view of the boxed region; scale bar, 5 μm; bottom right, further enlarged view of the region in dashed box and automatically detected axon buttons (yellow); scale bar, 2 μm. b, Percentage of buttons within 2 μm from the nearest microglia. Bars, mean ± s.e.m. Each circle represents data from one mouse (n = 3 mice; black circle, TH-labeled axon boutons detected by immunohistochemistry; cyan circle, Dbh-eYFP-labeled boutons). Dist., distance. c, Image showing the expression of the GRABADO in the prefrontal cortex. Scale bar, 100 μm. d, e, Coronal diagram (d) and image (e) showing local infusion site in the prefrontal cortex of Tmem119-CreERT2; R26-LSL-Gi-DREADD mice. Scale bar, 200 μm. f-h, Percentage of time (f), mean episode duration (g), and episode number per hour (h) for each brain state within 2.5 h after CNO or ACSF infusion. Each circle indicates data from one mouse (mean ± s.e.m.; n = 5 mice). *P < 0.05, **P < 0.01 (f, paired two-tailed t-test, *P = 0.024; g, paired two-tailed t-test, *P = 0.022; h, paired two-tailed t-test; NREM, *P = 0.016; Wake, *P = 0.020). i-m, Similar to (d-h), but for basal forebrain infusion (n = 5 mice; k, paired two-tailed t-test; NREM, **P = 0.0067; Wake, **P = 0.0028; REM, **P = 0.0025; l, paired two-tailed t-test, *P = 0.030; m, paired two-tailed t-test, *P = 0.020). n-r, Similar to (d-h), but for dorsal striatum infusion (n = 4 mice). Source data

Similar articles

Cited by

References

    1. Watson BO, Levenstein D, Greene JP, Gelinas JN, Buzsaki G. Network homeostasis and state dynamics of neocortical sleep. Neuron. 2016;90:839–852. - PMC - PubMed
    1. Tononi G, Cirelli C. Sleep and the price of plasticity: from synaptic and cellular homeostasis to memory consolidation and integration. Neuron. 2014;81:12–34. - PMC - PubMed
    1. Xie L, et al. Sleep drives metabolite clearance from the adult brain. Science. 2013;342:373–377. - PMC - PubMed
    1. Holth JK, et al. The sleep-wake cycle regulates brain interstitial fluid tau in mice and CSF tau in humans. Science. 2019;363:880–884. - PMC - PubMed
    1. Colonna M, Butovsky O. Microglia function in the central nervous system during health and neurodegeneration. Annu. Rev. Immunol. 2017;35:441–468. - PMC - PubMed