. 2024 Jan 18;14(1):1623.
doi: 10.1038/s41598-024-52085-5.

Cell cycle specific, differentially tagged ribosomal proteins to measure phase specific transcriptomes from asynchronously cycling cells

Affiliations

Cell cycle specific, differentially tagged ribosomal proteins to measure phase specific transcriptomes from asynchronously cycling cells

Jesse D Cochran et al. Sci Rep. .

Abstract

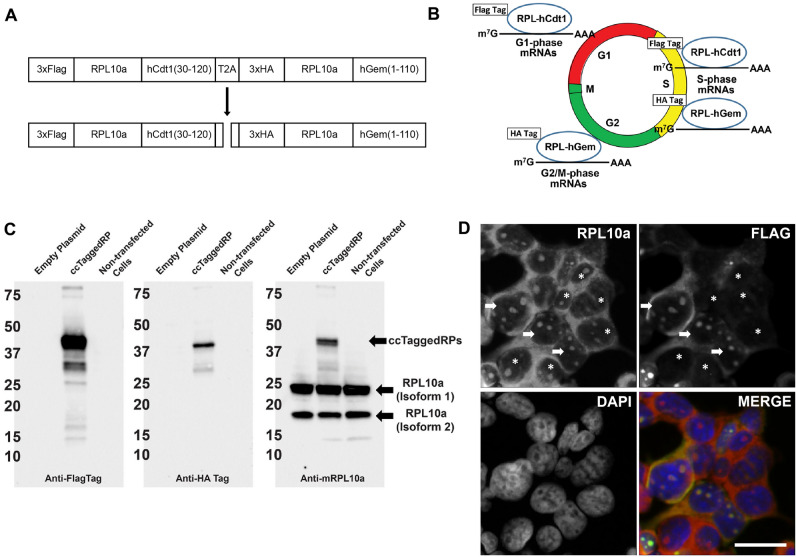
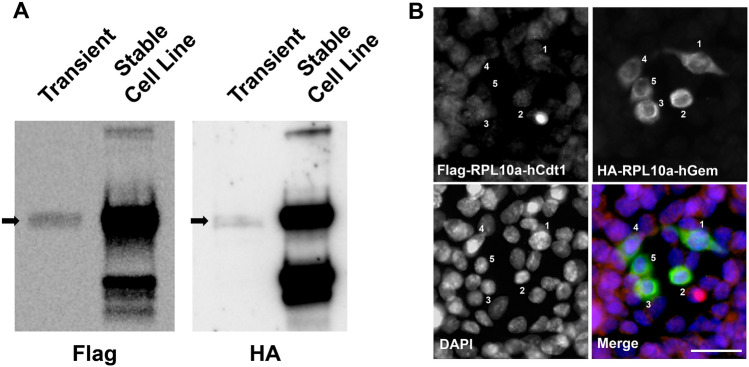
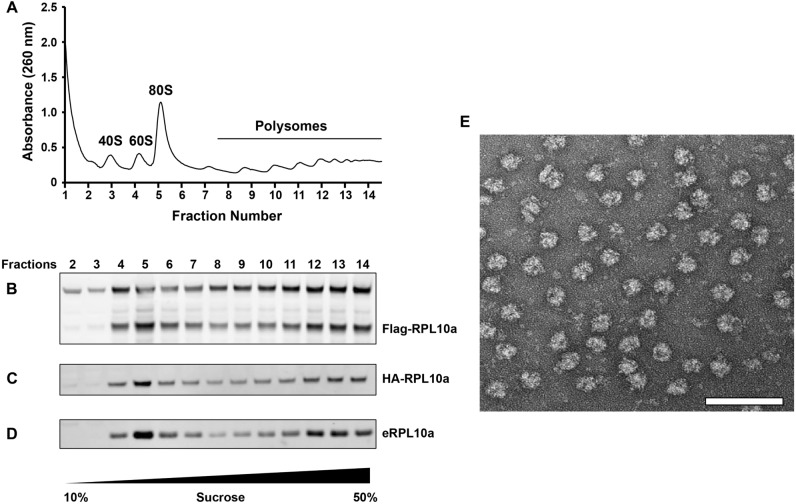
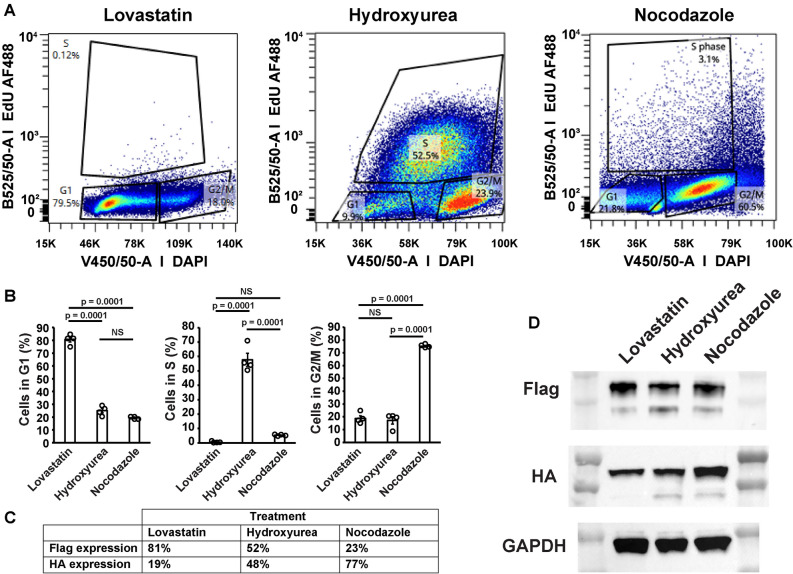
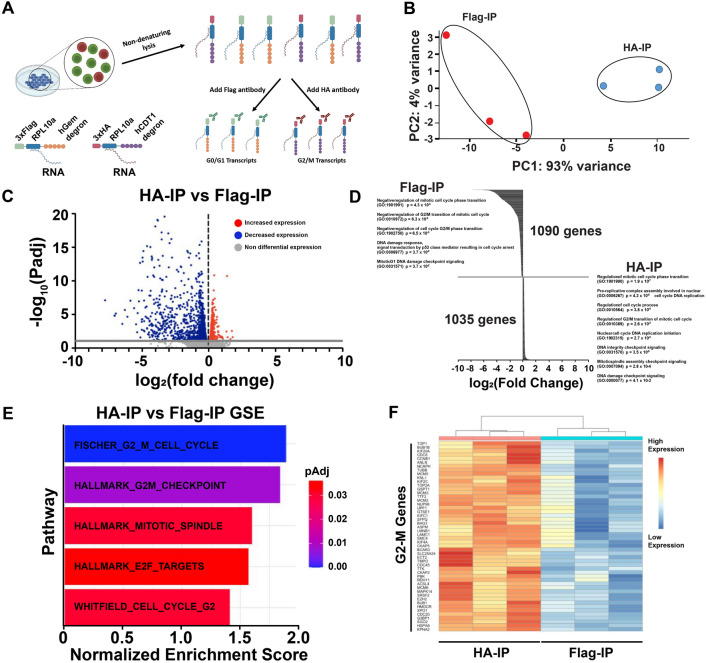
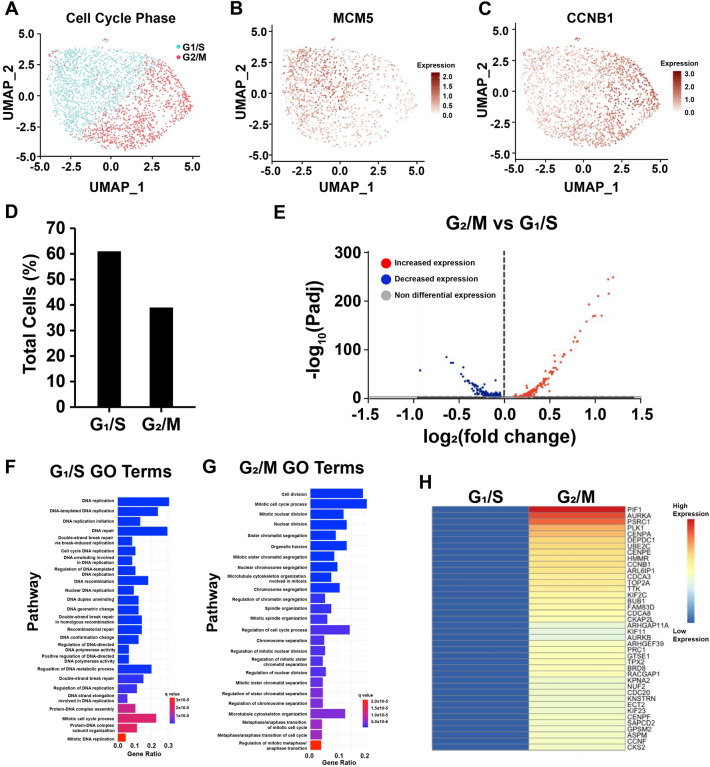
Asynchronously cycling cells pose a challenge to the accurate characterization of phase-specific gene expression. Current strategies, including RNAseq, survey the steady state gene expression across the cell cycle and are inherently limited by their inability to resolve dynamic gene regulatory networks. Single cell RNAseq (scRNAseq) can identify different cell cycle transcriptomes if enough cycling cells are present, however some cells are not amenable to scRNAseq. Therefore, we merged two powerful strategies, the CDT1 and GMNN degrons used in Fluorescent Ubiquitination-based Cell Cycle Indicator (FUCCI) cell cycle sensors and the ribosomal protein epitope tagging used in RiboTrap/Tag technologies to isolate cell cycle phase-specific mRNA for sequencing. The resulting cell cycle dependent, tagged ribosomal proteins (ccTaggedRP) were differentially expressed during the cell cycle, had similar subcellular locations as endogenous ribosomal proteins, incorporated into ribosomes and polysomes, and facilitated the recovery of cell cycle phase-specific RNA for sequencing. ccTaggedRP has broad applications to investigate phase-specific gene expression in complex cell populations.


Conflict of interest statement

The authors declare no competing interests.

Figures

Figure 1
Figure 1
ccTaggedRPs are differentially expressed during the cell cycle and have similar subcellular locations as endogenous ribosomal proteins. (A) Schematic of the CAG-3xFlagTag-RPL10a-hCdt(30–120)-T2A-3xHA-Tag-RPL10a-hGeminin(1–110) construct and cleavage at the T2A site. (B) Schematic of the predicted change in 3xFlagTag-RPL10a-hCdt(30–120) and 3xHA-Tag-RPL10a-hGeminin(1–110) during the cell cycle. (C) Immunoblots of asynchronously cycling HEK293-T cells transiently transfected with empty plasmid, ccTaggedRP, or not transfected. Blots were probed with antibodies against Flag Tag, HA Tag, or mRPL10a. Bands corresponding to Flag recombinant protein, HA recombinant protein, and endogenous RPL10a isoforms are denoted by arrows. See Supplemental Fig. 6 for uncut blots. (D) Immunofluorescence of asynchronously cycling HEK293-T cells transiently transfected with ccTaggedRP stained for RPL10a and Flag Tag. Cells expressing ccTaggedRP are denoted by arrows. Cells not expressing ccTaggedRP are denoted by asterisks. DAPI was used to stain for nuclear DNA. DAPI is blue, RPL10a is red, and FLAG is green. Scale bars are included in the lower right corner and correspond to 10 μm.
Figure 2
Figure 2
(A) Immunoblots of asynchronously cycling HEK293-T cells transiently transfected with ccTaggedRP and HEK293-T-FlpIn cells stably expressing ccTaggedRP probed with antibodies to Flag Tag or HA Tag. See Supplemental Fig. 7 for uncut blots. (B) Immunofluorescence of HEK293-T-FlpIn cells expressing ccTaggedRPs showing anti-Flag and anti-HA antibody statins, and DAPI. A merged image is shown. Cells denoted 1, 2, 3 and 4 express Flag-RPL10a-hCdt and HA-RPL10a-hGem, cell denote 5 expressed HA-RPL10a-hGem alone. All other cells express Flag-RPL10a-hCdt alone. Scale bar in the lower right corner corresponds to 20 μm.
Figure 3
Figure 3
Ribosome analysis using sucrose gradient centrifugation of lysates from HEK293T-FlpIN cells stably expressing ccTaggedRPs. (A) Absorbance at 260 nm (A260) was measured during fractionation and showed distinct peaks corresponding to 40S and 60S subunits, 80S ribosomes, and polysomes. (B–D) Western blots corresponding to fractions from the sucrose gradient in panel A, using anti-Flag tag (B), anti-HA tag (C), and anti-RPL10a (denoted eRPL10a) (D) antibodies. (E) Negative stain electron microscopy showed enrichment of 80S ribosomes from fraction #5 of the corresponding A260 peak for 80S ribosomes. Scale bar is 100 nm. See Supplemental Fig. 9 for uncropped blots. Recombinant Flag-RPL10a-hCdt and HA-RPL10a-hGem were detected in fractions corresponding to the 60S ribosomal subunits, 80S ribosomes, and polysomes.
Figure 4
Figure 4
The expression of Flag-RPL10a-hCdt and HA-RPL10a-hGem is dependent on the phase of the cell cycle. (A) FACS quantitation of HEK293-T-Flp-In cells stably expressing ccTaggedRPs in G1, S, and G2/M treated with after synchronization with Lovastatin, Hydroxyurea or Nocodazole. The percentage of cells in G1, S, and G2/M under each treatment is shown. B525/50-A EdU AF488 represents EdU intensity and V450/50-A DAPI represents DNA content. These measurements were used to gate cells in G1, S, and G2M. (B) Quantitation of G1, S, and G2/M of cells treated with Lovastatin, Hydroxyurea, or Nocodazole. Values are mean ± SEM. P-values were calculated by ANOVA with Tukey test for multiple comparisons. N = 4 plates per condition. (C) Predicted relative expression of Flag and HA based on the results shown in panel B. (D) Western blots of Flag-RPL10a-hCdt (top), HA-RPL10a-hGem (middle), and GAPDH (bottom) corresponding to the cells treated with Lovastatin, Hydroxyurea, or Nocodazole and analyzed by FACS in panel A. See Supplemental Fig. 10 for uncropped blots.
Figure 5
Figure 5
ccTaggedRP identifies genes expressed during G2-M in asynchronously cycling cells. (A) Schematic of the immunoprecipitation of 3xFlagTag-RPL10a-hCdt(30–120) and 3xHA-Tag-RPL10a-hGeminin(1–110) for the purification and sequencing of RNA from asynchronously cycling HEK293-T-Flp-In cells expressing ccTaggedRP. (B) Principal component analysis (PCA) plot of RNA sequencing of mRNAs from immunoprecipitated Flag recombinant protein (red dots) and HA recombinant protein (blue dots). (C) Volcano plot of RNA sequencing of mRNAs from immunoprecipitated Flag recombinant protein and HA recombinant protein. The gray line denotes an adjusted p-value of 0.05. Genes with increased and decreased expression are denoted by red and blue dots, respectively. (D) Waterfall plot of the 1090 genes enriched in the 3xFlagTag-RPL10a-hCdt(30–120) and 1035 genes enriched in the 3xHA-Tag-RPL10a-hGeminin(1–110) immunoprecipitated samples. GO Terms are denoted with adjusted p-values shown. (E) Gene set enrichment (GSE) analysis of RNAseq of mRNAs from immunoprecipitated Flag recombinant protein and HA recombinant protein. Adjusted p-vales are shown. (F) Heat map of the expression of the top 50 G2-M genes from mRNAs from immunoprecipitated Flag recombinant protein and HA recombinant protein.
Figure 6
Figure 6
scRNAseq of HEK293-T cells identifies populations of G1-S and G2-M. (A) UMAP of cells assigned to G1/S and G2/M identity in HEK293-T cell culture. (B,C) UMAP of MCM5 and CCNB1 expression. (D) Percentage of total cells assigned to G1/S and G2/M identities. (E) Volcano plot of differential gene expression between G1/S and G2/M clusters. (F,G) Gene Ontology results via hypergeometric testing of genes enriched in the G1/S cluster and G2/M cluster. (H) Heat map of the average expression for the top 40 G2/M genes between the G1/S and G2/M clusters.

Similar articles

Cited by

References

    1. Barres BA, Silverstein BE, Corey DP, Chun LL. Immunological, morphological, and electrophysiological variation among retinal ganglion cells purified by panning. Neuron. 1988;1(9):791–803. - PubMed
    1. Heiman M, Schaefer A, Gong S, Peterson JD, Day M, Ramsey KE, et al. A translational profiling approach for the molecular characterization of CNS cell types. Cell. 2008;135(4):738–748. - PMC - PubMed
    1. Sanz E, Yang L, Su T, Morris DR, McKnight GS, Amieux PS. Cell-type-specific isolation of ribosome-associated mRNA from complex tissues. Proc. Natl. Acad. Sci. USA. 2009;106(33):13939–13944. - PMC - PubMed
    1. Zhou P, Zhang Y, Ma Q, Gu F, Day DS, He A, et al. Interrogating translational efficiency and lineage-specific transcriptomes using ribosome affinity purification. Proc. Natl. Acad. Sci. USA. 2013;110(38):15395–15400. - PMC - PubMed
    1. Cleary MD, Meiering CD, Jan E, Guymon R, Boothroyd JC. Biosynthetic labeling of RNA with uracil phosphoribosyltransferase allows cell-specific microarray analysis of mRNA synthesis and decay. Nat. Biotechnol. 2005;23(2):232–237. - PubMed