. 2024 Dec;42(12):1909-1920.
doi: 10.1038/s41587-023-02109-8. Epub 2024 Jan 18.

KARR-seq reveals cellular higher-order RNA structures and RNA-RNA interactions

Affiliations

KARR-seq reveals cellular higher-order RNA structures and RNA-RNA interactions

Tong Wu et al. Nat Biotechnol. 2024 Dec.

Abstract

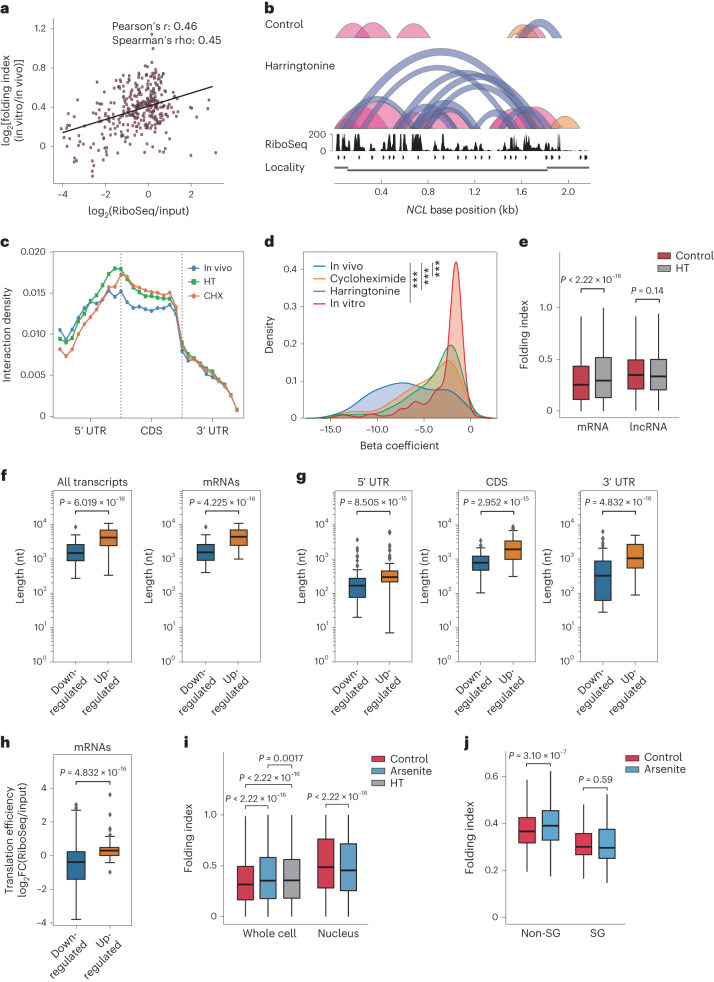
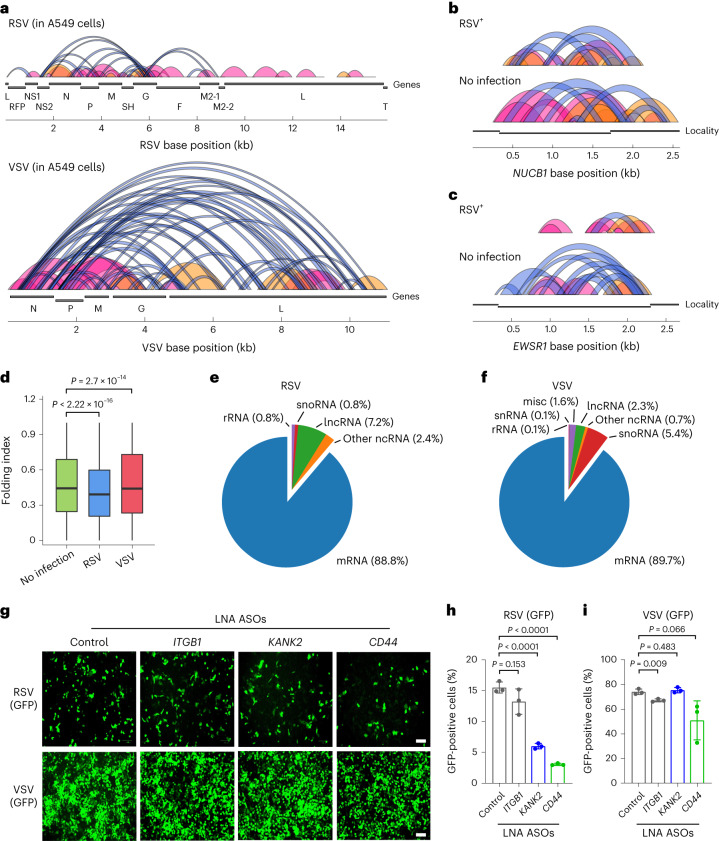
RNA fate and function are affected by their structures and interactomes. However, how RNA and RNA-binding proteins (RBPs) assemble into higher-order structures and how RNA molecules may interact with each other to facilitate functions remain largely unknown. Here we present KARR-seq, which uses N3-kethoxal labeling and multifunctional chemical crosslinkers to covalently trap and determine RNA-RNA interactions and higher-order RNA structures inside cells, independent of local protein binding to RNA. KARR-seq depicts higher-order RNA structure and detects widespread intermolecular RNA-RNA interactions with high sensitivity and accuracy. Using KARR-seq, we show that translation represses mRNA compaction under native and stress conditions. We determined the higher-order RNA structures of respiratory syncytial virus (RSV) and vesicular stomatitis virus (VSV) and identified RNA-RNA interactions between the viruses and the host RNAs that potentially regulate viral replication.


Conflict of interest statement

Competing interests: The University of Chicago has filed a patent application on KARR-seq. C.H. is a scientific founder, a member of the scientific advisory board and an equity holder of Aferna Green, Inc. and AccuaDX, Inc., and is a scientific co-founder and equity holder of Accent Therapeutics, Inc. T.W. is an equity holder of AccuaDX, Inc. The other authors declare no competing interests.

Figures

Fig. 1
Fig. 1. KARR-seq maps higher-order RNA structures.
a, KARR-seq workflow. Cells are first treated with N3-kethoxal to modify RNAs with azide tags (red), which enables crosslinking of the tagged RNA molecules by DBCO-decorated dendrimers (blue). Biotin modifications (pink) on dendrimers facilitate the enrichment of crosslinking products, followed by proximity ligation, RNA library construction and sequencing. Chimeric sequencing reads are aligned to identify RNA–RNA interactions. b, Physical distances between interacting fragments of TERC in K562 cells, measured by KARR-seq data generated using G1 and G7 dendrimers, respectively. The physical distances were measured using the cryo-EM structure of TERC. The actual physical distance distribution in the cryo-EM structure is shown in blue for comparison. c, Illustration of loop and stripe structures detected by KARR-seq. In arc groups, loops, left stripes and right stripes are denoted in blue, yellow and pink, respectively. Corresponding KARR-seq chimeric reads are displayed below. d, The KARR-seq interaction maps and arc groups for the Eef1g (EEF1G) transcript in mESCs (left) and HepG2 cells (right). e, The simulated physical distance map of the human EEF1G transcript. For bd, KARR-seq was performed in two biological replicates.
Fig. 2
Fig. 2. Benchmarking KARR-seq, RIC-seq and PARIS.
a, Average Pearson correlation between the interaction maps of KARR-seq (K562 and HEK293T cells), RIC-seq (HeLa cells) and PARIS (HEK293T cells). b, MFE for RNA–RNA interactions detected using KARR-seq, PARIS and RIC-seq within TERC and U1 transcripts, respectively. Interactions were grouped into ‘secondary’, ‘tertiary’ and ‘novel’. ‘Secondary’ refers to the interactions that match secondary structure prediction. ‘Tertiary’ refers to spatially proximal RNA regions revealed by the cryo-EM structure that do not correspond to secondary structures. ‘Novel’ refers to interactions that are not supported by secondary structures or cryo-EM structures. c, Circos plots showing the RNA–RNA interaction landscape revealed by KARR-seq, PARIS and RIC-seq. The width of the link between two RNA categories indicates the relative abundance of chimeric reads taken by interactions between these two categories. d, Left, the physical distance map of TERC revealed by the cryo-EM structure of TERC. Right, higher-order structures of TERC detected by KARR-seq, PARIS and RIC-seq under the same sequencing depth. The blue dots denote base-pairing secondary structures acquired from the Rfam annotations (RF00024). e, The ROC–AUC curves for KARR-seq, RIC-seq and PARIS for detecting higher-order structures of TERC, 18S, 28S and U3. The dashed lines denote random classifiers. RIC-seq and PARIS data were acquired from the Gene Expression Omnibus (RIC-seq: GSE127188; PARIS: GSE74353). Cryo-EM structures were acquired from the Protein Data Bank (accession codes: 7QXB for TERC, 6QX9 for U3 and 4V6X for 18S and 28S). KARR-seq was performed in two biological replicates.
Fig. 3
Fig. 3. Translation suppresses mRNA higher-order structures under native and stress conditions.
a, The effect of ribosome binding on RNA–RNA interactions in HepG2 cells. The x axis denotes ribosome binding strength, and the y axis shows the folding index difference between in vitro and in vivo. b, KARR-seq arc groups for the NCL transcript in control and harringtonine-treated HepG2 cells. Folding index: 0.246 for control and 0.290 for harringtonine. c, Metagene plot showing the relative abundance of intermolecular mRNA interactions under denoted conditions. CHX, cycloheximide; HT, harringtonine. d, The transcriptome-wide distribution of beta coefficients under denoted conditions. *** indicates P < 0.001. e, Folding index for mRNA and lncRNA in control and harringtonine-treated HepG2 cells. f, The length of transcripts that exhibit upregulated and downregulated intramolecular interactions after arsenite treatment in K562 cells. g, The 5′ UTR, CDS and 3′ UTR length for mRNAs that exhibit upregulated and downregulated intramolecular interactions after arsenite treatment in K562 cells. h, The translation efficiency under the normal condition for mRNAs that exhibit upregulated and downregulated intramolecular interactions after arsenite treatment in K562 cells. In fh, for the analysis of all transcripts, n = 104 transcripts for the downregulated group and n = 73 transcripts for the upregulated group. For the analysis of mRNAs, n = 102 transcripts for the downregulated group and n = 68 transcripts for the upregulated group. i, mRNA folding index in control, arsenite-treated and harringtonine-treated K562 cells and purified K562 nuclei. n refers to the number of chimeric read level folding index. n = 440,484 for whole cell control, n = 242,268 for whole cell arsenite, n = 251,601 for whole cell HT, n = 154,797 for nuclear control and n = 162,507 for nuclear arsenite. j, mRNA folding index for SG-localized transcripts and other (non-SG) transcripts in control and arsenite-treated K562 cells. n = 161 transcripts in the non-SG group and n = 215 transcripts in the SG group. For fh, P values were calculated by the one-sided Mann–Whitney test. For e,i,j, P values were calculated by the two-sided Mann–Whitney test. In box plots shown in eh, the lower and the upper bounds denote 25th and 75th percentiles, respectively. The minima denote the lower bound −1.5× IQR. The maxima denote the upper bound +1.5× IQR. KARR-seq was performed in two biological replicates. IQR, interquartile range.
Fig. 4
Fig. 4. KARR-seq identifies functional RNA–RNA interactions between diverse RNA categories.
a, The landscape of intermolecular RNA–RNA interactions revealed by KARR-seq in K562 cells (left) and K562 nucleus (right). The width of the link between two RNA categories denotes the relative abundance of chimeric reads taken by interactions between these two categories. mRNA–rRNA interactions, which are primarily a result of translation, were excluded from the plots. b, Interactions between C/D box snoRNA and 18S in K562 cells. Previously identified interaction sites are shown in pink. Interaction sites identified by KARR-seq are shown in green. c, Snapshots of KARR-seq data revealing SNORD25–18S and SNORD65–18S interactions. Regions colored in green denote identified interaction regions. The dashed lines denote previously known 2′ OMe modification sites. d, Scheme showing the organization and processing of human pre-rRNA 5′ ETS. e, Top, KARR-seq reads density for interactions between U3 and 5′ ETS in K562 cells (human) and mESCs (mouse). Bottom, KARR-seq interaction maps showing the higher-order structures of 5′ ETS in the corresponding cell lines. Stem loops are enclosed in black squares. f, Relative pre-rRNA levels in K562 cells treated by ASO that blocks a U3 interaction site at the 5′ ETS. Two sets of primers amplifying A′ and A0-proximal regions were applied for qPCR, respectively. Data are mean ± s.d. P values were calculated by Student’s t-test. n = 3 biological replicates. KARR-seq was performed in two biological replicates.
Fig. 5
Fig. 5. KARR-seq reveals viral RNA structures and virus–host RNA–RNA interactions.
a, Loop and stripe structures across the RSV (top) and VSV (bottom) RNAs in infected A549 cells. b,c, KARR-seq arc groups for the NUCB1 (b) and EWSR1 (c) transcripts in control and RSV-infected A549 cells. Folding index: 0.415 for NUCB1 after RSV infection, 0.527 for NUCB1 without infection, 0.411 for EWSR1 after RSV infection and 0.532 for EWSR1 without infection. d, RNA folding index in control, RSV-infected and VSV-infected A549 cells. n denotes the number of chimeric read level folding index. n = 1,772,734 for no infection, n = 596,451 for RSV and n = 159,725 for VSV. The lower and the upper bounds denote 25th and 75th percentiles, respectively. The minima denote the lower bound −1.5× IQR. The maxima denote the upper bound +1.5× IQR. P values were calculated by the two-sided Mann–Whitney test. e,f, The number of host RNAs from each RNA category that interact with RSV (e) and VSV (f) RNAs. g, Fluorescent imaging of GFP-tagged RSV and GFP-tagged VSV after cells were transfected with denoted LNA ASOs. These ASOs target mRNA transcripts at positions that interact with RSV RNA. Scale bar, 100 µm. h,i, The percentage of RSV-positive (h) and VSV-positive (i) cells quantified by flow cytometry after cells were treated with denoted LNA ASOs. Data are mean ± s.d. n = 3 biologically replicates. P values were calculated by two-tailed Student’s t-test. IQR, interquartile range.

References

    1. Hafner, M. et al. CLIP and complementary methods. Nat. Rev. Methods Primers1, 20 (2021).
    1. Ganser, L. R., Kelly, M. L., Herschlag, D. & Al-Hashimi, H. M. The roles of structural dynamics in the cellular functions of RNAs. Nat. Rev. Mol. Cell Biol.20, 474–489 (2019). - PMC - PubMed
    1. Engreitz, J. M. et al. RNA–RNA interactions enable specific targeting of noncoding RNAs to nascent pre-mRNAs and chromatin sites. Cell159, 188–199 (2014). - PMC - PubMed
    1. Lu, Z. et al. RNA duplex map in living cells reveals higher-order transcriptome structure. Cell165, 1267–1279 (2016). - PMC - PubMed
    1. Sharma, E., Sterne-Weiler, T., O’Hanlon, D. & Blencowe, B. J. Global mapping of human RNA–RNA interactions. Mol. Cell62, 618–626 (2016). - PubMed

LinkOut - more resources