

Cardiac output estimation using ballistocardiography: a feasibility study in healthy subjects
- PMID: 38238507
- PMCID: PMC10796317
- DOI: 10.1038/s41598-024-52300-3
Cardiac output estimation using ballistocardiography: a feasibility study in healthy subjects
Abstract
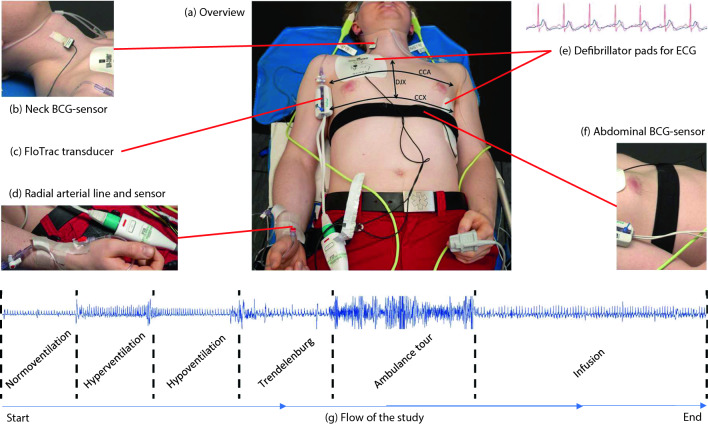
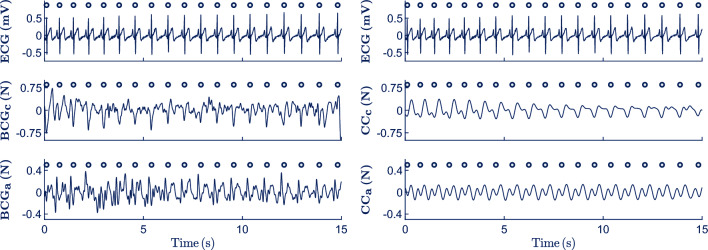
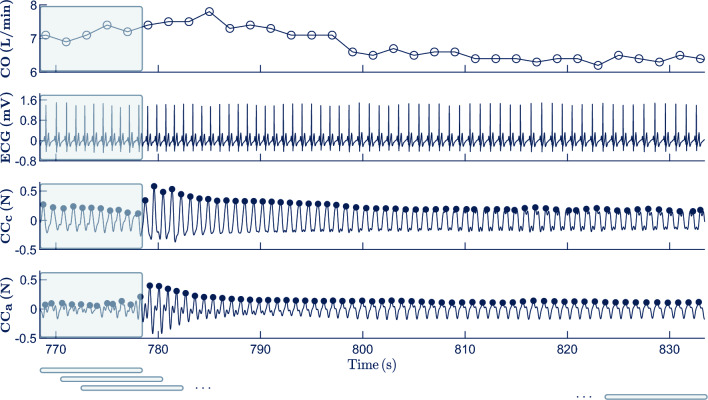
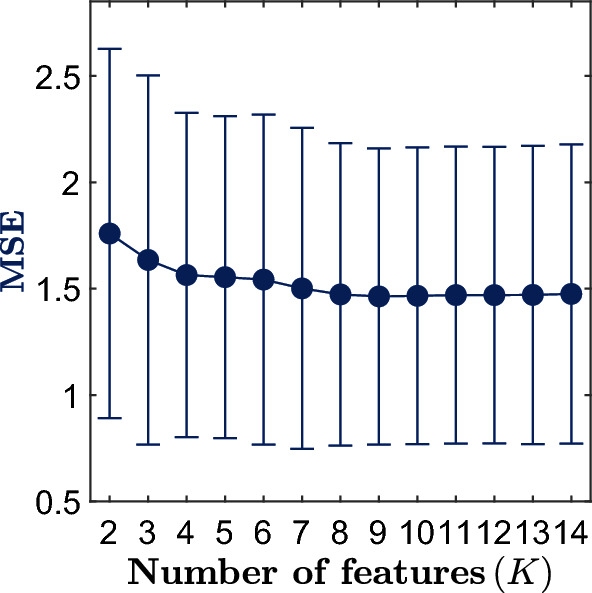
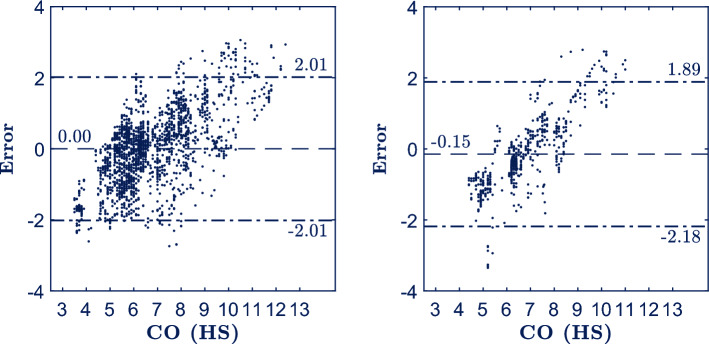
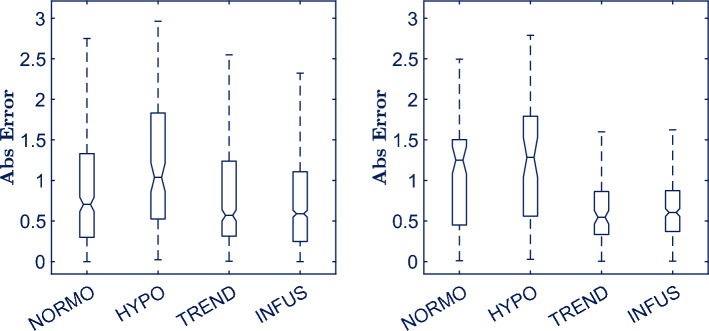
There is no reliable automated non-invasive solution for monitoring circulation and guiding treatment in prehospital emergency medicine. Cardiac output (CO) monitoring might provide a solution, but CO monitors are not feasible/practical in the prehospital setting. Non-invasive ballistocardiography (BCG) measures heart contractility and tracks CO changes. This study analyzed the feasibility of estimating CO using morphological features extracted from BCG signals. In 20 healthy subjects ECG, carotid/abdominal BCG, and invasive arterial blood pressure based CO were recorded. BCG signals were adaptively processed to isolate the circulatory component from carotid (CCc) and abdominal (CCa) BCG. Then, 66 features were computed on a beat-to-beat basis to characterize amplitude/duration/area/length of the fluctuation in CCc and CCa. Subjects' data were split into development set (75%) to select the best feature subset with which to build a machine learning model to estimate CO and validation set (25%) to evaluate model's performance. The model showed a mean absolute error, percentage error and 95% limits of agreement of 0.83 L/min, 30.2% and - 2.18-1.89 L/min respectively in the validation set. BCG showed potential to reliably estimate/track CO. This method is a promising first step towards an automated, non-invasive and reliable CO estimator that may be tested in prehospital emergencies.
© 2024. The Author(s).
Conflict of interest statement
L.W. is a member of Stryker Medical Advisory Board and has patents licenced to Stryker and Zoll. The rest of the authors have declared no conflicts of interest.
Figures
Similar articles
-
Non-invasive estimation of cardiovascular parameters using ballistocardiography.Annu Int Conf IEEE Eng Med Biol Soc. 2015 Aug;2015:1247-50. doi: 10.1109/EMBC.2015.7318593. Annu Int Conf IEEE Eng Med Biol Soc. 2015. PMID: 26736493
-
Unobtrusive Estimation of Cardiovascular Parameters with Limb Ballistocardiography.Sensors (Basel). 2019 Jul 1;19(13):2922. doi: 10.3390/s19132922. Sensors (Basel). 2019. PMID: 31266256 Free PMC article.
-
Non-contact assessment of cardiac physiology using FO-MVSS-based ballistocardiography: a promising approach for heart failure evaluation.Sci Rep. 2024 Feb 8;14(1):3269. doi: 10.1038/s41598-024-53464-8. Sci Rep. 2024. PMID: 38332169 Free PMC article.
-
Bed-Based Ballistocardiography: Dataset and Ability to Track Cardiovascular Parameters.Sensors (Basel). 2020 Dec 29;21(1):156. doi: 10.3390/s21010156. Sensors (Basel). 2020. PMID: 33383739 Free PMC article.
-
Estimation of cardiac output variations induced by hemodynamic interventions using multi-beat analysis of arterial waveform: a comparative off-line study with transesophageal Doppler method during non-cardiac surgery.J Clin Monit Comput. 2022 Apr;36(2):501-510. doi: 10.1007/s10877-021-00679-z. Epub 2021 Mar 9. J Clin Monit Comput. 2022. PMID: 33687601 Free PMC article. Review.
References
MeSH terms
LinkOut - more resources
Full Text Sources
