. 2024 Feb;25(2):294-306.
doi: 10.1038/s41590-023-01720-w. Epub 2024 Jan 18.

The transcriptional cofactor Tle3 reciprocally controls effector and central memory CD8+ T cell fates

Affiliations

The transcriptional cofactor Tle3 reciprocally controls effector and central memory CD8+ T cell fates

Xin Zhao et al. Nat Immunol. 2024 Feb.

Erratum in

Abstract

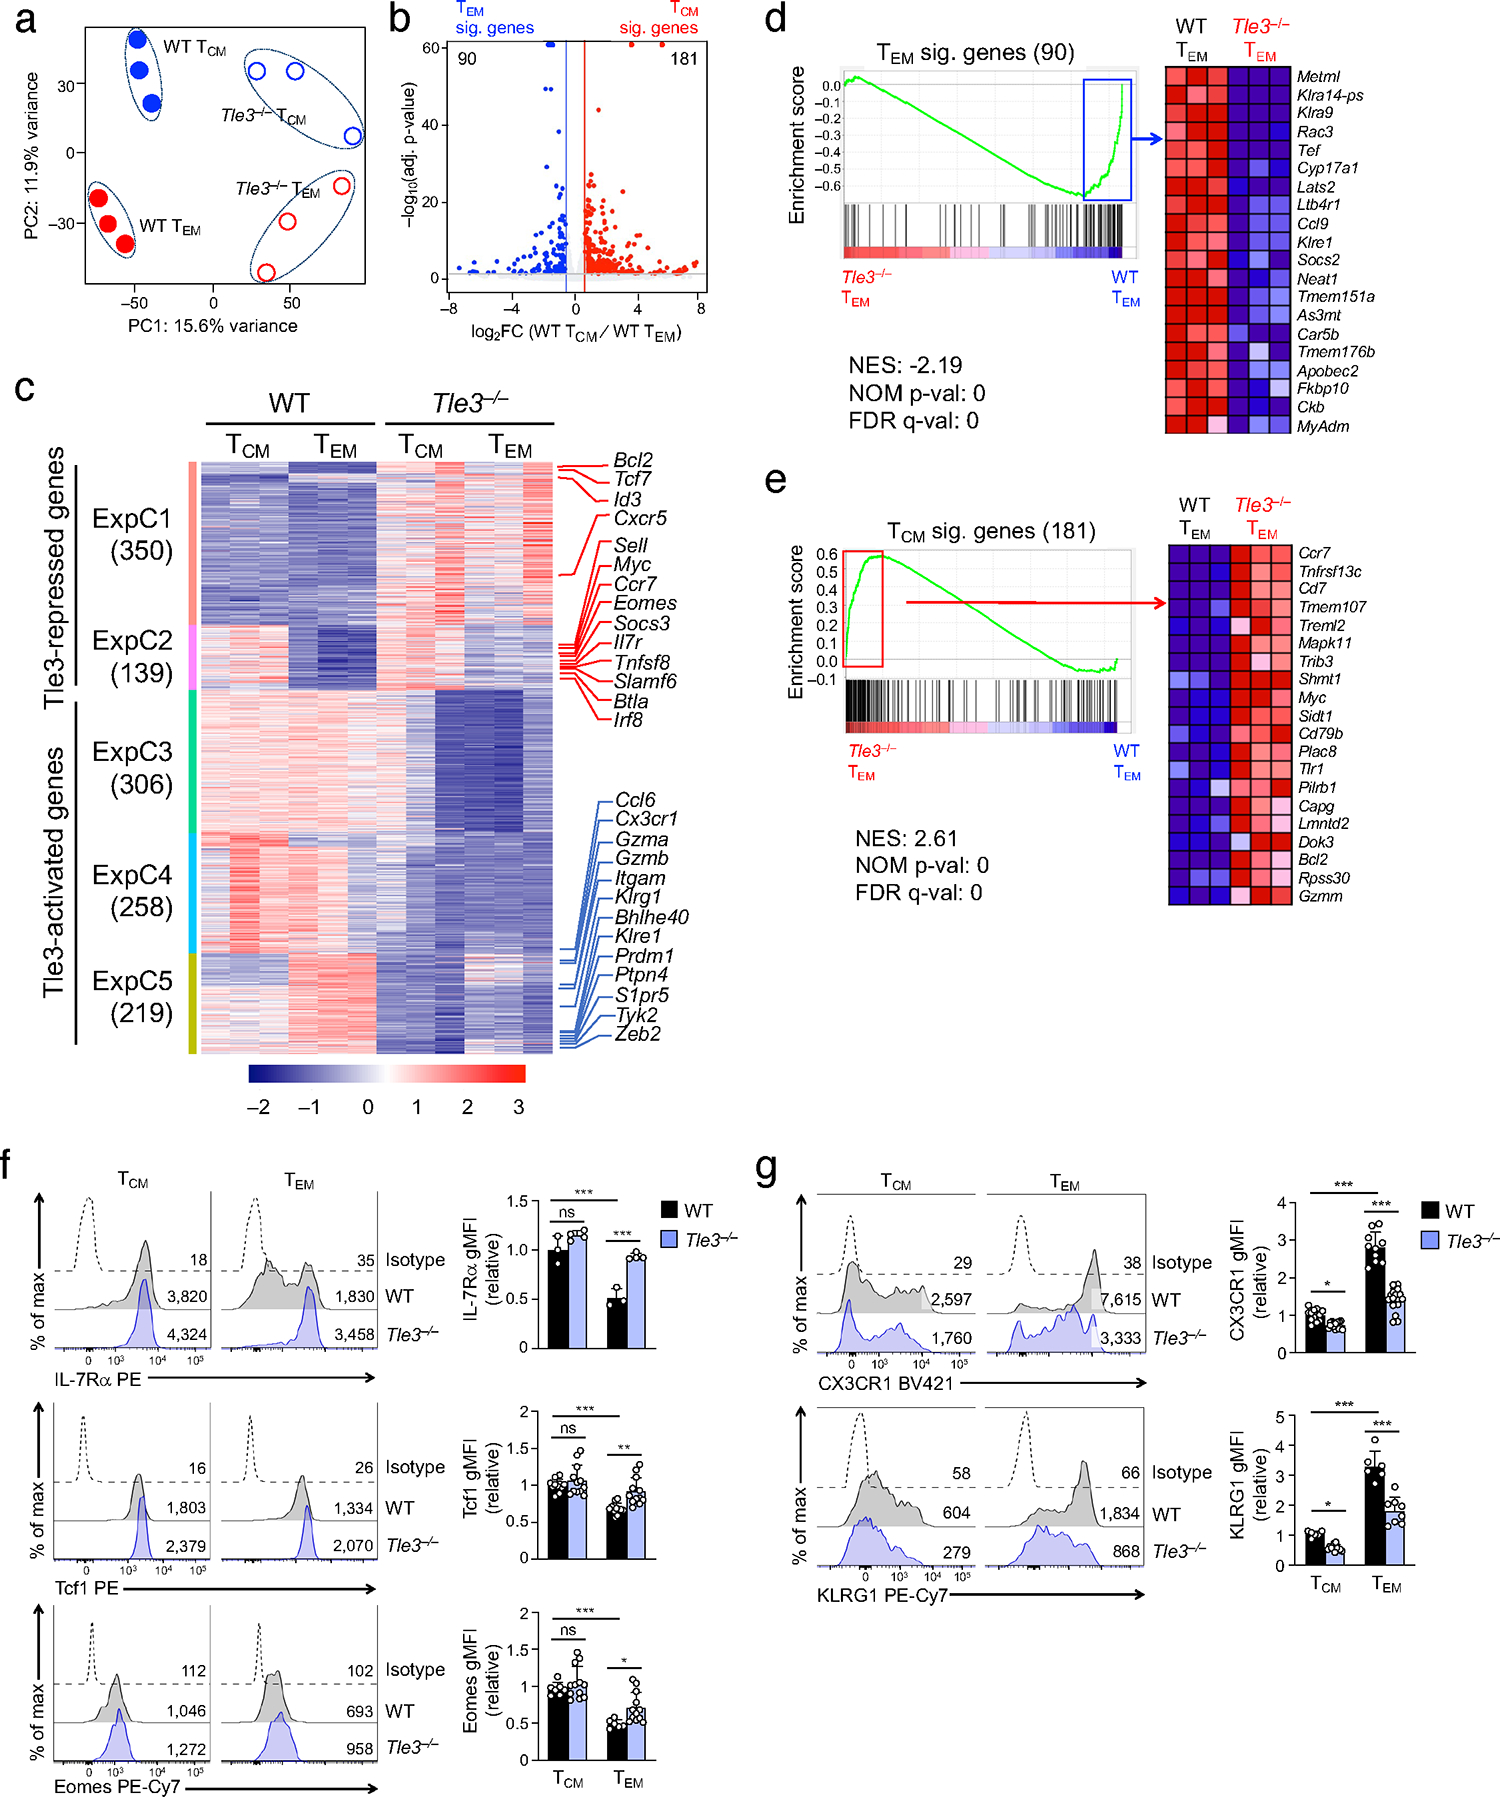
Antigen-experienced CD8+ T cells form effector and central memory T cells (TEM and TCM cells, respectively); however, the mechanism(s) controlling their lineage plasticity remains incompletely understood. Here we show that the transcription cofactor Tle3 critically regulates TEM and TCM cell fates and lineage stability through dynamic redistribution in antigen-responding CD8+ T cell genome. Genetic ablation of Tle3 promoted CD8+ TCM cell formation at the expense of CD8+ TEM cells. Lineage tracing showed that Tle3-deficient CD8+ TEM cells underwent accelerated conversion into CD8+ TCM cells while retaining robust recall capacity. Tle3 acted as a coactivator for Tbet to increase chromatin opening at CD8+ TEM cell-characteristic sites and to activate CD8+ TEM cell signature gene transcription, while engaging Runx3 and Tcf1 to limit CD8+ TCM cell-characteristic molecular features. Thus, Tle3 integrated functions of multiple transcription factors to guard lineage fidelity of CD8+ TEM cells, and manipulation of Tle3 activity could favor CD8+ TCM cell production.


Figures

Extended Data Figure 1.
Extended Data Figure 1.. Ablating Tle3 shows modest impact on the functions of antigen-responding CD8+ T cells without affecting viral clearance.
a. Gating stratey to identify CD45.2+ donor-derived P14 CD8+ T cells in CD45.1+ wild-type recipients. b. Detection of cytokine production in effector CD8+ T cells on 8 dpi. CD45.2+ wild-type or Tle3−/− naive CD8+ T cells were transferred into CD45.1+ wild-type recipients, which were infected with LCMV-Arm the next day, following experimental design in Fig. 1c. GP33-induced production of IFN-γ (top) and TNF-α (bottom) was detected in CD45.2+CD8+ T cells. Representative contour plots (left) are from 2 independent experiments, with values denoting percentages of the gated population. Cumulative data (right) of the percentage of IFN-γ+ population in P14 CD8+ T cells and the percentage of TNF-α+ populations in IFN-γ+ P14 CD8+ T cells are means ± s.d. c. Detection of granzyme B expression in effector CD8+ T cells by intracellular staining on 8 dpi. Representative histographs (left) are from 2 independent experiments, with the values denoting geometric mean fluorescence intensity (gMFI) of granzyme B. Cumulative data (left) are means ± s.d. ns, not statistically significant; *, p<0.05; ***, p<0.001 as determined with two-tailed Student’s t-test. d–f. Detection of LCMV in recipient sera. The serum samples were collected from recipients of WT or Tle3−/− CD8+ T cells at the indicated time points, and LCMV was detected with either quantitative RT-PCR (d) or plaque assays (e, f). Note that in the plaque assay, sera were serially diluted for the measurement as exemplifed for the 4 dpi samples (e), and plaque forming units (PFUs) at 1:10 dilution were plotted for all time points (f). g. Detection of TCM frequency at ≥30 dpi in the spleen (SP) and lymph nodes (LN) of CD45.1+ recipients where CD45.2+ Tle3−/− and CD45.1+ CD45.2+ WT P14 cells were mixed for co-transfer, followed by LCMV-Arm infection. Donor-derived TM cells were identified firstly by gating on CD45.2+ cells, in which CD45.1+ cells were from WT (black) while CD45.1GFP+ cells were from Tle3−/− (blue).
Extended Data Figure 2.
Extended Data Figure 2.. Targeting Tle3 promotes expression of TCM signature genes on the single cell level.
a. Volcano plot showing differential gene expression between the TCM and TEM1/2 clusters based on scRNA-seq analysis of WT memory CD8+ T cells. 96 TCM and 53 TEM signature genes were identified by the criteria of ≥1.5 expression changes and FDR<0.05. b. UMAP plots of WT and Tle3−/− cells displaying TCM and TEM scores for single cells. The scores for each cell were calcuated based on the expression of 96 TCM and 53 TEM signature genes defined in a, using Seurat’s “AddModuleScore” function. c. Scatter plots showing TCM and TEM scores for cells in each of the seven clusters as defined in Fig. 2e, with WT and Tle3−/− cells coded in distinct colors.
Extended Data Figure 3.
Extended Data Figure 3.. Targeting Tle3 promotes TCM- but diminishes TEM-chracteristic molecular features.
a. Phenotypic analysis of WT and Tle3−/− P14 TM cells at ≥30 dpi based on select cell surface markers. b. Gating strategy for cell sorting of WT and Tle3−/− TCM and TEM cells. c. Key comparisons for analysis of transcriptomic and ChrAcc changes in this study. d. Volcano plots showing DEGs between WT and Tle3−/− TEM cells (left) and those between WT and Tle3−/− TCM cells (right) by the criteria of ≥1.5-fold expression changes, FDR<0.05, and FPKM≥0.5 in the higher expression condition. Values in the plot denote DEG numbers in each pairwise comparison. e. Volcano plots showing differential ChrAcc sites between WT and Tle3−/− TEM cells (left) and those between WT and Tle3−/− TCM cells (right) by a more stringent criteria of ≥3-fold signal strength changes and FDR<0.05. Values in the plot denote numbers of differential ChrAcc sites in each pairwise comparison.
Extended Data Figure 4.
Extended Data Figure 4.. Differential Tle3 binding is associated with immune regulation during CD8+ T cell responses.
a. Principal component analysis (PCA) of Tle3 CUT&RUN libraries from WT TN, TEFF, TEM and TCM cells. b. Volcano plots showing differential Tle3 binding sites in comparisons of TEFF, TEM and TCM with TN cells, where stringent criteria (≥3-fold difference in binding strength, adjusted p value <0.05) were used to define dynamic Tle3 binding sites. Values in plots denote numbers of dynamic Tle3 binding sites in each comparison. c,e. Functional annotation of dynamic Tle3 binding sites in clusters 1 (c) and 3 (e) using GREAT analysis, with GO terms associated with immune regulation highlighted in orange. Values denote Hyper Observed Gene hits. d,f. Tle3 CUT&RUN sequencing tracks showing cluster 1 (d) or 3 (f) Tle3 binding sites at select genes as displayed on IGV, with the dynamic Tle3 binding sites marked with open bars and subcluster information labeled. IgG CUT&RUN in TN cells was used as a negative control. g. Detection frequency of dynamic Tle3 sites within +/–100 kb of TSS of DEGs in the five expression clusters defined in Fig. 3c. Values denote numbers of DEGs that are assocatied with dynamic Tle3 sites and those that are not (w/o). h. Distribution of DEG-associated dynamic Tle3 binding sites in genomic regions. From panel g, the DEGs associated with dynamic Tle3 peaks are divided into three categories, based on Tle3 site locations in promoters, distal regulatory regions, or both; and the values denote DEG numbers in each category.
Extended Data Figure 5.
Extended Data Figure 5.. Tle3 recruitment and stabilized binding require Runx3 and Tbet.
a. Stratification of less dynamic Tle3 binding sites with differential ChrAcc clusters as defined in Fig. 4c. Marked on the right are numbers and percentage of ChrAcc sites overlapping with less dynamic Tle3 binding peaks. b. De novo motif analysis of ChrAcc clusters 6–8 (Fig. 4c, Tle3-opened) that overlapped with “less dynamic” Tle3 binding sites. c. Principal component analysis (PCA) of Tle3 CUT&RUN sequencing libraries from WT and TRKO early TEFF cells isolated on 4 dpi. d. Venn diagram showing the overlap of Tle3 binding sites identified in WT and TbetKO TEFF cells. Tle3 CUT&RUN was performed on WT (4 replicates) and TbetKO (in 3 replicates) TEFF cells isolated on 6 dpi. Note that a single Tle3 binding site called in one cell type could overlap with more than one sites in the other, and therefore, the sum of common and uniquely identified Tle3 binding sites in the Venn diagram is not necessarily equal to the total site numbers called in a specific cell type. e. Boxplot showing the ratio of Tle3 binding strength in TbetKO to WT TEFF cells for Tle3 binding sites uniquely detected in each cell type. The box center lines denote the median, box edge denotes interquartile range (IQR), and whiskers denote the most extreme data points that are no more than 1.5 × IQR from the edge. f. Cumulative frequency plot showing differential Tle3 binding strength in WT versus TbetKO TEFF cells at the 3,380 Tbet/Runx-dependent Tle3 binding sites (defined in Fig. 5f). Statitistical significance of the observed difference was determined with two-sided paired MWU test. g. Sequencing tracks of Tle3 CUT&RUN in WT and TbetKO TEFF cells. Rectangles with solid lines denote differential Tle3 binding sites with TbetKO cells showing ≥1.25-fold decrease in binding strength with FDR<0.05, while those with dotted lines denote Tle3 binding sites indentifed in WT but not TbetKO TEFF cells by the same peak calling criteria.
Extended Data Figure 6.
Extended Data Figure 6.. Tle3 restrains chromatin opening at TCM signature ChrAcc sites via direct and indirect means.
a. De novo motif analysis of ChrAcc clusters 1–5 that overlapped with “TEFF-attenuated” Tle3 binding sites (within blue square in Fig. 4e). b. Venn diagram showing overlap of “TEFF-attenuated” Tle3 binding sites with Tcf1 binding sites in TN and Runx3 binding sites in TEFF cells at Tle3-closed TCM signature ChrAcc sites (from ChrAccC1–5 with red bars in Fig. 4c). c,d. Sequencing tracks of Tle3 binding (top), Tcf1 and Runx3 binding (bottom), and ChrAcc states (middle) at TCM-characteristic genes as displayed on IGV. Open bars denote colocalized “TEFF-attenuated” Tle3 binding peaks and Tle3-closed ChrAcc sites, with Tle3 binding subcluster information marked on the top. Bars with dotted lines at the Ccr7 (c), Tcf7, Sell and Id3 (d) gene loci mark dynamic Tle3 binding sites where the ChrAcc changes between WT and Tle3−/− TEM cells did not reach the stringent ≥3-fold differences, while bars with grey dotted lines at the Id3 gene locus (d) mark differential ChrAcc sites between WT and Tle3−/− TEM cells, which are associated with “less dynamic” Tle3 binding sites (the Tle3 binding strength did not show ≥3fold changes during CD8+ T cell responses). Statistical data in the comparison of the marked ChrAcc sites between WT and Tle3−/− TEM cells are shown for Tcf7, Sell and Id3 (d) genes under the tracks. e. Tle3-bound, Tle3-closed ChrAcc sites can contribute to positive gene regulation, as observed at the Il2ra gene locus. We posit that these Tle3-bound elements may have the potential to function as silencers, and the Tle3 binding likely maintains their inactive state, allowing their target genes to be expressed/induced in WT cells. Loss of Tle3 resulted in increased ChrAcc at these elements, unleashing the silencer activity and hence leading to target gene repression.
Extended Data Figure 7.
Extended Data Figure 7.. Induced deletion of Tle3 at the effector phase promotes TCM cell features without detectably affecting TM cell functions.
a–b. Detection of TCM (a) and TEM (b) characteristic proteins with flow cytometry. CreER+Tle3+/+ (WT) and CreER+Tle3FL/FL (Tle3DCreER) P14 cells were adoptively transferred, followed by LCMV-Arm infection. The recipients were treated with Tamoxifen on 6 and 7 dpi to achieve Tle3 deletion at the effector phase, and treated again on 21 dpi to sustain Tle3 deletion (as in Fig. 6d). At ≥35 dpi, donor-derived P14 memory CD8+ T cells in the recipient spleens were analyzed for TCM and TEM-characteristic proteins. Half-stacked histograms are representative data from at least 2 independent experiments with values denoting gMFI. Cumulative data for each protein are means ± s.d., with individual data points shown. c. Detection of cytokine production in GP33-stimulated TCM and TEM cells. Representative contour plots (left) are from 2 independent experiments, with values denoting percentages of the gated population. Cumulative data (right) of the percentage of IFN-γ+ population in P14 CD8+ T cells and the percentage of TNF-α+ populations in IFN-γ+ P14 CD8+ T cells are means ± s.d. For all panels, statistical significance for multiple group comparisons was first determined with one-way ANOVA, and Tukey’s test was used as post-hoc correction for indicated pair-wise comparison. *, p<0.05; **, p<0.01; ***, p<0.001; ns, not statistically significant.
Extended Data Figure 8.
Extended Data Figure 8.. Targetig Tle3 promotes TCM cell formation without compromising its recall capacity.
a. Experimental design for investigating the impact of acute deletion of Tle3 in ‘established’ TEM cells. b–g. Assessment of TCM recall response in B16 melanoma model. Note that WT and Tle3DCreER TCM cells were sort-purified following the study design in Fig. 6d. Data are from one of two independent experiments with similar results. b. Kaplan-Meier survival curves of recipient mice that received 5´104 P14+ TN, WT or Tle3DCreER TCM or TEM cells, followed by s.c. inoculation of B16-GP33 cells (2´105/mouse, n=8 for each type of recipients). *, p<0.05; ***, p<0.001; ns, not statistically significant for indicated pair-wise comparison. Statistically insignificant time points are unmarked for clarity. c. Tracking tumor growth in surviving recipient mice. *, p<0.05; **, p<0.01 for comparison between WT and Tle3DCreER TCM or TEM cells. d. Tumor size in recipients of WT or Tle3DCreER TCM cells that survived till day 33 after tumor inoculation, e–g. Analyses of tumor-infiltrating CD8+ lymphocytes (TILs) derived from WT or Tle3DCreER TCM cells in surviving recipients on day 33 after tumor inoculation, including cell counts (e), cell surface detection of Tim3 and PD-1 (f) and intracellular detection of granzyme B (g).
Figure 1.
Figure 1.. Targeting Tle3 favors generation of TCM cells.
a. Detection of antigen-specific CD8+ T cells in WT and Tle134−/− mice on 8 dpi with LCMV-Arm, using surrogate markers (top), GP33-tetramer (middle) and GP33 peptide-stimulated IFN-γ production (bottom). Shown in bar graphs are cumulative data on frequency of antigen-experienced CD8+ T cells or numbers of GP33-specific CD8+ T cells (right). b. Detection of Tle3 in TN and TEFF (8 dpi) with immunoblotting. Data are representative from two independent experiments. c. Experimental design. Naive P14 CD8+ T cells were adoptive transferred into CD45-disparate recipients at 2×10⁴ cells/recipient, followed by i.p. infection with LCMV-Arm and characterization of CD8+ T cells at the effector and memory stages. d. Numbers of WT and Tle3−/− P14 CD8+ T cells in recipient spleens at the effector (8 dpi) and memory (≥30 dpi) stages. e. Detection of WT and Tle3−/− TEFF and TMP subsets on 8 dpi, with cumulative data on TMP frequency in bar graph (right). f. Detecting cell viability of antigen-specific CD8+ T cells during the contraction phase on 14 dpi, with cumulative data on frequency of AnnexinV+ cells in bar graphs (right). g. Detection of WT and Tle3−/− TCM and TEM subsets at ≥30 dpi, with cumulative data on TCM frequency and numbers in bar graphs (right). h. Detection of GP33-induced cytokine production in TCM and TEM cells at ≥30 dpi. Cumulative data on the right show the frequency of IFN-γ-producing cells in CD45.2+ TCM and TEM cells (top), and that of TNF-α- and IL-2-producing cells in IFN-γ+ TCM and TEM cells (middle and bottom). i. Detection of granzyme B expression in TCM and TEM cells at ≥30 dpi. In each experiment, the average of geometric mean fluorescence intensity (gMFI) of granzyme B in WT TCM cells was set as 1, and the gMFI granzyme B in all cell types was normalized accordingly to obtain its relative expression, with cumulative data shown in bar graphs (bottom). Contour plots in a, e–h and half-stacked histograms in i are representative from 2–3 independent experiments, and all cumulative data are means ± s.d., with individual data points shown. *, p<0.05; **, p<0.01; ***, p<0.001; ns, not statistically significant by Student’s t-test.
Figure 2.
Figure 2.. Targeting Tle3 promote TCM formation on the single cell level.
a. UMAP plot of scRNA-seq data from WT memory P14 CD8+ T cells sorted on 30 dpi, with each dot representing a single cell. A total of four clusters were identified with Seurat and color-coded. b. Heatmap showing expression of 10 selected characteristic genes in TCM, TEM1/2 and Dock2-hi clusters as defined in a, with each column corresponding to a single cell. Color scale represents z-score transformed transcript levels. c. Single-cell transcript levels of TCM (top) and TEM (bottom) signature genes as displayed in the UMAP plot. The range of transcript levels is marked with individual color scale for each gene. d. Pseudotime analysis of WT memory P14 CD8+ T cells using Monocle v3, with the green line showing the trajectory of convergency of TEM1/2 to TCM cells. e–f. UMAP plots of scRNA-seq data from WT and Tle3−/− memory P14 CD8+ T cells (30 dpi). Displayed in e are seven clusters identified with Seurat, and displayed in f are cells of different genotypes. g. Distribution of WT and Tle3−/− cells in each cluster defined in e. h. Violin plots showing transcript levels of TCM and TEM signature genes in each cluster defined in e.
Figure 3.
Figure 3.. Targeting Tle3 promotes TCM but diminishes TEM signature gene expression.
a. Principal component analysis (PCA) of RNA-seq libraries from WT and Tle3−/− TCM and TEM cells (≥30 dpi). b. Volcano plot showing DEGs between WT TCM and WT TEM cells based on bulk RNA-seq data by the criteria of ≥1.5-fold expression changes, FDR<0.05, and FPKM≥0.5 in the higher expression condition. Values in the plot denote numbers of TCM and TEM signature genes. c. Heatmap showing the impact of Tle3 deficiency on TCM and TEM transcriptomes. DEGs were identified in comparison between WT and Tle3−/− TCM and between WT and Tle3−/− TEM cells, and were distributed into 5 major expression clusters (ExpC) with K-means clustering analysis. Values in parentheses denote gene numbers in each cluster, and select TCM and TEM signature genes are marked, as indicated with red and blue lines, respectively. d–e. Enrichment plots of TEM (d) and TCM (e) signature gene sets (defined in b) in comparison of Tle3−/− vs. WT TEM cell transcriptomes with GSEA. NES, normalized enrichment score; NOM P val, nominal P values. In d, 48 of 90 TEM signature genes are in the leading edge showing enrichment in WT TEM cells. In e, 104 of 181 TCM signature genes are in the leading edge showing enrichment in Tle3−/− TEM cells. f–g. Detection of TCM (f) and TEM (g) characteristic proteins with flow cytometry in WT and Tle3−/− TCM and TEM cells at ≥30 dpi. Half-stacked histograms are representative data from at least 2 independent experiments with values denoting geometric mean fluorescence intensity (gMFI), and cumulative data for each protein are means ± s.d., with individual data points shown. Statistical significance for these multiple group comparisons was first determined with one-way ANOVA, and Tukey’s test was used as post-hoc correction for indicated pair-wise comparison. *, p<0.05; **, p<0.01; ***, p<0.001; ns, not statistically significant.
Figure 4.
Figure 4.. Tle3 promotes TEM-characteristic open chromatin profile by acquiring novel binding sites.
a. Principal component analysis (PCA) of ATAC-seq libraries from WT and Tle3−/− TCM and TEM cells (≥30 dpi). b. Volcano plot showing differential ChrAcc sites between WT TCM and WT TEM cells by the criteria of ≥2-fold expression changes and FDR<0.05. Values in the plot denote numbers of TCM and TEM signature ChrAcc sites. c. Heatmap showing the impact of Tle3 deficiency on TCM and TEM ChrAcc landscape. Differential ChrAcc sites were identified in comparisons between WT and Tle3−/− TCM and between WT and Tle3−/− TEM cells, and distributed into 8 major ChrAcc clusters (ChrAccC) with K-means clustering analysis. Values in parentheses denote site numbers in each cluster, and also marked are the overlapping rates of each cluster with TCM and TEM signature ChrAcc sites (defined in b), as indicated with red and blue lines, respectively. d. Heatmaps showing three major Tle3 binding clusters and associated sub-clusters. Tle3 binding peaks were identified in TN, TEFF, TEM and TCM cells with CUT&RUN, and those with dynamic changes (≥ 3-fold change, FDR<0.05 in comparisons of TEFF, TEM and TCM with TN cells) were clustered based on Tle3 binding strength. Values in parentheses denote Tle3 peak numbers, and each row represents a Tle3 peak strength across different CD8+ T cell response stages after Z-score normalization, with all replicates shown. e. Correlation between ChrAcc and dynamic Tle3 binding changes. Diff. ChrAcc clusters (defined in c) were stratified against dynamic Tle3 binding clusters (defined in d), and the numbers of overlapping sites were indicated in each element. f. Sequencing tracks of Tle3 binding (upper panels) and ChrAcc states (lower panels) at TEM-characteristic genes as displayed on IGV. Open bars denote “TEFF-acquired” Tle3 binding peaks and Tle3-opened ChrAcc sites, with Tle3 binding subcluster information marked on the top.
Figure 5.
Figure 5.. Tle3 functions as a coactivator of Tbet to positively regulate TEM-characteristic molecular features.
a. De novo motif analysis of ChrAcc clusters 6–8 that overlapped with “TEFF-acquired” Tle3 binding sites (within red rectangle in Fig. 4e). b. Coimmunoprecipitation of FLAG-tagged Tbet and HA-tagged Tle3 after co-transfection into 293T cells. IP, immunoprecipitation; IB, immunoblotting. c. Coimmunoprecipitation of FLAG-tagged Tbet with endogenous Tle3 in primary TEFF cells (6 dpi) expressing retrovirally delivered FLAG-Tbet. Data in b and c are representative from two independent experiments. d. Venn diagram showing overlap of Tle3 binding sites with Runx3 and Tbet binding sites in effector CD8+ T cells as determined with CUT&RUN. e. Pie chart showing overlapping rates of “TEFF-acquired” Tle3 binding sites (TleC1a-d in Fig. 4d) with Tbet and Runx3 in effector CD8+ T cells. f. Volcano plot (left) showing differential Tle3 binding sites between WT and TRKO early TEFF cells isolated on 4 dpi, with values denoting site numbers. Tle3 binding strength of the Tbet/Runx3-dependent Tle3 binding sites in WT and TRKO cells is shown in heatmap (right). g. Sequencing tracks of Tle3 binding in WT and TRKO TEFF, Tbet and Runx3 binding in WT TEFF cells at TEM-characteristic genes as displayed on IGV. IgG CUT&RUN (C’nR) in WT, Tbet C’nR in Tbet-deficient, Runx C’nR in Runx3-deficient TEFF cells were performed as negative controls with similar sequencing output (the latter two tracks not shown for clarity). Open bars mark Tbet/Runx3-dependent Tle3 binding sites, where bars with solid lines denote overlap with “TEFF-acquired” Tle3 binding peaks, with Tle3 binding subcluster information marked on the top. h. Venn diagram showing overlap of Tle3, Tbet and Runx3 binding sites at Tle3-opened TEM signature ChrAcc sites (from ChrAccC6–8 with blue bars in Fig. 4c). i. Association of dynamic Tle3-bound, Tle3-opened and -closed ChrAcc sites (defined in Fig. 4e) with Tle3-activated and -repressed genes (defined in Fig. 3c). j. Scatterplot showing the connection of dynamic Tle3-bound, Diff. ChrAcc sites with DEGs between WT and Tle3−/− TEM cells, with select genes marked. Genes such as Ccr7, Zeb2 and Il2ra are associated with multiple qualified ChrAcc sites, which are connected with red dotted lines. k. Heatmap showing the impact of deficiency in Tbet and/or Runx3 on the expression of Tle3-activated TEM signature genes. WT, Tbx21−/−, Runx3−/− and TRKO P14 cells were adoptively transferred, and the recipients were infected with LCMV-Arm. On 4 dpi, early TEFF cells were analyzed with RNA-seq, and the expression of select Tle3-dependent TEM signature genes was displayed.
Figure 6.
Figure 6.. Lineage tracing reveals Tle3 deficiency promotes TCM cell formation at all response stages.
a–b. Tle3-deficient TEM cells are actively converted to TCM cells. In Gzmb-Cre-mediated Tle3 ablation (Fig. 1), TCM and TEM cells were sort-purified on 14 dpi (a) or ≥30 dpi (b) (left columns) and adoptively transferred into infection-matched CD45-disparate recipients (3×10⁵ TCM or 5×10⁵ TEM cells/recipient), followed by detection of CD62L+ TCM cells after 20 days (right columns). c. Tle3-deficient TEFF cells give rise to TCM cells. In Gzmb-Cre-mediated Tle3 ablation (Fig. 1), TEFF and TMP cells were sort-purified on 8 dpi (left columns) and adoptively transferred into infection-matched CD45-disparate recipients (1.5×10⁶ TEFF and 3×10⁵ TMP cells/recipients), followed by detection of CD62L+ TCM cells after 15 days (right two columns). d. Experimental design for assessing the impact of induced Tle3 ablation, where CreER+Tle3+/+ and CreER+Tle3FL/FL P14 cells were used as donor cells (5×10⁴ cells/recipient). The recipients were treated with Tamoxifen on 6 and 7 dpi to achieve Tle3 ablation at the effector phase, and treated again on 21 dpi to sustain Tle3 deletion. e. Detection of TCM cells in recipient spleens at ≥28 days after induced Tle3 deletion at the effector phase. All contour plots are representative data from ≥2 experiments, and cumulative data on TCM cell frequency and numbers are means ± s.d. **, p<0.01; ***, p<0.001 by Student’s t-test.
Figure 7.
Figure 7.. Induced Tle3 deletion in ‘established’ TEM cells promotes TCM formation while sustaining its functionality.
a. Volcano plot showing DEGs between WT and Tle3ΔCreER TEM cells after ex vivo treatment with 4-OHT for 48 hrs, by the criteria of ≥1.5-fold expression changes and FDR<0.05. Values denote DEG numbers, and selected differentially expressed TCM and TEM signature genes are marked in red and blue, respectively. b–c. Enrichment plots of TEM (b) and TCM (c) signature gene sets (defined in Fig. 3b) in comparison of Tle3ΔCreER vs. WT TEM cell transcriptomes with GSEA. In b, 37 of 90 TEM signature genes are in the leading-edge showing enrichment in WT TEM cells. In c, 82 of 181 TCM signature genes are in the leading edge showing enrichment in Tle3ΔCreER TEM cells. Top 20 enriched genes are shown in heatmaps for each gene set, with those in red denoting overlap with corresponding top 20 enriched genes in Fig. 3d and 3e, respectively. d. Volcano plot showing differential ChrAcc sites between WT and Tle3ΔCreER TEM cells after ex vivo treatment with 4-OHT for 48 hrs, by the criteria of ≥1.5-fold ChrAcc changes and FDR<0.05, with values denoting site numbers. e. Distribution of TCM and TEM signature ChrAcc sites in overlapping differential ChrAcc sites in Tle3ΔCreER vs. WT TEM cell comparison, with values in the plot denoting site numbers. f. ChrAcc tracks at the TEM- (top) and TCM-characteristic genes (bottom) in WT and Tle3ΔCreER TEM cells. Blue open bars denote more ‘closed’ sites, and red bars denote more ‘open’ sites in Tle3ΔCreER compared to WT TEM cells. g. Acute deletion of Tle3 in ‘established’ TEM cells promotes generation of TCM cells. WT and Tle3ΔCreER TEM cells were sort-purified from immune mice at 48 hrs after initial tamoxifen treatment and transferred into new hosts (5×10⁵ TEM cells/recipient), followed by detection of CD62L+ TCM cells after 14 days. h–k. Recall capacity is sustained in Tle3-deficient TCM cells. WT and Tle3ΔCreER TCM cells were sort-purified from immune mice at 14 days after initial tamoxifen treatment and transferred into Rag1−/− recipients (2×10⁴ TCM cells/recipient), followed by LM-GP33 infection. Three days after infection, the recipient spleens were harvested for analyses of TCM-derived secondary (2°) effectors, including cell numbers (h), IFN-γ-producing fraction (i), and granzyme B expression (j). Also analyzed were recipient livers for colony-forming units (CFUs, k). Data are representative from one of two independent experiments.

References

    1. Akondy RS et al. Origin and differentiation of human memory CD8 T cells after vaccination. Nature 552, 362–367 (2017). - PMC - PubMed
    1. Jameson SC & Masopust D Understanding Subset Diversity in T Cell Memory. Immunity 48, 214–226 (2018). - PMC - PubMed
    1. Martin MD & Badovinac VP Defining Memory CD8 T Cell. Front Immunol 9, 2692 (2018). - PMC - PubMed
    1. Sallusto F, Lenig D, Forster R, Lipp M & Lanzavecchia A Two subsets of memory T lymphocytes with distinct homing potentials and effector functions. Nature 401, 708–712 (1999). - PubMed
    1. Wherry EJ et al. Lineage relationship and protective immunity of memory CD8 T cell subsets. Nature immunology 4, 225–234 (2003). - PubMed

MeSH terms

Substances