Clinical Trial
. 2024 Mar;30(3):772-784.
doi: 10.1038/s41591-023-02785-8. Epub 2024 Jan 18.

Safety, efficacy and determinants of response of allogeneic CD19-specific CAR-NK cells in CD19+ B cell tumors: a phase 1/2 trial

Affiliations
Clinical Trial

Safety, efficacy and determinants of response of allogeneic CD19-specific CAR-NK cells in CD19+ B cell tumors: a phase 1/2 trial

David Marin et al. Nat Med. 2024 Mar.

Abstract

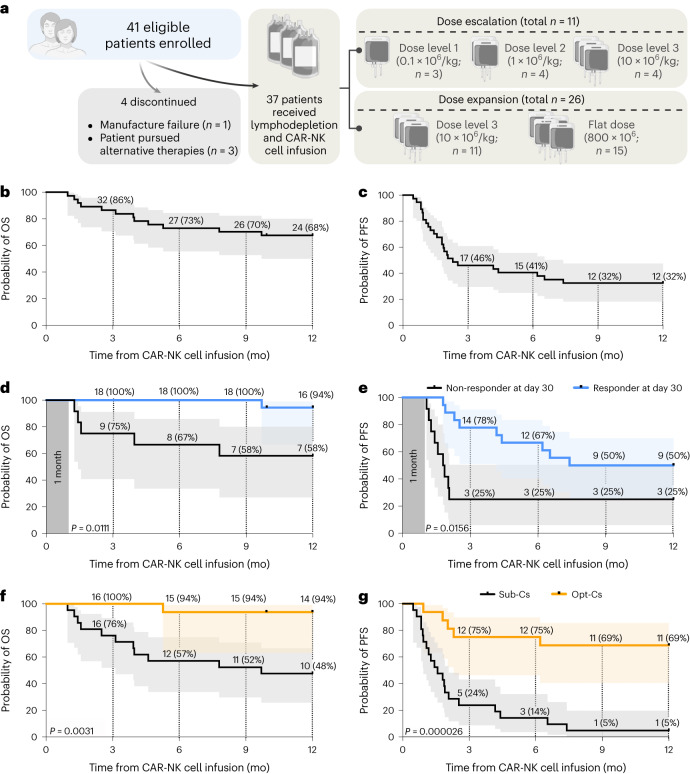
There is a pressing need for allogeneic chimeric antigen receptor (CAR)-immune cell therapies that are safe, effective and affordable. We conducted a phase 1/2 trial of cord blood-derived natural killer (NK) cells expressing anti-CD19 chimeric antigen receptor and interleukin-15 (CAR19/IL-15) in 37 patients with CD19+ B cell malignancies. The primary objectives were safety and efficacy, defined as day 30 overall response (OR). Secondary objectives included day 100 response, progression-free survival, overall survival and CAR19/IL-15 NK cell persistence. No notable toxicities such as cytokine release syndrome, neurotoxicity or graft-versus-host disease were observed. The day 30 and day 100 OR rates were 48.6% for both. The 1-year overall survival and progression-free survival were 68% and 32%, respectively. Patients who achieved OR had higher levels and longer persistence of CAR-NK cells. Receiving CAR-NK cells from a cord blood unit (CBU) with nucleated red blood cells ≤ 8 × 10⁷ and a collection-to-cryopreservation time ≤ 24 h was the most significant predictor for superior outcome. NK cells from these optimal CBUs were highly functional and enriched in effector-related genes. In contrast, NK cells from suboptimal CBUs had upregulation of inflammation, hypoxia and cellular stress programs. Finally, using multiple mouse models, we confirmed the superior antitumor activity of CAR/IL-15 NK cells from optimal CBUs in vivo. These findings uncover new features of CAR-NK cell biology and underscore the importance of donor selection for allogeneic cell therapies. ClinicalTrials.gov identifier: NCT03056339 .


Conflict of interest statement

D.M., Y.L., R.B., H.R., M.D., N.U., S. Acharya, E.L., P.B., M.S., P.L., S. Ang, R.E.C., E.J.S., K.R. and The University of Texas MDACC have an institutional financial conflict of interest with Takeda Pharmaceuticals. D.M., R.B., E.L., S. Ang, E.J.S., K.R. and The University of Texas MDACC have an institutional financial conflict of interest with Affimed. K.R. participates on the Scientific Advisory Board for GemoAb, AvengeBio, Virogin Biotech, GSK, Bayer, Navan Technologies, Caribou Biosciences, Bit Bio and Innate Pharma. K.R. is the scientific founder of Syena. E.J.S. has served on the Scientific Advisory Board for Adaptimmune, Axio, Celaid, FibroBiologics, Navan Technologies, New York Blood Center and Novartis. The remaining authors declare no competing interests.

Figures

Fig. 1
Fig. 1. Clinical outcomes after CAR19/IL-15 NK cell therapy.
a, Consort diagram of CAR19/IL-15 NK cell therapy (created using BioRender.com). b,c, Kaplan–Meier curves showing OS (b) and PFS (c) of patients (n = 37) who received CAR19/IL-15 NK cell therapy. d,e, Landmark analysis based on day 30 response evaluation for the 30 patients who remained on the study after CAR19/IL-15 NK cell therapy (n = 18 responders versus 12 non-responders). The Kaplan–Meier curves show the OS (d) and PFS (e) according to OR on day 30. f,g, Kaplan–Meier curves showing OS (f) and PFS (g) of patients who received CAR19/IL-15 NK cell therapy derived from Opt-Cs (n = 16) versus Sub-Cs (n = 21). Tick marks indicate the times at which data were censored for a given patient. Numbers above each line represent the number of patients at risk. Numbers in parentheses represent the probabilities of OS or PFS at a given time point; mo, months. P values were determined by log-rank test, and the shaded areas represent 95% CI of survival probability. Source data
Fig. 2
Fig. 2. CAR19/IL-15 NK cells from Opt-Cs demonstrate superior effector function compared to those from Sub-Cs.
Differences in the function of the clinical CAR19/IL-15 CBU-NK cells from Opt-Cs and Sub-Cs (ad). Plots in ei represent CAR19/IL-15 NK cells from an independent cohort of CBUs. a, Tumor rechallenge assay with CAR19/IL-15 NK cells from either Sub-Cs or Opt-Cs against RajimCherry (effector-to-target (E:T) ratio of 5:1). Tumor cells (100,000 cells) were added every 2–3 d; target killing was measured by mCherry detection. The bar graph shows the area under the curve (AUC) of tumor cell index (n = 3 donors per group). b, Bar graph showing the PSI of CAR19/IL-15 NK cells (n = 3 donors per group) following CD19 antigen stimulation. c, Oxygen consumption rate (OCR) as a surrogate for oxidative phosphorylation (OXPHOS) by Mito Stress Test of CAR19/IL-15 NK cells from Opt-Cs versus Sub-Cs (n = 3 donors each; left); bar graphs of basal respiration (middle) and maximal respiration (right) are also shown; Oligo, oligomycin, Rot/AA, rotenone/antimycin A. d, Bar graph of glycolytic capacity measured by Glycolysis Stress Test of CAR19/IL-15 NK cells from Opt-Cs versus Sub-Cs (n = 3 donors each); ECAR, extracellular acidification rate. e, Bar graph showing CAR percentage expression on NK cells derived from an independent cohort of Sub-Cs versus Opt-Cs (n = 5 donors per group). f, Cumulative population doublings (PDs) of CAR19/IL-15 NK cells (n = 5 per group). g, Tumor rechallenge assay with CAR19/IL-15 NK cells against RajimCherry (E:T ratio of 2:1). Tumor cells (100,000 cells) were added every 2–3 d; tumor killing was measured as in a. The bar graph shows the AUC of tumor cell index (n = 5 donors per group). h, Bar graph showing the PSI of CAR19/IL-15 NK cells after CD19 antigen stimulation (n = 3 donors per group). i, OCR as a surrogate for OXPHOS of CAR19/IL-15 NK cells from Opt-Cs versus Sub-Cs (n = 3 donors each) by Mito Stress Test (left); bar graphs of basal OCR (middle) and maximal OCR (right) are also shown. P values were determined by two-tailed Student’s t-test (a, c, d, e, g and i), or two-tailed one-way analysis of variance (ANOVA; b, f and h). Each symbol represents an individual sample, and data are shown as the mean + s.e.m. NS, not significant. Source data
Fig. 3
Fig. 3. Unmanipulated NK cells from CBMCs of Opt-Cs and Sub-Cs display distinct signatures.
Phenotype of unmanipulated NK cells in cryopreserved CBMCs from each of the cords used to manufacture the clinical CAR19/IL-15 NK cell product (ac). For experiments in dg, we used an independent cohort of CBUs. a, Phenotype of unmanipulated NK cells in CBMCs of Sub-Cs (n = 18 donors) versus Opt-Cs (n = 13 donors) by CyTOF. Only samples with viable CBMCs > 1,500 cells were analyzed. Frequencies of each cluster (1–4) are indicated; size and color of nodes within each cluster represent numbers of clustered cells. b, Bar graph shows the NK cell percentage within cluster 1 for Sub-Cs versus Opt-Cs. c, Heat map of marker expression within the main subclusters of clusters 1–4. Each column represents a major node within the SPADE tree clusters. The major nodes are representative of the majority of cells across all conditions. The expression level for each marker is represented from blue (low) to red (high). d, Heat map of differentially expressed genes (adjusted P value < 0.1 and absolute log2 fold change (FC) > 1.5) in unmanipulated NK cells from CBMCs of Opt-Cs (n = 18 samples) versus Sub-Cs (n = 14 samples). TPM, transcript per million. e, GSEA enrichment plots show differentially regulated pathways for NK cells from Opt-Cs versus Sub-Cs. f, Volcano plot (top) showing the log2 fold change (log2FC) in TF activity levels between NK cells from Sub-Cs (n = 9 samples, black) and Opt-Cs (n = 8 samples, yellow). Log plots (bottom) showing the top TF-binding motifs enriched in the preferentially open chromatin regions of unmanipulated NK cells from Opt-Cs and Sub-Cs (by HOMER). g, ATAC-seq tracks for selected genes in NK cells from Sub-Cs (n = 8 samples; top, black) versus Opt-Cs (n = 8 samples; bottom, yellow). Box plots comparing the gene-level accessibility score between the two groups. P values were determined by two-tailed Student’s t-test in b and g, a two-tailed Wilcoxon rank-sum test in the volcano plot and a one-tailed binomial test for motif enrichment analysis in f. q values were determined by two-tailed two-sample t-test with false discovery rate correction for multiple testing in e. Data are shown as the mean + s.e.m. Source data
Extended Data Fig. 1
Extended Data Fig. 1. Clinical response following CAR19/IL-15 NK cell therapy according to the underlying disease.
Bar graph showing the diagnosis and best response for the 37 patients treated in the study; CR: complete response; PR: partial response; SD: stable disease; PD: progressive disease; NHL: non-Hodgkin’s lymphoma; low-grade NHL: follicular lymphoma and marginal zone lymphoma; CLL: chronic lymphocytic leukemia; CLL-RT: CLL with Richter’s transformation; DLBCL: diffuse large B cell lymphoma; Other: mantle cell lymphoma (n = 1), acute lymphoblastic leukemia (n = 1), and lymphoplasmacytic lymphoma (n = 1).
Extended Data Fig. 2
Extended Data Fig. 2. CAR-NK cell persistence in the peripheral blood (PB) of patients after CAR19/IL-15 NK-cell infusion.
(a) Measurements of CAR-NK cells in PB samples (CAR copy number) by quantitative polymerase-chain-reaction (qPCR) in overall responders (ORs, blue; n = 18 patients) vs. non-responders (NRs, black; n = 19 patients) after treatment with CAR19/IL-15 NK cells. Each dot represents a measurement for one patient at one time point. Measurements for individual patients are connected using dashed lines. The solid lines represent the mean values for each group. (b) Measurements of CAR copy number by qPCR in PB samples of patients according to the degree of match at HLA-A, HLA-B and HLA-DR loci between the cord donor and the patient; HLA match 0/6 (n = 5 patients), HLA match 1-3/6 (n = 13 patients), HLA match 4/6 (n = 19 patients). Data are shown as median + 95% CI. P-values were determined by mixed-effects model with Geisser-Greenhouse correction in panel a. Source data
Extended Data Fig. 3
Extended Data Fig. 3. Expression of trogocytosis (TROG) antigen on CAR19 + NK cells is associated with a reduction in CD19 expression on B cells and predicts for worse outcomes after CAR19/IL-15 NK-cell treatment.
(a) Comparison of normalized CD19-MFI expression on B cells in the PB of patients before and 14 days after CAR19/IL-15 NK cell therapy. The data are shown for TROGlow (n = 23 patients; left) and TROGhigh groups (n = 13 patients; right). (b and c) Kaplan-Meier curves showing (b) overall survival (OS) and (c) progression-free survival (PFS) for patients categorized as TROGlow (n = 23 patients) vs. TROGhigh (n = 13 patients); mo: months. Numbers above each line represent the number of patients at risk. Numbers in parentheses represent the probabilities of OS or PFS at a given time point. Trogocytosis data were not available for one patient. The shaded areas represent 95% confidence interval (CI) of survival probability. P-values were determined by two-tailed paired student t test in panel a, or by log-rank test in panels b and c. Source data
Extended Data Fig. 4
Extended Data Fig. 4. Levels of cytokines in the PB of patients following treatment with CAR19/IL-15 NK cells.
Bar graphs showing the levels of cytokines (markers of cytokine release syndrome in (a), and effector cytokines in (b) in the PB of patients at baseline and the maximum values in the first 6 weeks or at 3 months or later after CAR19/IL-15 NK-cell infusion. (a) IL-1β (left), and IL-6 (right) (n = 33). (b) IL-15 (left), IFN-γ (middle), TNF-α (right) (n = 34). (c) Spider plot showing B cell counts calculated based on CD19+ B-cell frequencies by flow cytometry in PB samples collected from patients at baseline and at multiple timepoints post CAR-NK cell infusion (n = 37 patients). The dotted line represents the threshold for B-cell lymphopenia (<100 B-cells/μL). The shadowed area represents B-cell aplasia (<1 B-cell/μL). The solid blue line represents the mean. (d) Spider plot showing CD3+ T cell counts calculated based on flow cytometry in PB samples from patients at baseline and at multiple timepoints post CAR-NK cell infusion (n = 37 patients). The solid green line represents the mean. For panels a, b, each symbol represents an individual patient, data are shown as mean + s.e.m. P-values were determined by Kruskal-Wallis test in panels a, b. Each symbol represents an individual patient; outliers are identified as black dots. Source data
Extended Data Fig. 5
Extended Data Fig. 5. Posterior distributions of the Log (Odds Ratio) of the probability of 30-day OR, Log (Odds Ratio) of the probability of 1-year CR, Log (Hazard Ratio) of 1-year PFS and Log (Hazard Ratio) of 1-year OS for patients who received optimal cords (Opt-Cs) vs. those who did not.
We computed the distribution of probabilities of the effect of receiving an Opt-C on (a) 30-day OR, (b) 1-year CR, (c) 1-year PFS and (d) 1-year OS. The area under the curve of a probability plot equals 1 and can be used to compute the probabilities of specific outcomes. For example, in panel a, the area to the right of Log (Odds Ratio) 2, which is about 0.50, is the probability that the Log (Odds Ratio) for the effect of Opt-C on the 30-day OR rate is larger than 2. Probability of a beneficial effect (PBE) of the variable of interest on a particular outcome is defined as the area in the distribution of probability to the right of 0. This is the probability that the rate of a favorable outcome, either (a) 30-day OR or (b) 1-year CR, is higher for patients who received Opt-C NK cells compared to patients who did not receive Opt-C NK cells. In general, a PBE near 1 implies that the variable is likely to have a beneficial effect, a PBE near 0 implies that the variable is unlikely to have a beneficial effect, and a PBE near 0.50 corresponds to no effect. For the outcomes of (c) 1-year PFS and (d) 1-year OS, PBE is represented graphically by the portion in the distribution of probabilities of Log (Hazard Ratio) to the left of 0, since it is better to have a smaller risk of death for OS, or for progression or death for PFS.
Extended Data Fig. 6
Extended Data Fig. 6. Immunosuppressive properties of NRBCs and impact of prolonged CBU collection-to-cryopreservation on CAR-NK function.
(a) Bar graphs show levels of arginase-1 (measured by ELISA), TGF-β1 and TGF-β2 (assessed by Milliplex) released by NRBCs (500 K cells/ml) purified from CBU (n = 5 CBU donors). NRBCs were cultured for up to 72 hours and the maximum level for each analyte was plotted. Media alone was used as a negative control. (b and c) Five CBU with an NRBC count ≤8 × 107 were each divided into two fractions (Fractions A and B) soon after collection. Fraction A was cryopreserved <12 hours from collection while fraction B was frozen 24-48 hours post-collection in the MD Anderson CB bank. Both fractions were then thawed at the same time and NK cells isolated, expanded, and transduced with the CAR19/IL-15 retroviral vector following our standard procedure in our GMP facility. We used the IncuCyte® imaging system to assess the cytotoxicity of CAR19/IL-15 NK cells generated from matched Fractions A and B from the same CBU (n = 5 CB donors) against RajimCherry cells (at an E:T ratio of 10:1 and adjusted for CAR transduction efficiency) in a tumor rechallenge assay. Tumor cells were added every 2-3 days for 9 days and tumor cell killing measured by the tumor cell index. (b) The bar plots show the area under curve (AUC) of tumor cell index, representing the tumor cell count detected by mCherry. The AUCs for 4 tumor challenges, as a measure of the anti-tumor activity of CAR19/IL-15 from Fractions A and B, are displayed (n = 5 donors per each fraction). (c) Representative images from the serial tumor rechallenge assay from the experiment described in panel b. P-values were determined by two-tailed Student’s t test in panel b. Each symbol represents an individual donor, data are shown as mean + s.e.m. Source data
Extended Data Fig. 7
Extended Data Fig. 7. Characterization of expanded NK cells from Opt-Cs and Sub-Cs.
Clinical CAR19/IL-15 NK cells from Opt-Cs and Sub-Cs were used in panels a-c. Expanded NT-NK cells from an independent cohort of CBUs were used in panels d-f. (a) Bar graph showing the percentage of CAR expression in clinical CAR19/IL-15 NK cells from Sub-Cs (n = 21 donors) or Opt-Cs (n = 16 donors). (b) Cumulative population doublings (PDs) for CAR-NK cells from Sub-Cs (n = 21 donors) or Opt-Cs (n = 16 donors) expanded with K562-based feeder cells and IL-2 (200 U/mL). (c) SPADE analysis of CyTOF data showing the phenotype of the CAR19/IL-15 NK cells (expanded for 14–21 days) from Sub-Cs (n = 17 donors) or Opt-Cs (n = 8 donors). Frequencies of each cluster (1–6) are indicated; size and color of nodes represent numbers of clustered cells. (d) Cumulative PDs of NT-NK cells derived from an independent cohort of Sub-Cs vs. Opt-Cs (n = 4 donors per group). (e) Tumor rechallenge assay where NT-NK cells were rechallenged with RajimCherry at 5:1(E:T ratio). Tumor cells (16,700 cells) were added every 2 days for 8 days and tumor cell killing was measured by the tumor cell index. The bar plots show the AUC of tumor cell index (n = 3 donors per group). (f) Representative images from the serial tumor rechallenge assay from the experiment described in panel e. (g) Bar graph showing the PSI of NT-NK cells secreting different cytokines after Fc-CD16 stimulation (n = 3 per group). (h) OCR as a surrogate for oxidative phosphorylation (OXPHOS) was performed on NT-NK cells that were expanded from a subset of Sub-Cs and Opt-Cs (n = 3 donors each). The results of the mito stress test (left), and the bar graphs of basal respiration (middle) and maximal respiration (right) are presented; Oligo: Oligomycin, Rot/AA: Rotenone/Antimycin A. P-values were determined by two-tailed Student’s t test in panels a,e,h, or two-tailed one-way ANOVA in panels b,d,g. Each symbol represents an individual donor, data are shown as mean + s.e.m. Source data
Extended Data Fig. 8
Extended Data Fig. 8. Unmanipulated NK cells from Opt-Cs and Sub-Cs are characterized by unique transcriptomic and epigenetic signatures.
(a) PCA plot based on the top five thousand variably expressed genes, showing separation of Opt-Cs (n = 18 samples) and Sub-Cs (n = 14 samples). (b) Box plots showing the NK functional scores for NK cells from CBMCs of Sub-Cs (n = 13 samples) vs. Opt-Cs (n = 18 samples). Data are represented as median (min-max). (c) Bar graph of pathway enrichment analysis. Significantly differentially regulated pathways were identified by GSEA (q < 0.1). Positive values indicate upregulation in Opt-Cs and negative values indicate upregulation in Sub-Cs. (d) Enrichment plots for selected pathways identified to be differentially regulated using GSEA of NK cells from CBMCs of Opt-Cs relative to Sub-Cs. (e) PCA plot based on the 128,972 variably accessible peaks, showing separation of Opt-Cs (n = 8 samples) and Sub-Cs (n = 9 samples). (f) Heatmap showing regulon activity AUC scores of differentially active regulons (see Methods, adjusted P-value < 0.01) between Opt-C (n = 18 samples) and Sub-Cs (n = 14 samples). The AUC scores are scaled and indicated by the color intensity. P-values were determined by two-tailed Student’s t test in b. q-values were determined by two-tailed two-sample t test with FDR correction for multiple testing in panels c, d. P-value is determined by a two-tailed Student’s t test with Bonferroni correction in f. Data are shown as median with range of minimum to maximum in b. Source data
Extended Data Fig. 9
Extended Data Fig. 9. CAR-NK cells from Opt-Cs show enhanced anti-tumor activity in vivo.
(a) Schema of the mouse model of Raji tumor. Mice received a single CAR19/IL-15 NK-cell infusion. For panels b-e, mice were sacrificed 14 days post-NK infusion. (b) Absolute CAR19 NK cell counts in PB 10 days post-NK cell injection (Sub-Cs: n = 5 mice; Opt-Cs: n = 4 mice). (c) The animals were sacrificed at day 14 after CAR19/IL-15 NK-cell injection. Absolute numbers of CAR19/IL-15 NK (left) and Raji (right) cells in BM (Raji only: n = 4 mice; Sub-Cs: n = 5 mice; Opt-Cs: n = 4 mice). (d) SPADE analysis showing the phenotype of live hCD45+CD56+CD3CAR19/IL-15 NK cells from Sub-Cs (n = 5 mice) or Opt-Cs (n = 3 mice) from BM samples. (e) Heatmap representing the expression (low=blue; high=red) of NK markers within the main sub-clusters (Clusters 1–6). Each column represents a major node which is representative of the majority of cells across all conditions; tCD19: trogocytic CD19. (f-g) A second Raji model experiment where mice received a single infusion of CAR19/IL-15 NK-cell and were followed for tumor growth (by weekly BLI) and survival. Each line refers to an individual mouse (n = 5 mice/group). (g) Kaplan-Meier survival curves; data were pooled from two independent experiments. (h) Schema of the CD70 + MM1S tumor model. Mice received a single CAR70/IL-15 NK-cell infusion. (i) Plot showing MM1S tumor burden. Each line refers to an individual mouse (n = 5 mice/group). (j) Kaplan-Meier survival curves. (k) CAR70/IL-15 NK-cell count in PB at days 10 and 20 after CAR70/IL-15 NK-cell infusion. (l) Frequencies of CD138+ MM1S cells in the BM of mice collected at sacrifice. (m) Schema of the TROP2 + SKOV3 tumor model. Mice received a single CAR-TROP2/IL-15 NK-cell injection. (n) Plot showing SKOV3 tumor burden. Each line refers to an individual mouse (n = 4 mice/group). (o) Kaplan-Meier survival curves. P-values were determined by two-tailed two-way ANOVA in panels b, i.k, n, log-rank test in panels c, j, o, two-tailed Student’s t test in panels d, e, or two-tailed one-way ANOVA in panels e,l. Data shown in panels d, e, k, l were analyzed by flow cytometry and shown as mean ± s.e.m. Each symbol represents an individual mouse sample. Source data

References

    1. Abramson JS, et al. Lisocabtagene maraleucel for patients with relapsed or refractory large B-cell lymphomas (TRANSCEND NHL 001): a multicentre seamless design study. Lancet. 2020;396:839–852. doi: 10.1016/S0140-6736(20)31366-0. - DOI - PubMed
    1. Neelapu SS, et al. Axicabtagene ciloleucel CAR T-cell therapy in refractory large B-cell lymphoma. N. Engl. J. Med. 2017;377:2531–2544. doi: 10.1056/NEJMoa1707447. - DOI - PMC - PubMed
    1. Schuster SJ, et al. Tisagenlecleucel in adult relapsed or refractory diffuse large B-cell lymphoma. N. Engl. J. Med. 2019;380:45–56. doi: 10.1056/NEJMoa1804980. - DOI - PubMed
    1. Wang M, et al. KTE-X19 CAR T-cell therapy in relapsed or refractory mantle-cell lymphoma. N. Engl. J. Med. 2020;382:1331–1342. doi: 10.1056/NEJMoa1914347. - DOI - PMC - PubMed
    1. Brudno JN, Kochenderfer JN. Recent advances in CAR T-cell toxicity: mechanisms, manifestations and management. Blood Rev. 2019;34:45–55. doi: 10.1016/j.blre.2018.11.002. - DOI - PMC - PubMed

Publication types

Associated data