. 2024 Jan 18;25(1):35.
doi: 10.1186/s12931-024-02687-4.

Integrative study of pulmonary microbiome, transcriptome and clinical outcomes in Mycoplasma pneumoniae pneumonia

Affiliations

Integrative study of pulmonary microbiome, transcriptome and clinical outcomes in Mycoplasma pneumoniae pneumonia

Xia Huang et al. Respir Res. .

Abstract

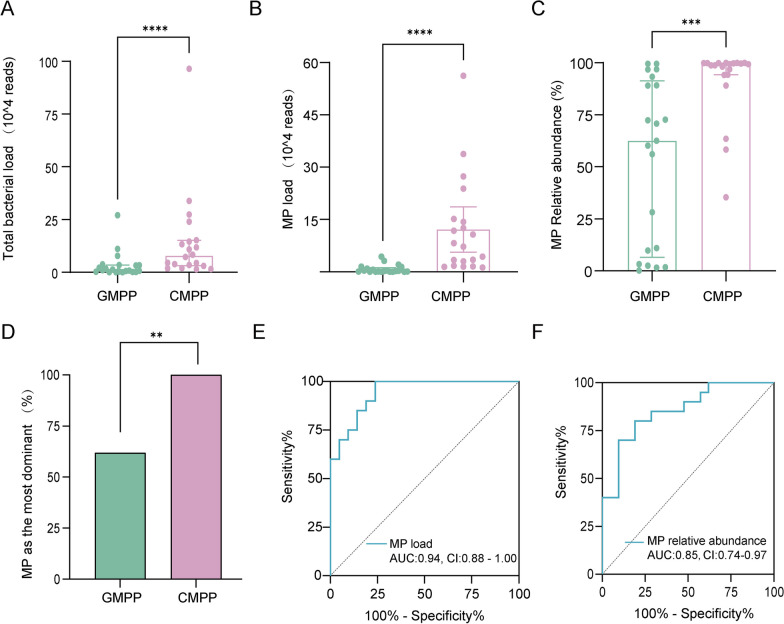
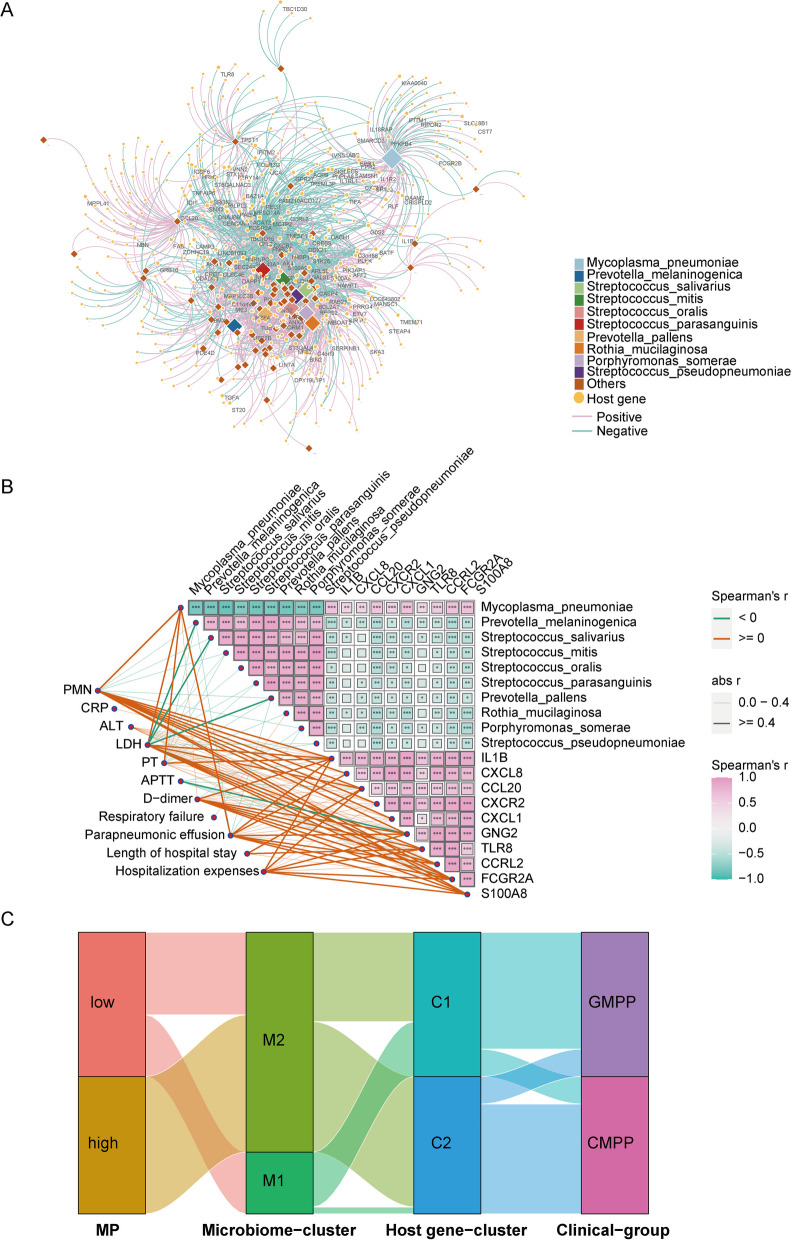
Background: This study aimed to investigate the interactions among three core elements of respiratory infection-pathogen, lung microbiome, and host response-and their avocation with the severity and outcomes of Mycoplasma pneumoniae pneumonia (MPP) in children.

Methods: We prospectively collected bronchoalveolar lavage fluid from a cohort of 41 children with MPP, including general MPP (GMPP) and complicated MPP (CMPP), followed by microbiome and transcriptomic analyses to characterize the association among pathogen, lung microbiome, and host response and correlate it with the clinical features and outcomes.

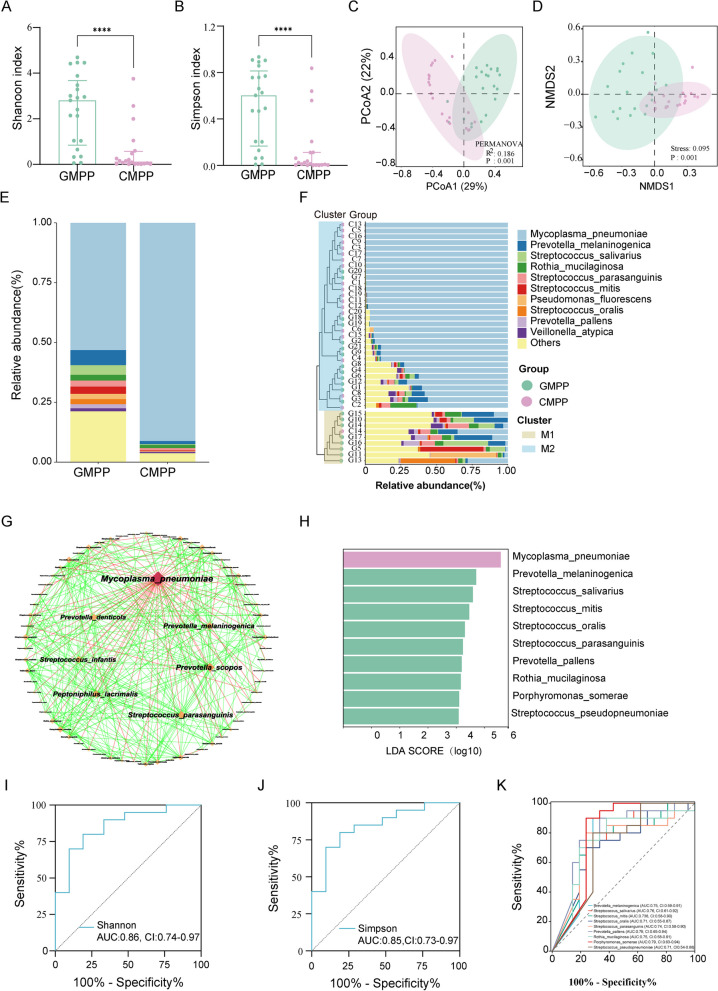
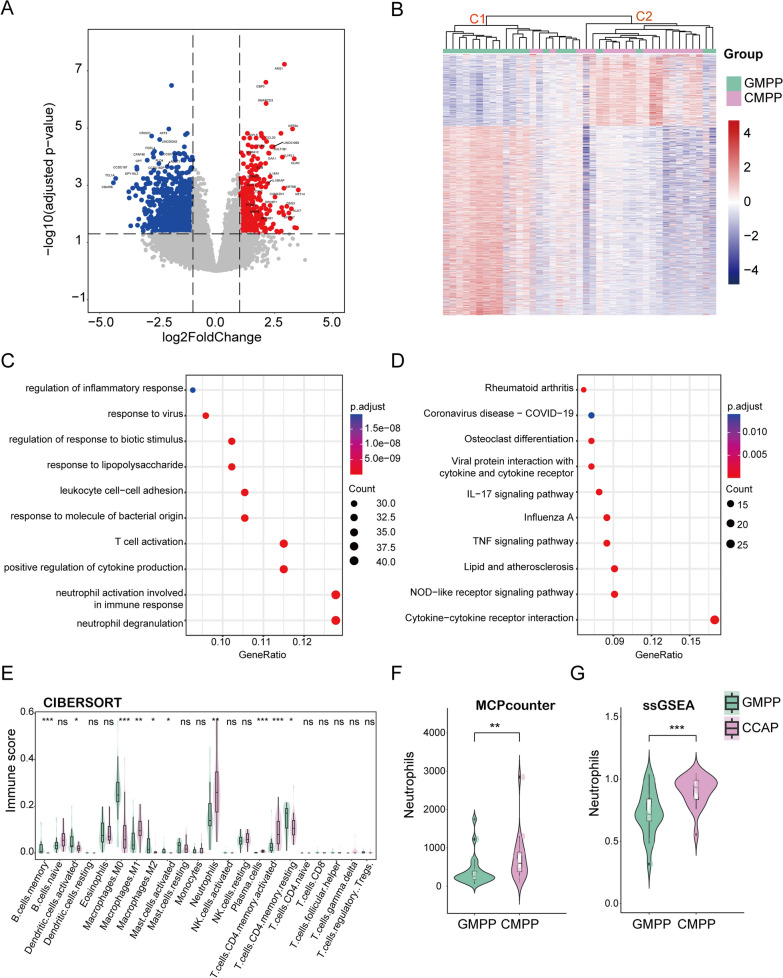
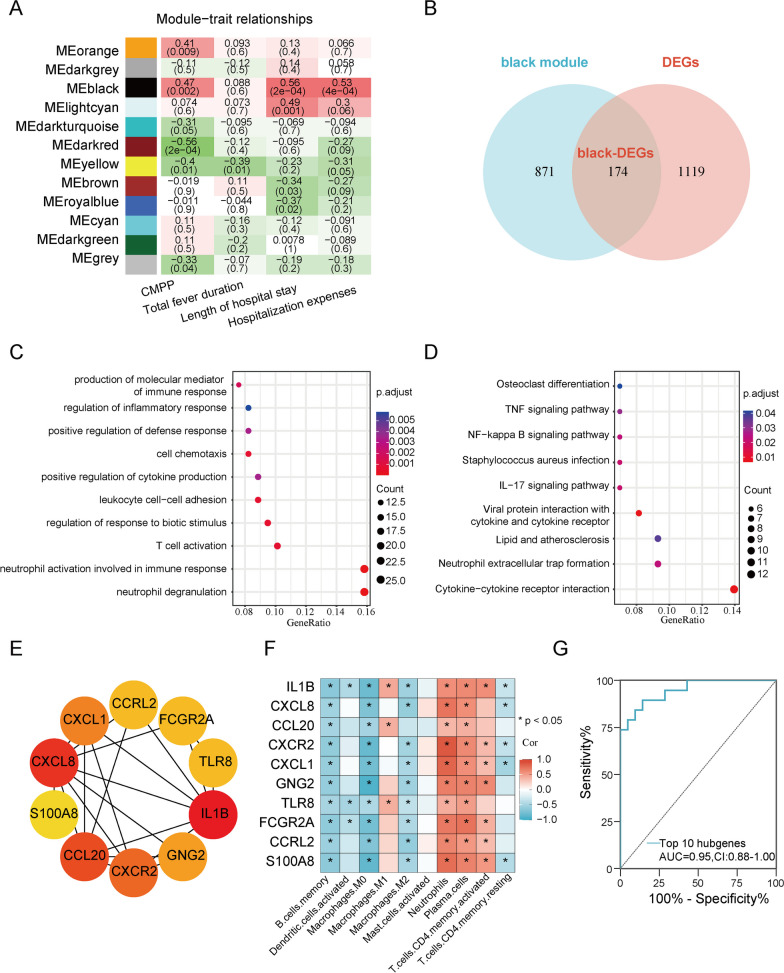
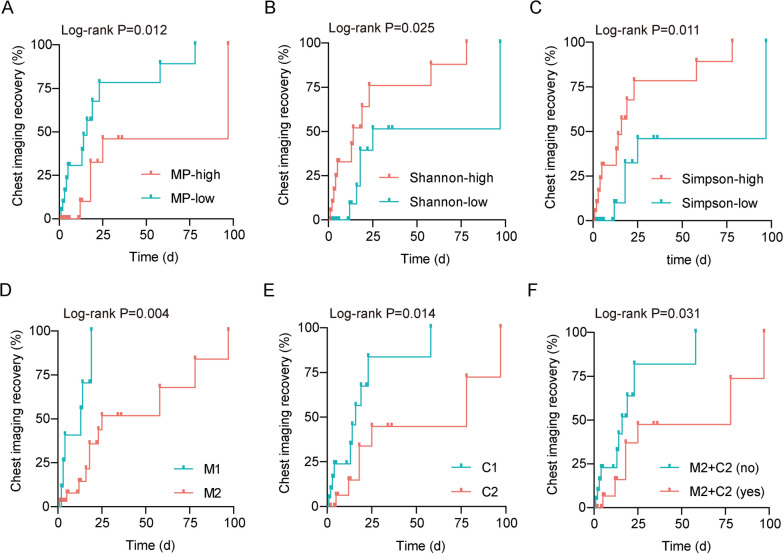
Results: The lung microbiome of patients with CMPP had an increased relative abundance of Mycoplasma pneumoniae (MP) and reduced alpha diversity, with 76 differentially expressed species. Host gene analysis revealed a key module associated with neutrophil function and several inflammatory response pathways. Patients with a high relative abundance of MP, manifested by a specific lung microbiome and host response type, were more prone to CMPP and had a long imaging recovery time.

Conclusion: Patients with CMPP have a more disrupted lung microbiome than those with GMPP. MP, lung microbiome, and host response interacts with each other and are closely related to disease severity and outcomes in children with MPP.

Keywords: Host response; Microbiome; Mycoplasma pneumoniae; Neutrophils; Outcomes.


Conflict of interest statement

The authors declare that they have no conflicts of interest.

Figures

Fig. 1
Fig. 1
Pathogen load is associated with MPP severity. A The bacterial load in the CMPP and GMPP groups. B The MP load in the CMPP and GMPP groups. C The relative abundance of MP in the CMPP and GMPP groups. D The proportion of MP as the most dominant bacteria in CMPP and GMPP groups. E The diagnostic value of MP load for CMPP. F ROC curve constructed to study the diagnostic value of MP relative abundance for CMPP. AUC area under the curve, CMPP complicated Mycoplasma pneumoniae pneumonia, CI 95% confidence interval, GMPP general Mycoplasma pneumoniae pneumonia, MP Mycoplasma pneumoniae, MPP Mycoplasma pneumoniae pneumonia, ROC Receiver operating characteristic curve. *P < 0.05, **P < 0.01, ***P < 0.001, ****P < 0.0001
Fig. 2
Fig. 2
Lung microbiome imbalance are associated with MPP severity.  A Alpha diversity evaluated by the Shannon index. B Alpha diversity evaluated by the Simpson index. CD Beta diversity evaluated by the PCoA and NMDS analyses based on Bray-Curtis distance. E Relative abundance of lung microbiota at the species level. F Hierarchical clustering-based classification of samples into two clusters, M1 and M2. G Network of associations among the lung microbiota. Diamond nodes represented species. The larger and redder the node, the more nodes it was associated with. Edges indicated significant associations ( P  < 0.05) between species and were colored based on positive (green) and negative (red) associations between species abundances. H The top 10 DES between the CMPP and GMPP groups based on LEfSe analysis. I-J The diagnostic value of alpha diversity for GMPP. (K) ROC curve constructed to study the diagnostic value of the top 10 DES (except MP) for GMPP.  AUC area under the curve, CI 95% confidence interval, DES differentially expressed species, LEfSe linear discriminant analysis (LDA) effect size, NMDS non-metric multidimensional scaling, PCoA principal coordinates analysis, ROC receiver operating characteristic curve
Fig. 3
Fig. 3
Host transcriptional features of CMPP are correlated with neutrophil functions and inflammatory response pathways.  A Volcano plot of DEGs in CMPP and GMPP. The horizontal line at adj P  = 0.05; vertical line at |log 2 FC| = 1. Red and blue dots in volcano plot show upregulated and downregulated genes, respectively. B Heatmap showing the DEGs. The gradation of color represents the value of |lo g2 FC|. Hierarchical clustering classified samples into two clusters, namely the C1 cluster and the C2 cluster. C, D GO-Biological Process, KEGG enrichment analysis of the up regulated DEGs. E A violin plot showing the distribution of 22 types of immune cells in CMPP and GMPP. F, G Comparison of the infiltration of neutrophils between the two groups using other algorithms.  BP biological process, DEG differentially expressed gene, DEC differentially expressed cell, FC fold change, GO Gene Ontology, KEGG Kyoto Encyclopedia of Genes and Genomes, ssGSEA single-sample gene set enrichment analysis
Fig. 4
Fig. 4
CMPP-related module genes are correlated with neutrophil functions and inflammatory response pathways.  A The WGCNA used to analyze all the genes and identify the modules significantly related to traits. Heatmaps show the correlation between eigengenes and clinical traits. The cells are colored by the correlation according to the color legend. Each row corresponds to a module eigengene. Each cell contains the corresponding correlation and P value. B The Venn diagram displaying the black-DEGs overlapping in the black module and DEGs between CMPP and GMPP. C, D GO and KEGG enrichment of the black-DEGs genes. E CytoHubba-MCC was used to identify the top 10 hub genes in the network. The darker the orange color, the higher the score. F The relationship between DECs and hub black DEGs. G ROC curve constructed to study the predictive effect of the 10 hub genes on the diagnosis of CMPP.  AUC area under the curve, CI 95% confidence interval, ROC receiver operating characteristic curve, WGCNA weighted Gene Co-expression Network analysis. *P  < 0.05, ** P  < 0.01, *** P  < 0.001, **** P  < 0.0001
Fig. 5
Fig. 5
Interactions among pathogens, lung microbiome, and host responses are associated with disease severity.  A Network of associations between the lung DES (n  = 76) and DEGs (n  = 1293) between CMPP and GMPP groups. Each diamond node represented a lung species. Each circle node represented a host gene. Edges showed medium above associations between microbial abundance and gene expression level (Spearman’s r  > 0.4, P  < 0.05). The circular nodes labeled were black-DEGs. B A heatmap showing the correlation among lung microbiome (top 10 DES), host response (top 10 hub genes) and clinical indicators. C Sankey diagram showing the relationships among pathogen, lung microbiome, host response, and clinical features
Fig. 6
Fig. 6
Interactions among pathogens, lung microbiome, and host responses are associated with outcomes.  Kaplan–Meier survival curves for chest imaging recovery based on the relative abundance of MP (A), Shannon index (B), Simpson index (C), microbiome cluster (D), host gene cluster (E), combination module of microbiome cluster M2, and host gene cluster C2 (F)

Similar articles

Cited by

References

    1. Huang X, Li D, Liu F, Zhao D, Zhu Y, Tang H. Clinical significance of D-dimer levels in refractory Mycoplasma pneumoniae pneumonia. BMC Infect Dis. 2021;21(1):14. - PMC - PubMed
    1. Zhang H, Ai JW, Yang W, Zhou X, He F, Xie S, et al. Metatranscriptomic characterization of Coronavirus Disease 2019 identified a host Transcriptional Classifier Associated with Immune Signaling. Clin Infect Dis. 2021;73(3):376–85. - PMC - PubMed
    1. Yang TI, Chang TH, Lu CY, Chen JM, Lee PI, Huang LM, et al. Mycoplasma pneumoniae in pediatric patients: do macrolide-resistance and/or delayed treatment matter? J Microbiol Immunol Infect. 2019;52(2):329–35. - PubMed
    1. de Benedictis FM, Kerem E, Chang AB, Colin AA, Zar HJ, Bush A. Complicated pneumonia in children. Lancet. 2020;396(10253):786–98. - PubMed
    1. Ling Y, Ning J, Xu Y. Explore the Predictive Value of Peripheral Blood Cell parameters in Refractory Mycoplasma pneumoniae Pneumonia in Children over 6 Years Old. Front Pediatr. 2021;9:659677. - PMC - PubMed

Substances

LinkOut - more resources