. 2024 Jan 18;43(1):22.
doi: 10.1186/s13046-024-02950-y.

LINC00571 drives tricarboxylic acid cycle metabolism in triple-negative breast cancer through HNRNPK/ILF2/IDH2 axis

Affiliations

LINC00571 drives tricarboxylic acid cycle metabolism in triple-negative breast cancer through HNRNPK/ILF2/IDH2 axis

Zihan Xi et al. J Exp Clin Cancer Res. .

Abstract

Background: Triple-negative breast cancer is a complex breast malignancy subtype characterized by poor prognosis. The pursuit of effective therapeutic approaches for this subtype is considerably challenging. Notably, recent research has illuminated the key role of the tricarboxylic acid cycle in cancer metabolism and the complex landscape of tumor development. Concurrently, an emerging body of evidence underscores the noteworthy role that long non-coding RNAs play in the trajectory of breast cancer development. Despite this growing recognition, the exploration of whether long non-coding RNAs can influence breast cancer progression by modulating the tricarboxylic acid cycle has been limited. Moreover, the underlying mechanisms orchestrating these interactions have not been identified.

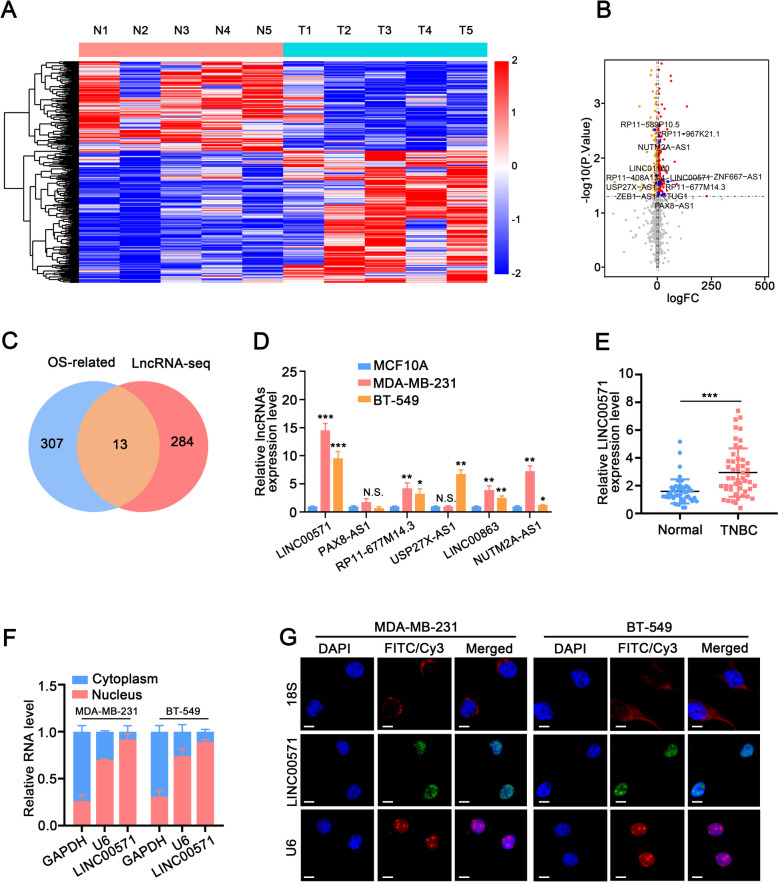
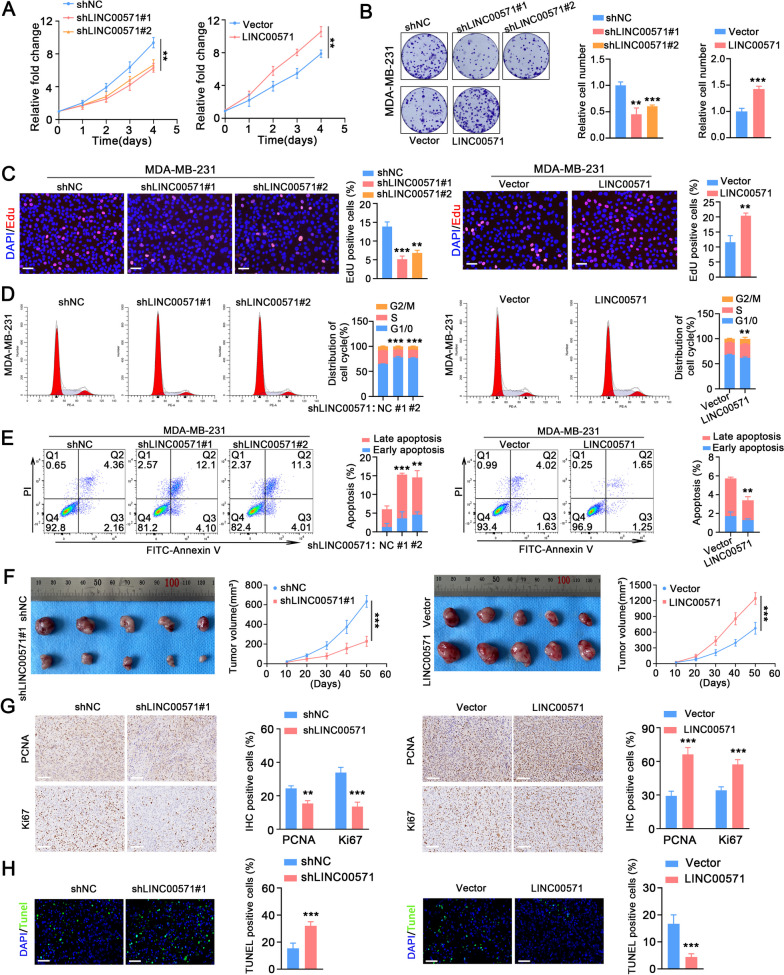
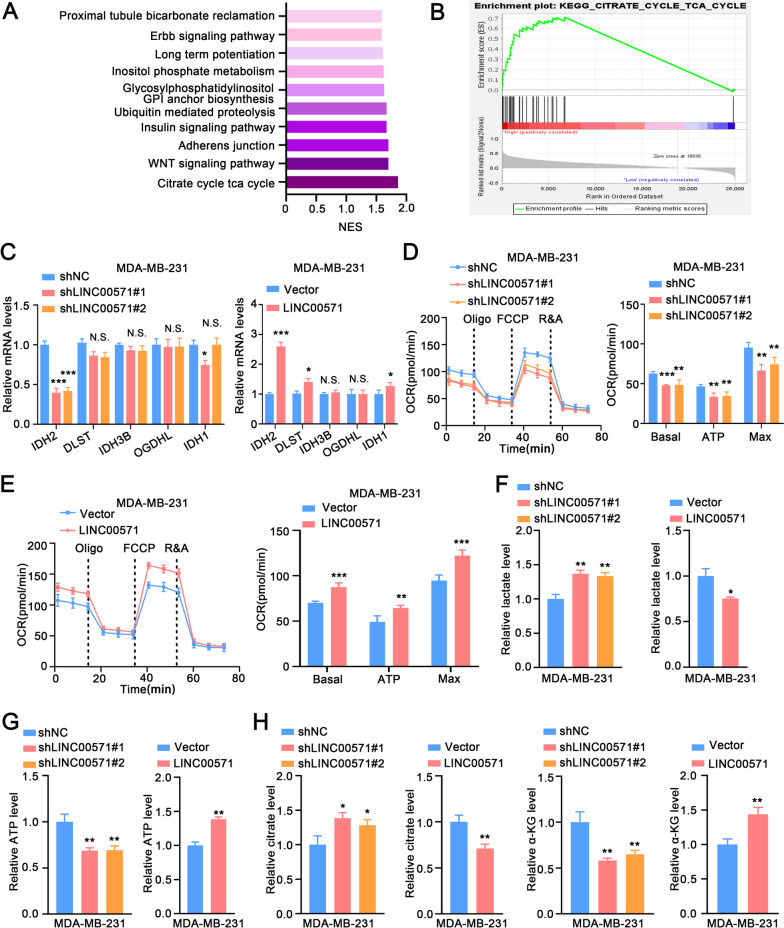
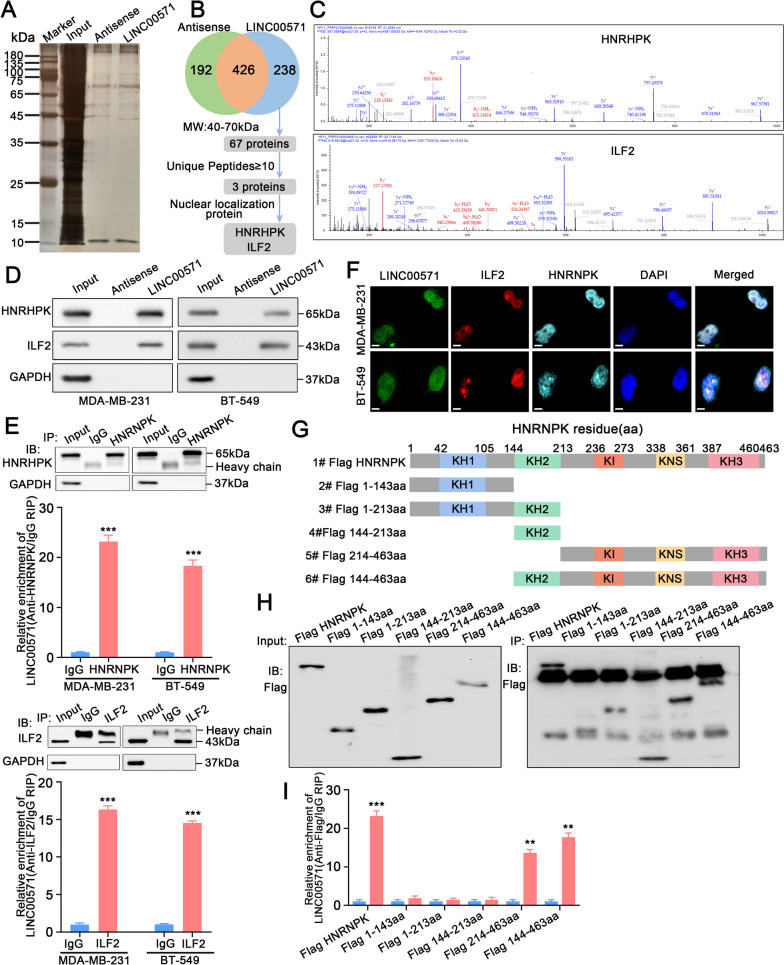
Methods: The expression levels of LINC00571 and IDH2 were determined through the analysis of the public TCGA dataset, transcriptome sequencing, qRT‒PCR, and Western blotting. The distribution of LINC00571 was assessed using RNA fluorescence in situ hybridization. Alterations in biological effects were evaluated using CCK-8, colony formation, EdU, cell cycle, and apoptosis assays and a tumor xenograft model. To elucidate the interaction between LINC00571, HNRNPK, and ILF2, RNA pull-down, mass spectrometry, coimmunoprecipitation, and RNA immunoprecipitation assays were performed. The impacts of LINC00571 and IDH2 on tricarboxylic acid cycle metabolites were investigated through measurements of the oxygen consumption rate and metabolite levels.

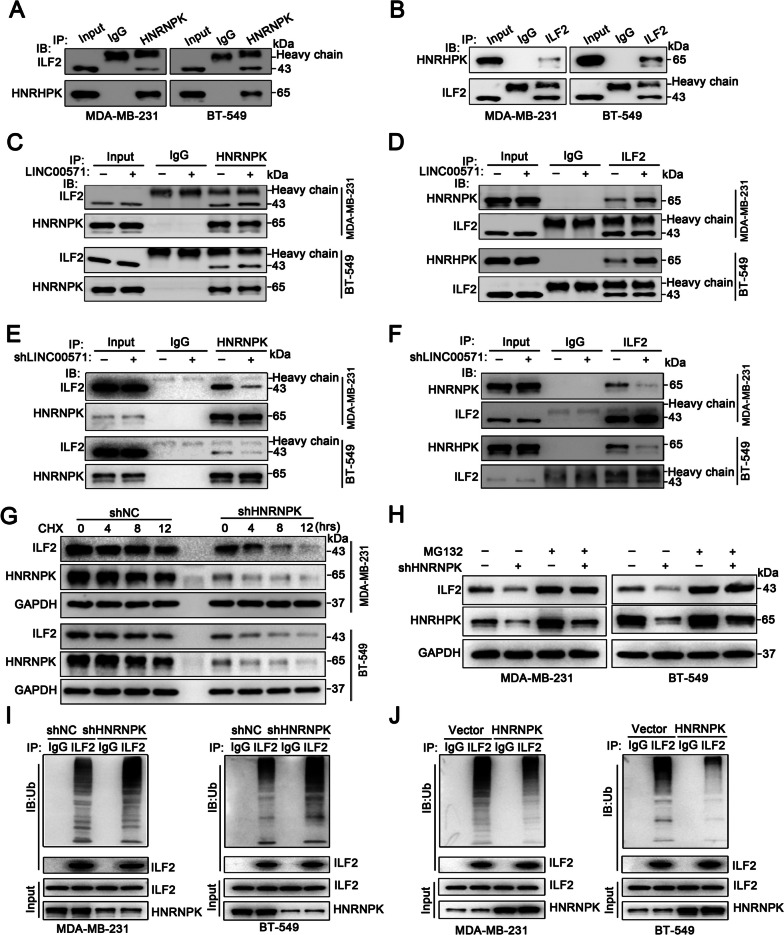
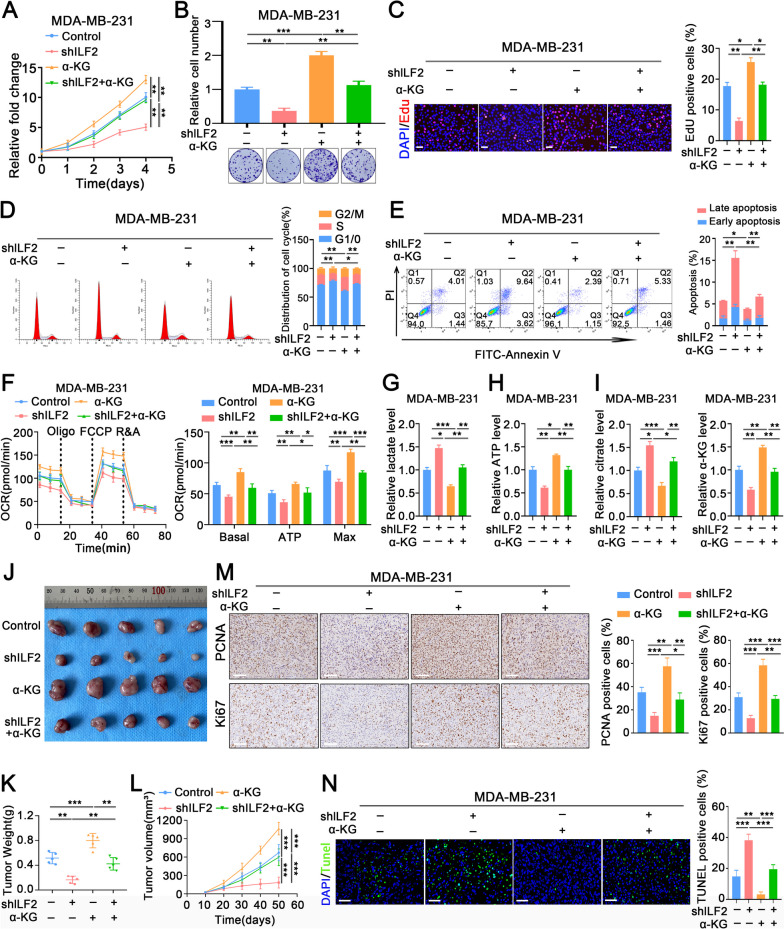
Results: This study revealed the complex interactions between a novel long non-coding RNA (LINC00571) and tricarboxylic acid cycle metabolism. We validated the tumor-promoting role of LINC00571. Mechanistically, LINC00571 facilitated the interaction between HNRNPK and ILF2, leading to reduced ubiquitination and degradation of ILF2, thereby stabilizing its expression. Furthermore, ILF2 acted as a transcription factor to enhance the expression of its downstream target gene IDH2.

Conclusions: Our study revealed that the LINC00571/HNRNPK/ILF2/IDH2 axis promoted the progression of triple-negative breast cancer by regulating tricarboxylic acid cycle metabolites. This discovery provides a novel theoretical foundation and new potential targets for the clinical treatment of triple-negative breast cancer.

Keywords: HNRNPK; IDH2; ILF2; LINC00571; Tricarboxylic acid cycle; Triple-negative breast cancer.


Conflict of interest statement

The authors declare that they have no competing interests.

Figures

Fig. 1
Fig. 1
LINC00571 is upregulated in TNBC tissues and breast cancer cell lines. A Heatmap representing the diverse expression patterns of long non-coding RNAs across five pairs of triple-negative breast cancer tissues. B Volcano plot representing the diverse expression patterns of 13 long non-coding RNAs across five pairs of triple-negative breast cancer tissues. C Venn diagram illustrating the intersection between RNA-seq data derived from 5 pairs of triple-negative breast cancer tissues and prognostic data extracted from the TCGA database for triple-negative breast cancer. D PCR analysis revealing the relative abundance of lncRNAs in human breast cancer epithelial cell lines (MCF10A) and triple-negative breast cancer (TNBC) cell lines (MDA-MB-231, BT-549). GAPDH was utilized as an internal control. E Expression level assessment of LINC00571 in triple-negative breast cancer (TNBC) compared to adjacent normal breast tissues, performed using qRT-PCR analysis. F Determination of LINC00571 nuclear and cytoplasmic distribution by qRT-PCR analysis in MDA-MB-231 and BT-549 cells, Cytoplasmic and nuclear controls were GAPDH and U6, respectively. G RNA-FISH assay revealing the cytoplasmic localization of LINC00571 within MDA-MB-231 and BT-549 cells. Positive controls for cytoplasm (18S) and nucleus (U6) were labeled with Cy3 (red), while the LINC00571 probe was labeled with FITC (green). Nuclei were counterstained with DAPI (blue). scale bar :10μm. Statistical analyses are depicted in bar graphs. Data are presented as mean ± SD from three independent experiments. Significance levels are denoted as * for p<0.05, ** for p<0.01, and *** for p<0.001, as determined by the t-test
Fig. 2
Fig. 2
LINC00571 regulates proliferation and apoptosis of TNBC cells. A-C Cellular proliferation rates were assessed using CCK-8, colony formation, and EdU assays, revealing the impact of shNC or shLINC00571 and vector or LINC00571 in MDA-MB-231 cells, n=3. scale bar: 50μm. D Flow cytometry-based cell cycle analysis conducted on MDA-MB-231 cells stained with propidium iodide (PI), n=3. E Apoptosis evaluation carried out through a flow cytometry assay on MDA-MB-231 cells stained with Annexin V (FITC) and propidium iodide (PI), n=3. F Photographs of xenograft s captured with a digital camera. MDA-MB-231 cells were subcutaneously injected into BALB/c athymic nude mice, n=5. Volume was monitored every ten days and calculated as volume = length × (width)2/2. G Immunohistochemical images showing Ki67 and PCNA staining in shNC or shLINC00571 groups (left) and vector or LINC00571 groups (right), scale bar: 100μm. Quantification of positive Ki67 and PCNA, n = 5. H Immunofluorescence images illustrating TUNEL staining in shNC or shLINC00571 groups (left) and vector or LINC00571 groups (right), scale bar: 60μm. Quantification of positive TUNEL, n = 5. Statistical analyses are depicted in bar graphs. Data are presented as mean ± SD. Significance levels are denoted as * for p<0.05, ** for p<0.01, and *** for p<0.001, as determined by the t-test
Fig. 3
Fig. 3
LINC00571 promotes the progression of TNBC by TCA signaling pathway. A Gene set enrichment analysis (GSEA) of the TCGA dataset using the TCGA dataset revealed the top 10 pathways associated with high expression of LINC00571. B GSEA plots showed a positive correlation between LINC00571 expression and the set of upregulated genes in tricarboxylic acid (TCA) cycle within triple-negative breast cancer. C PCR analysis revealed the expression profile of corresponding genes in MDA-MB-231 cells with LINC00571 knockdown (left) or LINC00571 overexpression (right), n = 3. D Left, oxygen consumption rate (OCR) was analyzed in MDA-MB-231 cells with LINC00571 knockdown (n = 4). Right, basal respiration, ATP-coupled respiration and maximal respiration (n= 4). E Left, oxygen consumption rate (OCR) was analyzed in MDA-MB-231 cells with LINC00571 overexpression (n = 4). F-G Relative lactate level (F) and relative ATP level (G) in MDA-MB-231 cells with LINC00571 knockdown (left) or LINC00571 overexpression (right) were shown, n = 3. (H) Relative lactate level (F) and relative ATP level (G) in MDA-MB-231 cells with LINC00571 knockdown (left) or LINC00571 overexpression (right) were shown, n = 3. Statistical analyses are depicted in bar graphs. Data are presented as mean ± SD. Significance levels are denoted as * for p<0.05, ** for p<0.01, and *** for p<0.001, as determined by the t-test
Fig. 4
Fig. 4
LINC00571 interacts with HNRNPK protein and ILF2 protein. A Silver staining unveiled proteins interacting with LINC00571, with biotin-labeled sense or antisense LINC00571 probes used for RNA-protein pull-down against MDA-MB-231 cell lysates. B A simplified flowchart outlined the systematic screening process used to identify proteins that interacted with LINC00571. C Mass spectrometry analysis revealed HNRNPK peptides and ILF2 peptides pulled down by LINC00571 sense probes. D Immunoblot analyses were performed for HNRNPK and ILF2 on biotin-labeled sense and antisense LINC00571 probe pull-down eluates from MDA-MB-231 and BT-549 cell lysates, with GAPDH as a loading control. E RNA immunoprecipitation (RIP) was conducted on MDA-MB-231 and BT-549 cells using HNRNPK and IgG antibody or ILF2 and IgG antibody. The precipitates underwent immunoblot analysis with HNRNPK and GAPDH antibody or ILF2 and GAPDH antibody. HNRNPK or ILF2 enrichment of LINC00571 relative to IgG enrichment values was quantified by qRT-PCR. F RNA-FISH and immunofluorescence staining assays revealed subcellular co-localization of LINC00571 (green), ILF2 (red), and HNRNPK (cyan), along with nuclear staining using DAPI (blue). scale bar: 10μm (G) Schematic representation of HNRNPK with functional protein domains. HNRNPK had been truncated within regions: 1-143aa, 1-213aa, 144-213aa, 214-463aa, and 144-463aa. H-I Relative enrichment of endogenous LINC00571 in truncated HNRNPK RIP was measured by qRT-PCR, following MDA-MB-231 cells transfected with 3xFlag-HNRNPK truncations. Statistical analyses are depicted in bar graphs. Data are presented as mean ± SD from three independent experiments. Significance levels are denoted as * for p<0.05, ** for p<0.01, and *** for p<0.001, as determined by the t-test
Fig. 5
Fig. 5
HNRNPK binds with ILF2 to promote the stabilization of ILF2. A-B Coimmunoprecipitation (Co-IP) assays were conducted using anti-HNRNPK (A) or anti-ILF2 (B) antibodies in TNBC cells, followed by immunoblot (IB) analysis for HNRNPK and ILF2. Immunoglobulin G (IgG) was utilized as a negative control antibody for immunoprecipitations. C-F Co-IP and IB assays demonstrated that LINC00571 overexpression led to an increase in the binding of HNRNPK and ILF2 (C-D), while LINC00571 knockdown resulted in decreased HNRNPK and ILF2 binding (E-F). G Immunoblot analysis depicted the cycloheximide (CHX) chase analysis of ILF2 protein degradation at indicated time points (t=0, 4, 8, 12h) in TNBC cells with or without HNRNPK. H Immunoblot analysis revealed the levels of ILF2 and HNRNPK in HNRNPK knockdown cells treated with vehicle control or MG132 (10 μM) for 12 hours in MDA-MB-231 cells (left) and BT-549 cells (right). I IP and IB demonstrated that knockdown of HNRNPK inhibited the ubiquitination of ILF2 in MDA-MB-231 cells (left) and BT-549 cells (right) treated with MG132. J IP and IB assays illustrated that overexpression of HNRNPK promoted the ubiquitination of ILF2 in MDA-MB-231 cells (left) and BT-549 cells (right) treated with MG132
Fig. 6
Fig. 6
ILF2 promoted TNBC progression by regulating the transcription of IDH2. A Correlation analysis between IDH2 and HNRNPK expression in BRCA s and normals using TCGA dataset at GEPIA. B Correlation analysis between IDH2 and ILF2 expression in BRCA tumors and normals using TCGA dataset at GEPIA. C qRT-PCR assay revealed the expression level of IDH2 in TNBC cells with HNRNPK knockdown (left) or HNRNPK overexpression (right). D Immunoblot analysis displayed the levels of IDH2, HNRNPK, and ILF2 in TNBC cells with HNRNPK knockdown (left) or HNRNPK overexpression (right), using GAPDH as a loading control. E qRT-PCR assay showcased the expression level of IDH2 in TNBC cells with ILF2 knockdown (left) or ILF2 overexpression (right). F Immunoblot analysis depicted the levels of IDH2 and ILF2 in TNBC cells with ILF2 knockdown (left) or ILF2 overexpression (right), with GAPDH as a loading control. G Immunoblot analysis displayed the levels of IDH2 in MDA-MB-231 cells co-transfected with shHNRNPK and ILF2 (left). qRT-PCR assay illustrated the expression level of IDH2 in MDA-MB-231 cells co-transfected with shHNRNPK and ILF2 (right). H Immunoblot analysis showed the levels of IDH2 in BT-549 cells co-transfected with HNRNPK and shILF2 (left). qRT-PCR assay revealed the expression level of IDH2 in BT-549 cells co-transfected with HNRNPK and shILF2 (right). I-J Impact of ILF2 overexpression (I) or knockdown (J) on luciferase activity in the IDH2 promoter region. Statistical analyses are depicted in bar graphs. Data are presented as mean ± SD from three independent experiments. Significance levels are denoted as * for p<0.05, ** for p<0.01, and *** for p<0.001, as determined by the t-test
Fig. 7
Fig. 7
The addition of α-KG rescues the phenotypes induced by ILF2 knockdown. (A-C) Proliferation rate status of MDA-MB-231 cells was assessed through CCK-8, colony formation assays, and EdU assays, n = 3. scale bar: 50μm. D Cell cycle analysis was conducted via flow cytometry, involving propidium iodide (PI) staining on MDA-MB-231 cells, n = 3. E Apoptosis detection was performed using a flow cytometry assay. Annexin V and propidium iodide (PI) staining were employed on MDA-MB-231 cells, n = 3. F Left, oxygen consumption rate (OCR) on addition of oligomycin (Oligo), fluorocarbonyl cyanide phenylhydrazone (FCCP) and rotenone plus antimycin A (R&A) (n = 4). Right, basal respiration, ATP-coupled respiration and maximal respiration (n= 4). G-H Relative lactate level (G) and relative ATP level (H) in MDA-MB-231 cells with ILF2 knockdown and α-KG supplementation were shown, n = 3. (I) Relative lactate level (left) and relative ATP level (right) in MDA-MB-231 cells with ILF2 knockdown and α-KG supplementation were shown, n = 3. J-N In vivo studies involved BALB/c athymic nude mice subcutaneously injected with MDA-MB-231 cells, n = 5. Images of xenograft s were captured using a digital camera (J). Tumor weight was measured on day 50 (K). Tumor volume was measured at ten-day intervals, calculated as volume = length × (width)2/2 (L). Immunohistochemical images showing Ki67 and PCNA staining in control, shILF2-, α-KG-, and shILF2 combined plus α-KG-treated groups. scale bar: 100μm (M). Immunofluorescence images showcased TUNEL staining in control, shILF2-, α-KG-, and shILF2 combined plus α-KG-treated groups. scale bar: 60μm (N). Statistical analyses are depicted in bar graphs. Data are presented as mean ± SD. Significance levels are denoted as * for p<0.05, ** for p<0.01, and *** for p<0.001, as determined by the t-test
Fig. 8.
Fig. 8.
LINC00571 mediates IDH2 expression to regulate the progression of TNBC cells. A-C Proliferation status of MDA-MB-231 cells co-transfected with shLINC00571 and IDH2 was assessed using CCK-8, colony formation assays, and EdU assays, n = 3. scale bar: 50μm. (D) Cell cycle analysis was conducted via flow cytometry, and MDA-MB-231 cells were stained with propidium iodide (PI), n = 3. E Apoptosis was detected using a flow cytometry assay, with Annexin V and propidium iodide (PI) staining in MDA-MB-231 cells, n = 3. F-J In vivo studies involved subcutaneous injection of MDA-MB-231 cells co-transfected with shLINC00571 and IDH2 into BALB/c athymic nude mice, n =5. Images of xenograft tumors were captured using a digital camera (F). Tumor weight was measured on day 50 (G). Tumor volume was monitored every ten days, calculated using the formula: volume = length × (width)2/2 (H). Immunohistochemical images of Ki67 and PCNA staining were conducted for control, shLINC00571-, IDH2-, and shLINC00571 combined plus IDH2-treated groups. scale bar: 100μm (I). Immunofluorescence images illustrated TUNEL staining in control, shLINC00571-, IDH2-, and shLINC00571 combined plus IDH2-treated groups. scale bar: 60μm (J). Statistical analyses are depicted in bar graphs. Data are presented as mean ± SD from three independent experiments. Significance levels are denoted as * for p<0.05, ** for p<0.01, and *** for p<0.001, as determined by the t-test
Fig. 9
Fig. 9
This illustration shows that the lncRNA LINC00571 upregulates the tricarboxylic acid cycle (TCA) in breast cancer, thereby promoting breast cancer progression through the dysregulation of IDH2 expression via the HNRNPK/IL2 axis

References

    1. Siegel RL, Miller KD, Fuchs HE, Jemal A. Cancer statistics, 2022. CA Cancer J Clin. 2022;72(1):7–33. doi: 10.3322/caac.21708. - DOI - PubMed
    1. Biswas SK, Allavena P, Mantovani A. Tumor-associated macrophages: functional diversity, clinical significance, and open questions. Semin Immunopathol. 2013;35(5):585–600. doi: 10.1007/s00281-013-0367-7. - DOI - PubMed
    1. Waks AG, Winer EP. Breast cancer treatment: a review. JAMA. 2019;321(3):288–300. doi: 10.1001/jama.2018.19323. - DOI - PubMed
    1. Lin NU, Vanderplas A, Hughes ME, Theriault RL, Edge SB, Wong YN, et al. Clinicopathologic features, patterns of recurrence, and survival among women with triple-negative breast cancer in the National Comprehensive Cancer Network. Cancer. 2012;118(22):5463–72. doi: 10.1002/cncr.27581. - DOI - PMC - PubMed
    1. Qian BZ, Pollard JW. Macrophage diversity enhances tumor progression and metastasis. Cell. 2010;141(1):39–51. doi: 10.1016/j.cell.2010.03.014. - DOI - PMC - PubMed

MeSH terms

LinkOut - more resources