. 2024 Jan 18;19(1):12.
doi: 10.1186/s13020-024-00886-1.

The SIRT1/Nrf2 signaling pathway mediates the anti-pulmonary fibrosis effect of liquiritigenin

Affiliations

The SIRT1/Nrf2 signaling pathway mediates the anti-pulmonary fibrosis effect of liquiritigenin

Qingzhong Hua et al. Chin Med. .

Abstract

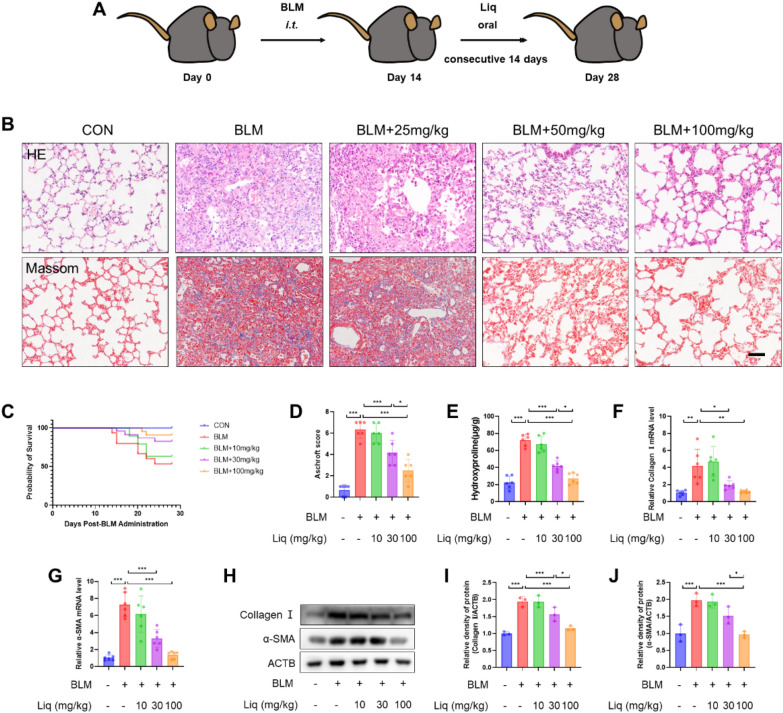
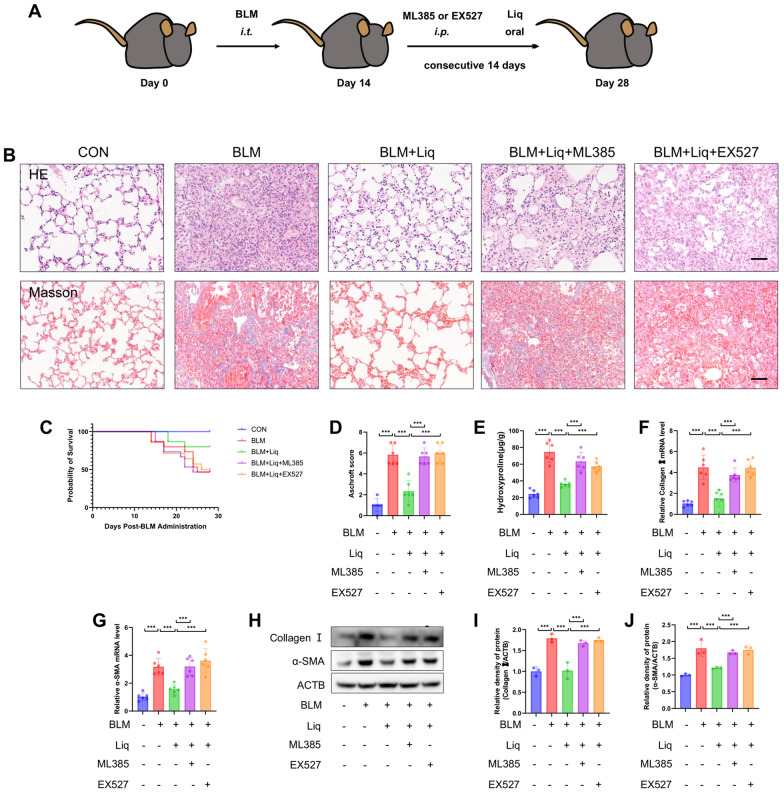
Background: At present, the treatment options available for idiopathic pulmonary fibrosis are both limited and often come with severe side effects, emphasizing the pressing requirement for innovative therapeutic alternatives. Myofibroblasts, which hold a central role in pulmonary fibrosis, have a close association with the Smad signaling pathway induced by transforming growth factor-β1 (TGF-β1) and the transformation of myofibroblasts driven by oxidative stress. Liquiritigenin, an active compound extracted from the traditional Chinese herb licorice, boasts a wide array of biomedical properties, such as anti-fibrosis and anti-oxidation. The primary objective of this study was to examine the impact of liquiritigenin on bleomycin-induced pulmonary fibrosis in mice and the underlying mechanisms.

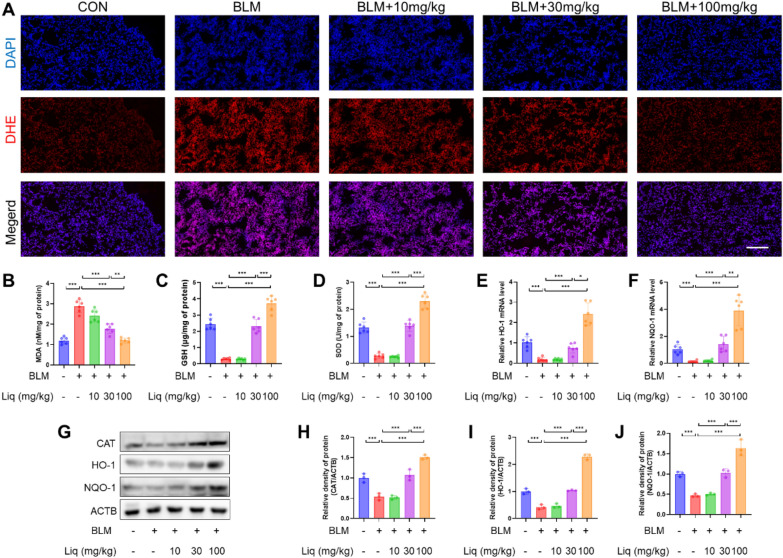
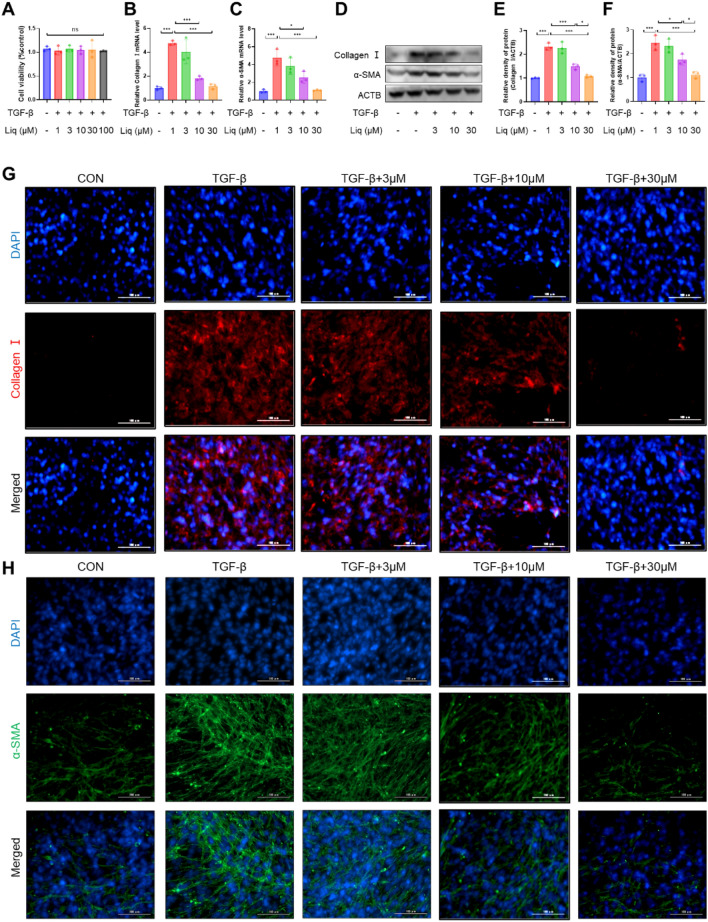
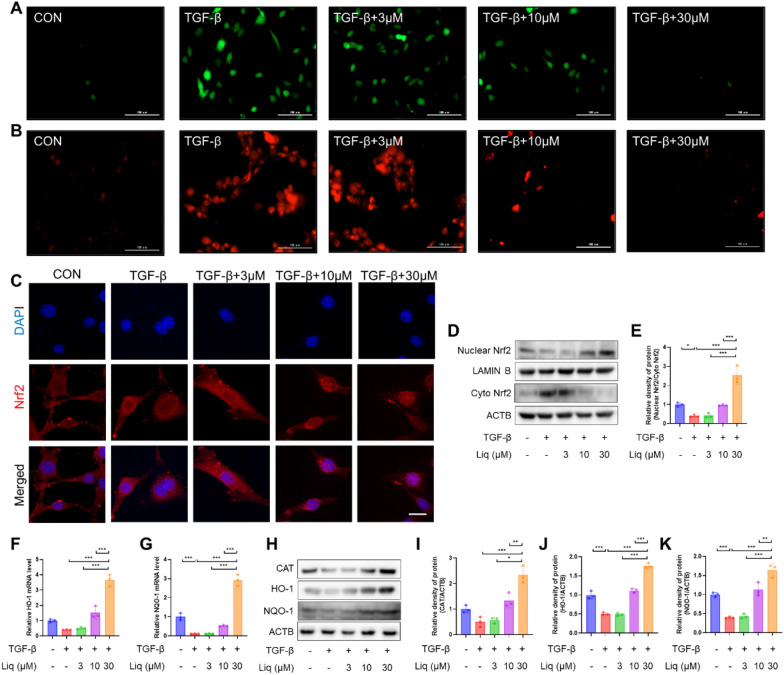
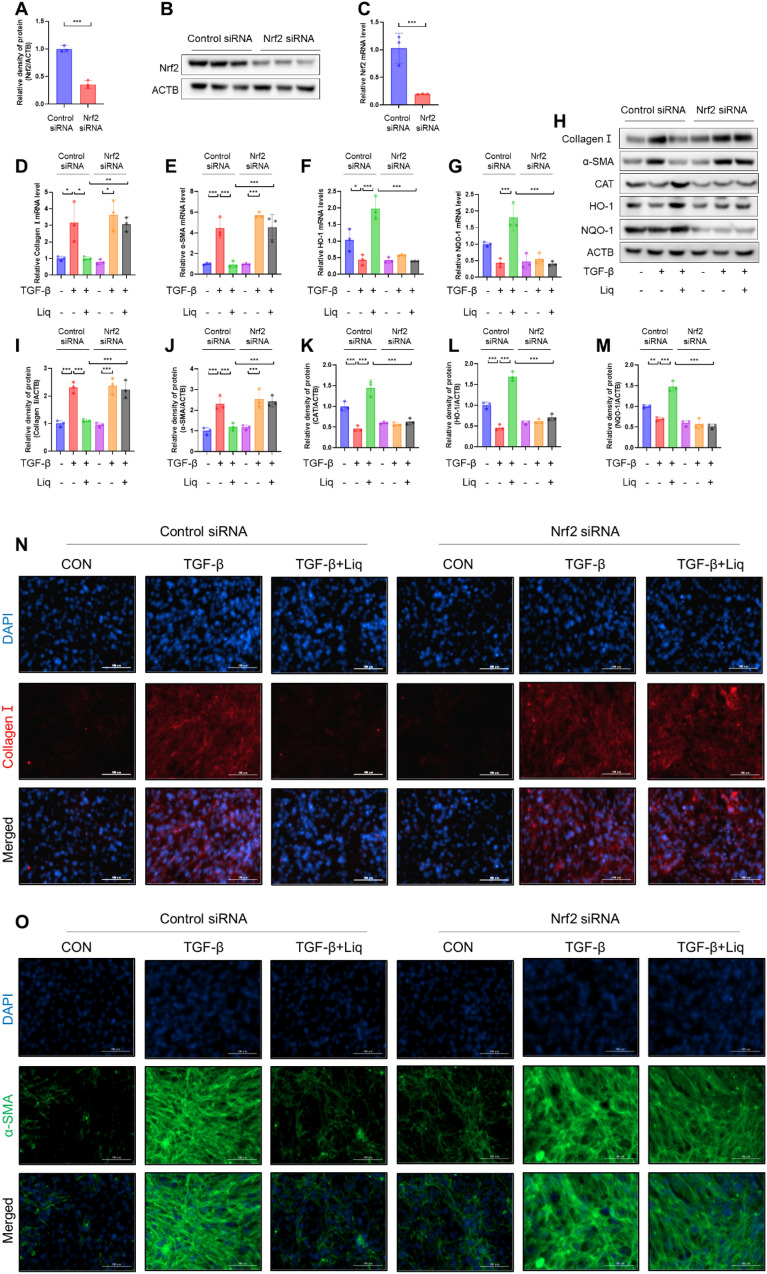
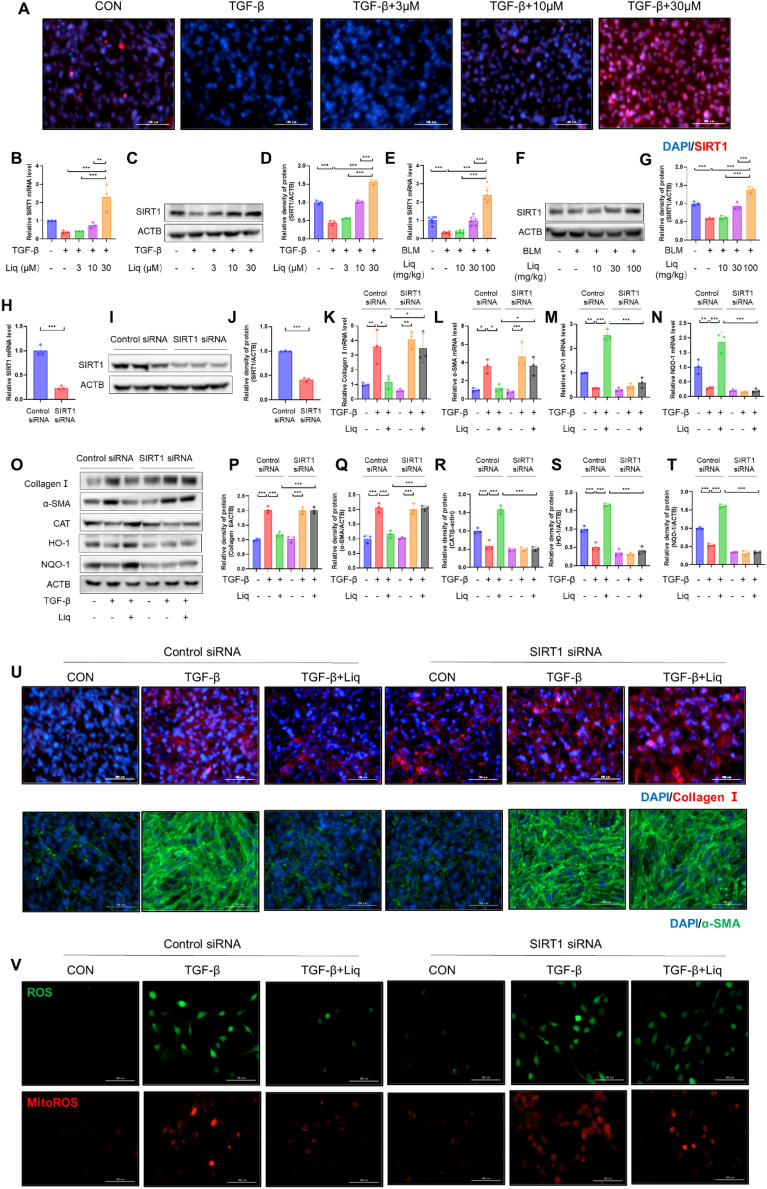
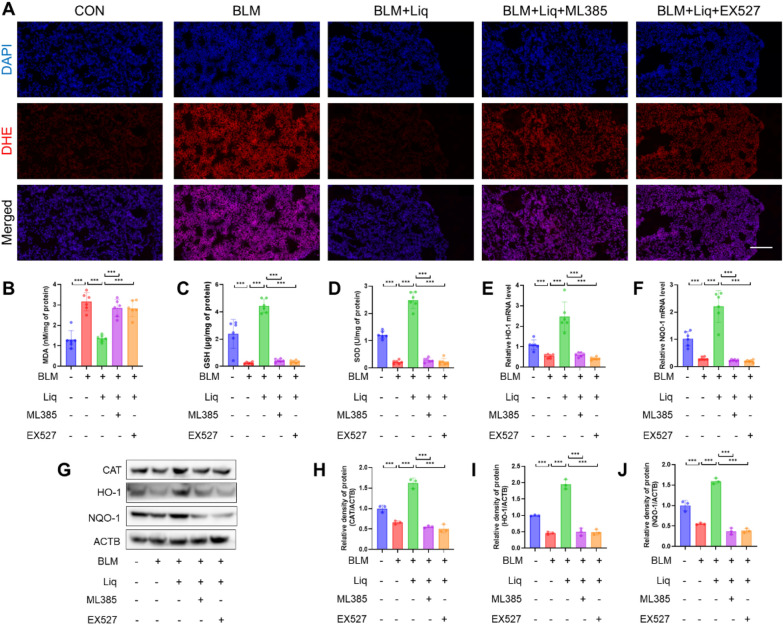
Methods: The anti-pulmonary fibrosis and anti-oxidant effects of liquiritigenin in vivo were tested by HE staining, Masson staining, DHE staining and bio-chemical methods. In vitro, primary mouse lung fibroblasts were treated with TGF-β1 with or without liquiritigenin, the effects of liquiritigenin in inhibiting differentiation of myofibroblasts and facilitating the translocation of Nrf2 were valued using Quantitative real-time polymerase chain reaction (Q-PCR), western blotting and immunofluorescence. Nrf2 siRNA and SIRT1 siRNA were used to investigate the mechanism underlies liquiritigenin's effect in inhibiting myofibroblast differentiation.

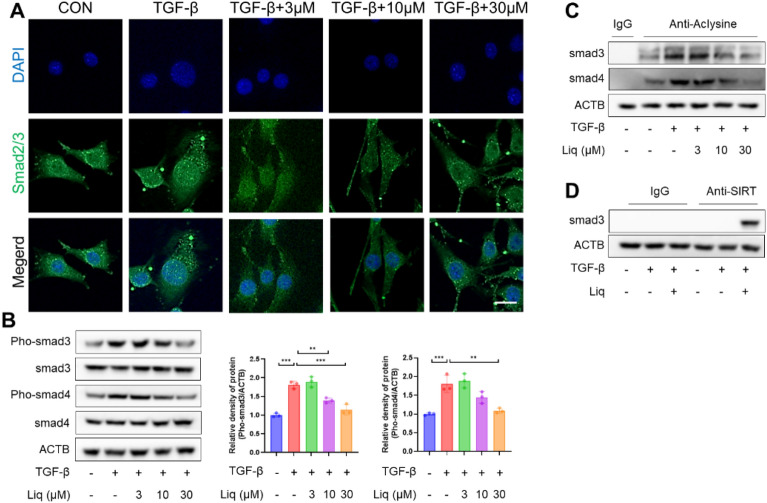
Results: Liquiritigenin displayed a dose-dependent reduction effect in bleomycin-induced fibrosis. In laboratory experiments, it was evident that liquiritigenin possessed the ability to enhance and activate sirtuin1 (SIRT1), thereby facilitating the nuclear translocation of Nrf2 and mitigating the oxidative stress-induced differentiation of primary mouse myofibroblasts. Moreover, our investigation unveiled that SIRT1 not only regulated myofibroblast differentiation via Nrf2-mediated antioxidant responses against oxidative stress but also revealed liquiritigenin's activation of SIRT1, enabling direct binding to Smad. This led to decreased phosphorylation of the Smad complex, constrained nuclear translocation, and suppressed acetylation of the Smad complex, ultimately curtailing the transcription of fibrotic factors. Validation in live subjects provided substantial evidence for the anti-fibrotic efficacy of liquiritigenin through the SIRT1/Nrf2 signaling pathway.

Conclusions: Our findings imply that targeting myofibroblast differentiation via the SIRT1/Nrf2 signaling pathway may constitute a pivotal strategy for liquiritigenin-based therapy against pulmonary fibrosis.

Keywords: Liquiritigenin; Myofibroblast differentiation; Nrf2; Oxidative stress; Pulmonary fibrosis; SIRT1.


Conflict of interest statement

The authors declare that they have no competing interests.

Figures

Fig. 1
Fig. 1
Liquiritigenin attenuates bleomycin-induced pulmonary fibrosis in mice. A To assess the impact of liquiritigenin on pulmonary fibrosis, mice were orally administered with 25 mg/kg, 50 mg/kg, and 100 mg/kg of liquiritigenin from day 15 to day 28 following intratracheal injection of bleomycin. B Lung morphology and ECM deposition were evaluated through HE and Masson staining. Scale bars represent 100 μm. C The survival curve of mice was recorded. D Scoring of pulmonary fibrosis severity in mice. E Hydroxyproline content, an indicator of fibrosis, was quantified using biochemical methods. FG mRNA levels of myofibroblast markers, collagen I, and α-SMA, were analyzed through qPCR. (H-J) Protein expression levels of collagen I and α-SMA were determined by Western blotting. Data are presented as means ± standard deviation, and all experiments were independently repeated at least three times. (*P < 0.05, **P < 0.01, ***P < 0.001)
Fig. 2
Fig. 2
Liquiritigenin mitigates bleomycin-induced pulmonary oxidative stress in Mice. A DHE staining reflects lung ROS levels. Scale bars represent 100 μm. BD Biochemical quantification of MDA and GSH levels, as well as SOD activity. E, F mRNA levels of HO-1 and NQO-1 analyzed by qPCR. GJ Protein expression levels of CAT, HO-1, and NQO-1 determined by Western blotting. Data are presented as means ± standard deviation, and all experiments were independently repeated at least three times. (*P < 0.05, **P < 0.01, ***P < 0.001)
Fig. 3
Fig. 3
Liquiritigenin blocks TGF-β1-induced myofibroblast differentiation. A A CCK-8 assay was employed to determine non-toxic concentrations of liquiritigenin for myofibroblasts. B, C qPCR analysis depicted the impact of pretreatment with liquiritigenin at 3 μM, 10 μM, 30 μM, and 100 μM for 2 h on the mRNA levels of TGF-β-induced collagen I and α-SMA. DF Protein expression levels of the myofibroblast markers collagen I and α-SMA were assessed using Western blotting. GH Immunofluorescence microscopy visualized the effect of liquiritigenin on the TGF-β1-induced increase in collagen I and α-SMA expression levels, with scale bars representing 100 μm. Data are presented as means ± standard deviation, and each experiment was independently repeated at least three times. (*P < 0.05, **P < 0.01, ***P < 0.001)
Fig. 4
Fig. 4
Liquiritigenin activates Nrf2 and reverses TGF-β1-induced oxidative stress. A H2DCFCDA probe represented ROS levels. Scale bars represent 100 μm. B MitoSOX probe represented mitochondrial ROS levels. Scale bars represent 100 μm. C Immunofluorescence microscopy observed the effect of liquiritigenin on Nrf2 nuclear translocation, with scale bars representing 50 μm. DE The impact of liquiritigenin on Nrf2 nuclear translocation was assessed through Western blotting. FG mRNA levels of HO-1 and NQO-1 analyzed by qPCR. HK Protein expression levels of CAT, HO-1, and NQO-1 determined by Western blotting. Data are presented as means ± standard deviation, and each experiment was independently repeated at least three times. (*P < 0.05, **P < 0.01, ***P < 0.001)
Fig. 5
Fig. 5
Nrf2 mediates the effects of liquiritigenin on myofibroblast differentiation. AC Efficiency of Nrf2 siRNA was assessed by qPCR analysis and Western blotting. DG qPCR analysis demonstrated the impact of liquiritigenin treatment on TGF-β1-induced myofibroblast collagen I, α-SMA, HO-1, and NQO-1 mRNA levels under control siRNA and Nrf2 siRNA conditions. (H-M) Western blotting assessed the protein expression levels of collagen I, α-SMA, CAT, HO-1, and NQO-1 in myofibroblasts treated with liquiritigenin under control siRNA and Nrf2 siRNA conditions following TGF-β1 intervention. NO Immunofluorescence microscopy displayed the effect of liquiritigenin treatment on collagen I and α-SMA expression levels in myofibroblasts under control siRNA and Nrf2 siRNA conditions following TGF-β1 intervention, with scale bars representing 100 μm. Data are presented as means ± standard deviation, and each experiment was independently repeated at least three times. (*P < 0.05, **P < 0.01, ***P < 0.001)
Fig. 6
Fig. 6
SIRT1 mediates Nrf2-induced effects of liquiritigenin on myofibroblast differentiation. AD The influence of liquiritigenin on SIRT1 expression in vitro was evaluated through qPCR analysis and Western blotting. Scale bars represent 100 μm. EG The impact of liquiritigenin on SIRT1 expression in vivo was assessed through qPCR analysis and Western blotting. HI The efficiency of SIRT1 siRNA was evaluated through qPCR analysis and Western blotting. (K-N) qPCR analysis revealed the effects of liquiritigenin treatment on myofibroblast collagen I, α-SMA, HO-1, and NQO-1 mRNA levels under control siRNA and SIRT1 siRNA conditions following TGF-β1 intervention. OT Western blotting assessed the protein expression levels of collagen I, α-SMA, CAT, HO-1, and NQO-1 in myofibroblasts treated with liquiritigenin under control siRNA and SIRT1 siRNA conditions following TGF-β1 intervention. U Immunofluorescence microscopy displayed the effect of liquiritigenin treatment on collagen I and α-SMA expression levels in myofibroblasts under control siRNA and SIRT1 siRNA conditions following TGF-β1 intervention, with scale bars representing 100 μm. V H2DCFCDA probe indicated ROS levels. MitoSOX probe indicated mitochondrial ROS levels. Scale bars represent 100 μm. Data are presented as means ± standard deviation, and each experiment was independently repeated at least three times. (*P < 0.05, **P < 0.01, ***P < 0.001)
Fig. 7
Fig. 7
Liquiritigenin activated SIRT1 suppresses phosphorylation and acetylation of Smad. A Immunofluorescence microscopy displayed the effect of liquiritigenin treatment on Smad2/3 translocation in myofibroblasts with scale bars representing 100 μm. B Protein levels of Pho-Smad3 and Pho-Smad4 were assessed using Western blotting. C Deacetylation on Smad3 and Smad4 by liquiritigenin were measured by Western blotting. D Western blotting showed the interactions between Sirt1 and Smad3. Data are presented as means ± standard deviation, and all experiments were independently repeated at least three times. (**P < 0.01, ***P < 0.001)
Fig. 8
Fig. 8
The SIRT1/Nrf2 signaling pathway mediates the effects of liquiritigenin on bleomycin-induced pulmonary fibrosis in mice. A To assess whether EX527 and ML385 influence the effects of liquiritigenin on pulmonary fibrosis induced by bleomycin, mice were orally administered with 100 mg/kg of liquiritigenin 3 h before receiving EX527 and ML385 from day 15 to day 28 following intratracheal injection of bleomycin. B Lung morphology and ECM deposition were evaluated through HE and Masson staining. Scale bars represent 100 μm. C The survival curve of mice was recorded. D Scoring of pulmonary fibrosis severity in mice. E Hydroxyproline content, an indicator of fibrosis, was quantified using biochemical methods. FG mRNA levels of myofibroblast markers, collagen I and α-SMA, were analyzed through qPCR. HJ Protein expression levels of collagen I and α-SMA were determined by Western blotting. Data are presented as means ± standard deviation, and all experiments were independently repeated at least three times. (*P < 0.05, **P < 0.01, ***P < 0.001)
Fig. 9
Fig. 9
The SIRT1/Nrf2 signaling pathway mediates the effects of liquiritigenin on bleomycin-induced pulmonary oxidative stress in mice. A DHE staining reflects lung ROS levels. Scale bars represent 100 μm. BD Biochemical quantification of MDA and GSH levels, as well as SOD activity. E, F qPCR analysis of HO-1 and NQO-1 mRNA levels. GJ Western blotting determined the protein expression levels of CAT, HO-1, and NQO-1. Data are presented as means ± standard deviation, and all experiments were independently repeated at least three times. (*P < 0.05, **P < 0.01, ***P < 0.001)

Similar articles

Cited by

References

    1. King TE, Jr, Pardo A, Selman M. Idiopathic pulmonary fibrosis. Lancet (London, England) 2011;378(9807):1949–1961. doi: 10.1016/S0140-6736(11)60052-4. - DOI - PubMed
    1. Chanda D, Otoupalova E, Smith SR, Volckaert T, De Langhe SP, Thannickal VJ. Developmental pathways in the pathogenesis of lung fibrosis. Mol Aspects Med. 2019;65:56–69. doi: 10.1016/j.mam.2018.08.004. - DOI - PMC - PubMed
    1. Somogyi V, Chaudhuri N, Torrisi SE, Kahn N, Müller V, Kreuter M. The therapy of idiopathic pulmonary fibrosis: what is next? Eur Respir Rev. 2019;28(153):190021. doi: 10.1183/16000617.0021-2019. - DOI - PMC - PubMed
    1. Mittler R. ROS are good. Trends Plant Sci. 2017;22(1):11–19. doi: 10.1016/j.tplants.2016.08.002. - DOI - PubMed
    1. Forrester SJ, Kikuchi DS, Hernandes MS, Xu Q, Griendling KK. Reactive oxygen species in metabolic and inflammatory signaling. Circ Res. 2018;122(6):877–902. doi: 10.1161/CIRCRESAHA.117.311401. - DOI - PMC - PubMed

LinkOut - more resources