. 2024 Jan 3:14:1247131.
doi: 10.3389/fimmu.2023.1247131. eCollection 2023.

Integrated analysis of single-cell RNA-seq and chipset data unravels PANoptosis-related genes in sepsis

Affiliations

Integrated analysis of single-cell RNA-seq and chipset data unravels PANoptosis-related genes in sepsis

Wei Dai et al. Front Immunol. .

Erratum in

Abstract

Background: The poor prognosis of sepsis warrants the investigation of biomarkers for predicting the outcome. Several studies have indicated that PANoptosis exerts a critical role in tumor initiation and development. Nevertheless, the role of PANoptosis in sepsis has not been fully elucidated.

Methods: We obtained Sepsis samples and scRNA-seq data from the GEO database. PANoptosis-related genes were subjected to consensus clustering and functional enrichment analysis, followed by identification of differentially expressed genes and calculation of the PANoptosis score. A PANoptosis-based prognostic model was developed. In vitro experiments were performed to verify distinct PANoptosis-related genes. An external scRNA-seq dataset was used to verify cellular localization.

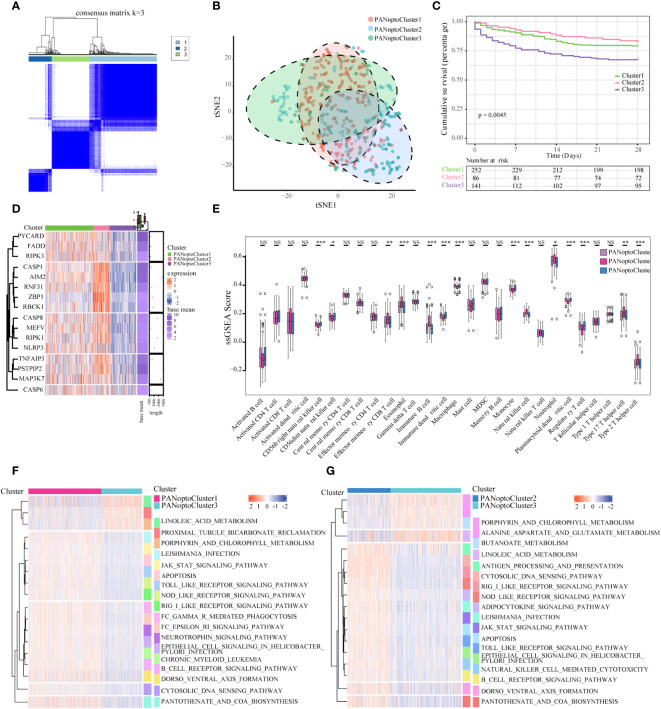
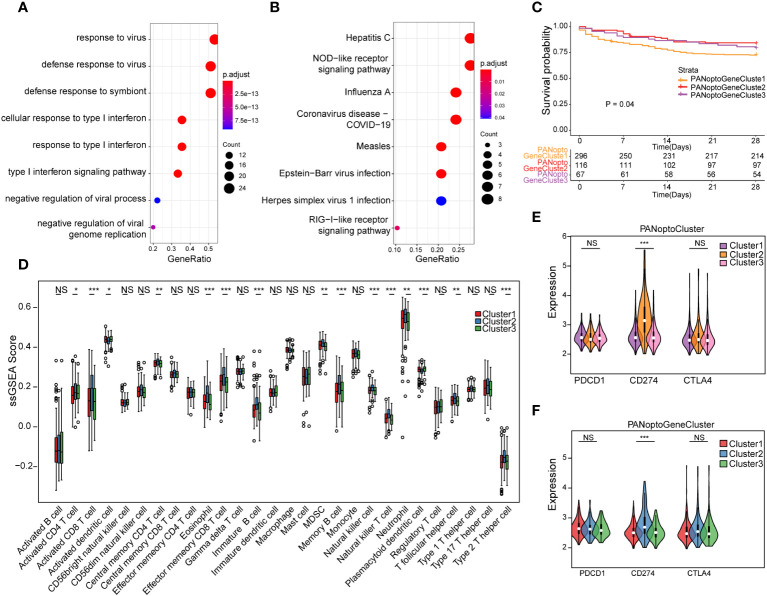
Results: Unsupervised clustering analysis using 16 PANoptosis-related genes identified three subtypes of sepsis. Kaplan-Meier analysis showed significant differences in patient survival among the subtypes, with different immune infiltration levels. Differential analysis of the subtypes identified 48 DEGs. Boruta algorithm PCA analysis identified 16 DEGs as PANoptosis-related signature genes. We developed PANscore based on these signature genes, which can distinguish different PANoptosis and clinical characteristics and may serve as a potential biomarker. Single-cell sequencing analysis identified six cell types, with high PANscore clustering relatively in B cells, and low PANscore in CD16+ and CD14+ monocytes and Megakaryocyte progenitors. ZBP1, XAF1, IFI44L, SOCS1, and PARP14 were relatively higher in cells with high PANscore.

Conclusion: We developed a machine learning based Boruta algorithm for profiling PANoptosis related subgroups with in predicting survival and clinical features in the sepsis.

Keywords: Boruta algorithm; PANoptosis; sepsis; single-cell RNA-seq; ssGSEA.


Conflict of interest statement

The authors declare that the research was conducted in the absence of any commercial or financial relationships that could be construed as a potential conflict of interest.

Figures

Figure 1
Figure 1
Flowchart of the study. The PANoptosis regulation pattern was obtained from the GEO dataset and the PANoptosis score was calculated with Machine learning method. And this score was further validated in bulk- and scRNA sequencing data.
Figure 2
Figure 2
Characterization of PANoptosis subgroups in sepsis. (A) Consensus matrix of 16 PANoptosis factors at k = 3. (B) tSNE plot of PANoptosis subgroups. (C) Comparison of survival analysis among the three subgroups, with a statistically significant difference as a whole (P=0.0045). (D) Expression of PANoptosis-related genes in different subgroups, with red indicating high expression and green indicating low expression. (E) Immune cell infiltration characteristics of different subgroups. (F, G) Results of GSVA enrichment analysis showing biological pathways and PANoptosis subtypes with different activation states, including PANoptosis Cluster1 and PANoptosis Cluster2, as well as PANoptosis Cluster2 and PANoptosis Cluster3. Heatmap: red indicates activated pathways and green indicates inhibitory pathways. Different groups are used as sample annotations. P values were determined by Student’s t-test and Kruskal-Wallis test (NS P>0.05, *P < 0.05, **P < 0.01, ***P < 0.001).
Figure 3
Figure 3
Analysis of PANoptosis genotypes. (A) GO analysis results of differential genes. (B) KEGG analysis results of differential genes. (C) Survival analysis comparison of the three PANoptosis gene subgroups, P=0.04, showing a statistically significant difference overall. (D) Immune cell infiltration characteristics of different subgroups. (E) Correlation analysis of PANoptoCluster subtypes with PDCD1, CD274 and CTLA4 immune checkpoints. (F) Correlation analysis between GeneCluster subtypes and PDCD1, CD274 and CTLA4 immune checkpoints. (NS P>0.05, *P < 0.05, **P < 0.01, ***P < 0.001).
Figure 4
Figure 4
PANoptosis score (PANscore) feature analysis. (A) Heatmap of each subtype and clinical characteristics of patients. (B) Correlation analysis between PANscore and key PANoptosis genes, where red indicates positive correlation and green indicates negative correlation. (C) PANscore comparison of different PANoptosis subgroups. (D) PANscore comparison of different PANoptosis gene subsets. (E) Expression of immune checkpoint genes in high and low PANscore groups. (F) GSEA analysis. (NS P>0.05, **P < 0.01, ***P < 0.001).
Figure 5
Figure 5
Analysis of PANoptosis score (PANscore) and clinical features of sepsis. (A) Survival curves show that patients with high PANscore have a better prognosis than patients with low scores in the sepsis dataset (p=0.027). (B) Sankey diagram showing the relationship between high and low PANscore, PANoptosis subgroups, PANoptosis gene subgroups, and survival status. (C) Forest plot showing the results of univariate Cox and multivariate Cox regressions on the sepsis dataset. (D) Nomogram constructed from the results of multivariate Cox regression on the sepsis dataset. (E) Calibration curves for the prognostic model at 7-day, 14-day and 28-day time point. (F, G) DCA curves of 14-day and 28-day prognostic models.
Figure 6
Figure 6
Association of PANoptosis score with different clinical features. (A) Comparison of gender between high and low score groups. (B) Comparison of age between high and low scoring groups. (C-F) Comparison of high and low score group stages, including diabetes (C), ICU-acquired infection (D), pneumonia category (E), and thrombocytopenia category (F).
Figure 7
Figure 7
Single-cell sequencing analysis and cellular localization of PANscore signature genes. (A) Dimensionality reduction cluster analysis; all cells from 10 samples were clustered into 41 clusters. (B) Expression of cell surface marker genes. (C) Cells are marked as B cells, CD16+ and CD14+ monocytes, CD4+ memory cells, CD8+ T cells, Megakaryocyte progenitors, and NK cells according to the surface marder genes of different cell types. (D) Percentage of PANscore signature genes in each cell. Cells were divided into high PANscore cells and low PANscore cells. E-I. Localization of IFI44 (E), IFIH1 (F), IFIT1 (G), IFIT2 (H) and RSAD2 (I) in cells.
Figure 8
Figure 8
Analysis of Hub PANoptosis Genes: mRNA Expression in NR8383 and RLE Cells and Immunofluorescence in Animal Tissue. (A–E) mRNA expression levels of Ifi44, Ifih1, Ifit1, Ifit2, and Rsad2 in NR8383 and RLE cells post-LPS treatment. (F–J) Immunofluorescence staining for IFI44, IFIH1, IFIT1, IFIT2, and RSAD2 in lung tissue sections from the animal model. (NS P>0.05, *P < 0.05, **P < 0.01, ***P < 0.001).
Figure 9
Figure 9
Analysis of Elisa for inflammatory markers after LPS treatment and si-RNA for hub genes. (A) The cell viability is assessed by OD450 nm. (B) The expression of IL-1β, IL-6 and TNF-α between LPS and LPS+si-Ifi44. (C) The expression of IL-1β, IL-6 and TNF-α between LPS and LPS+si-Ifit1. (D) The expression of IL-1β, IL-6 and TNF-α between LPS and LPS+si-Rsad2. (NS P>0.05, *P < 0.05, **P < 0.01, ***P < 0.001, ****P < 0.0001).

Similar articles

Cited by

References

    1. Singer M, Deutschman CS, Seymour CW, Shankar-Hari M, Annane D, Bauer M, et al. . The third international consensus definitions for sepsis and septic shock (Sepsis-3). JAMA (2016) 315:801–10. doi: 10.1001/jama.2016.0287 - DOI - PMC - PubMed
    1. Anggraini D, Hasni D, Amelia R. Pathogenesis of sepsis. Sci J (2022) 1:332–9. doi: 10.56260/sciena.v1i4.63 - DOI
    1. Girardot T, Rimmelé T, Venet F, Monneret G. Apoptosis-induced lymphopenia in sepsis and other severe injuries. Apoptosis (2017) 22:295–305. doi: 10.1007/s10495-016-1325-3 - DOI - PubMed
    1. Wen R, Liu Y-P, Tong X-X, Zhang T-N, Yang N. Molecular mechanisms and functions of pyroptosis in sepsis and sepsis-associated organ dysfunction. Front Cell Infection Microbiol (2022) 12:962139. doi: 10.3389/fcimb.2022.962139 - DOI - PMC - PubMed
    1. Reilly B, Tan C, Murao A, Nofi C, Jha A, Aziz M, et al. . Necroptosis-mediated eCIRP release in sepsis. JIR (2022) 15:4047–59. doi: 10.2147/JIR.S370615 - DOI - PMC - PubMed

Publication types