. 2024 Jan 3:14:1227648.
doi: 10.3389/fimmu.2023.1227648. eCollection 2023.

Impaired activation of plasmacytoid dendritic cells via toll-like receptor 7/9 and STING is mediated by melanoma-derived immunosuppressive cytokines and metabolic drift

Affiliations

Impaired activation of plasmacytoid dendritic cells via toll-like receptor 7/9 and STING is mediated by melanoma-derived immunosuppressive cytokines and metabolic drift

Matilde Monti et al. Front Immunol. .

Abstract

Introduction: Plasmacytoid dendritic cells (pDCs) infiltrate a large set of human cancers. Interferon alpha (IFN-α) produced by pDCs induces growth arrest and apoptosis in tumor cells and modulates innate and adaptive immune cells involved in anti-cancer immunity. Moreover, effector molecules exert tumor cell killing. However, the activation state and clinical relevance of pDCs infiltration in cancer is still largely controversial. In Primary Cutaneous Melanoma (PCM), pDCs density decreases over disease progression and collapses in metastatic melanoma (MM). Moreover, the residual circulating pDC compartment is defective in IFN-α production.

Methods: The activation of tumor-associated pDCs was evaluated by in silico and microscopic analysis. The expression of human myxovirus resistant protein 1 (MxA), as surrogate of IFN-α production, and proximity ligation assay (PLA) to test dsDNA-cGAS activation were performed on human melanoma biopsies. Moreover, IFN-α and CXCL10 production by in vitro stimulated (i.e. with R848, CpG-A, ADU-S100) pDCs exposed to melanoma cell lines supernatants (SN-mel) was tested by intracellular flow cytometry and ELISA. We also performed a bulk RNA-sequencing on SN-mel-exposed pDCs, resting or stimulated with R848. Glycolytic rate assay was performed on SN-mel-exposed pDCs using the Seahorse XFe24 Extracellular Flux Analyzer.

Results: Based on a set of microscopic, functional and in silico analyses, we demonstrated that the melanoma milieu directly impairs IFN-α and CXCL10 production by pDCs via TLR-7/9 and cGAS-STING signaling pathways. Melanoma-derived immunosuppressive cytokines and a metabolic drift represent relevant mechanisms enforcing pDC-mediated melanoma escape.

Discussion: These findings propose a new window of intervention for novel immunotherapy approaches to amplify the antitumor innate immune response in cutaneous melanoma (CM).

Keywords: TGF-β; cGAS-STING; glycolysis; interferon; melanoma; plasmacytoid dendritic cells; toll-like receptor; tumor microenvironment.


Conflict of interest statement

The authors declare that the research was conducted in the absence of any commercial or financial relationships that could be construed as a potential conflict of interest. The reviewer CM declared a shared affiliation with the authors VG, MO and MR to the handling editor at time of review.

Figures
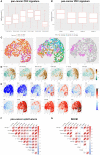
Figure 1
Figure 1
pDC and interferon-related signatures and cytokines expression across human pan-cancers solid tumors and melanoma. (A, B) Box plots representing PDC signature among different solid tumor sites (A) and stages (B) (BLCA, bladder cancer; COAD, colorectal cancer; HNSC, Head&Neck squamous cell carcinomas; LUAD, lung adenocarcinomas; LUSC, lung squamous cell carcinomas; SKCM, skin cutaneous melanomas). (C-E) UMAP plots showed expression distribution of pDC signature, I-IFNs/III-IFNs signature, IFN-α response signature (corresponding to Hallmark_Interferon Alpha Response in MSigDB), STING signature (corresponding to Reactome_STING Mediated Induction Of Host Immune Responses in MSigDB), IL-10 signaling signature (corresponding to Reactome_Interleukin 10 Signaling in MSigDB), TGF-β signaling signature (corresponding to Hallmark_TGF-β Signaling in MSigDB) (D), and expression of 12 gene transcripts encoding for pro-inflammatory and immunosuppressive cytokines (IFNA1, IFNL1, IFNG, IL1A, IL1B, IL6, IL10, TNF, TGFB1, TGFB2, PTGES2 and CSF1) (E) among different stages of primary solid tumors (I to IV) and different anatomic origins (BLCA, bladder cancer; COAD, colorectal cancer; HNSC, Head&Neck squamous cell carcinomas; LUAD, lung adenocarcinomas; LUSC, lung squamous cell carcinomas; SKCM, skin cutaneous melanomas) (C). (F, G) Correlograms showing the Spearman correlation between each signature in pan-cancer primary solid tumors (F) and SKCM (G) by exploring TCGA datasets. R coefficient is shown and ellipses indicate significant results (p < 0.05).
Figure 2
Figure 2
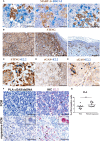
Limited MxA expression in human PCM. (A) Representative sections of lupus erythematosus (LE; upper panel) and primary cutaneous melanoma (PCM; lower panel) biopsies showing high and low levels of MxA expression, respectively. Sections are stained as label and counterstained with Haematoxylin. Magnification 100X. Scale bar 100 µm. (B) Dot plots show the percentages of MxA positive signal on evaluated area in PCM, benign nevi (NV) and LE biopsies. Bars represent the mean of biological replicates. The statistical significance was calculated by One-way ANOVA (p< 0.0001) and Bonferroni multiple comparison; ***p < 0.001. (C) Dot plots show the percentage of MxA+ marker area, obtained by digital microscopy analysis, in T1 versus T2-T4 stages of PCM. Bars represent the mean of biological replicates. The statistical significance was calculated by unpaired Student’s T test (p= 0.0411); *p < 0.05. (D) Linear regression analysis between MxA expression and BDCA2+ pDCs density in PCM. (E) Representative images of BDCA2 (left panel) and MxA (right panel) staining in a PCM case. Magnification 100X. Scale bar 200 µm.
Figure 3
Figure 3
cGAS expression and endogenous activation in PCM-infiltrating pDCs. Representative PCM cases showing (A) the interaction between BDCA2+ pDCs and Mart-1+ melanoma cells, (B) STING reactivity that results positive on PCM case and negative on adjacent normal skin (C) STING reactivity on E2.2+ pDCs and (D, E) cGAS reactivity on E2.2+ pDCs. Magnification 400X. Scale bar 50 µm (A, C, E). Magnification 100X, scale bar 200µm (B, D). (F) Representative microphotographs showing dsDNA-cGAS interactions detected by PLA (brown; left panels) combined with anti-E2.2 IHC staining (red; right panels) in PCM cases (upper panels) and PCM cases with regression (lower panels). Increased signals elements that co-express the dsDNA-cGAS interactions and E2.2 signals is observed in PCM cases with regression, identified as activated pDCs pointed by black arrowheads (zoomed in on the insert). Scale bar 50µm. (G) Scatter dot plots show the percentage of PLA positive cells evaluated in twelve non-overlapping fields at high-power magnification (400X) of PCM and PCM with regression cases. Bars represent the mean of biological replicates. The statistical significance was calculated by unpaired Student’s T test (p= 0.0068); ** p < 0.01.
Figure 4
Figure 4
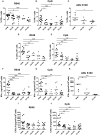
SN-mel impair the IFN-α and CXCL10/IP-10 production by pDCs. pDCs isolated from HD were exposed to SN-mel for 24 h. pDCs were stimulated with R848 for 2 h (A), 6 h (D) and 24 h (F, I) or with CpG-ODN 2216 or ADU S100 for 6 h (B, C, E) or 24 h (G, H, J). Brefeldin A was added 1 h and 4 h prior to 2 h and 6 h stimuli respectively. Both IFN-α and CXCL10 intracellular production (A-E) and secretion (F-J) were measured by flow cytometry and ELISA, respectively. Scatter dot plots show the percentage of IFN-α or CXCL10 positive cells evaluated on BDCA-2+/CD123+ pDCs (A-E) or the protein concentration per 1x10⁵ cells measured on pDC supernatants (F-J). Bars represent the mean of biological replicates. The statistical significance was calculated by One-way ANOVA (A p= 0.048; B p= 0.0007; C p= 0.0264; D p= 0.0003; E p= 0.0001; F p< 0.0001; G p= 0.002; H p=0.009; I p= 0.3; J p= 0.0012) and Bonferroni multiple comparison; * p < 0.05; ** p < 0.01; *** p < 0.001.
Figure 5
Figure 5
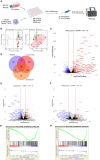
SN-mel modulates the pDC transcriptomic profile toward an immune suppressive state. (A) Graphical abstract depicts the experimental settings. Created with BioRender.com. (B) Scatter plots showing the combined projections of the first three components of a principal component analysis (PCA) run considering the whole gene expression on the SN-mel-exposed or RPMI-cultured pDCs samples resting and R848 stimulated. Samples’ features are highlighted by colour code. (C) Volcano plots showing the log2 Fold Change and -log10 p-value of differential expression among RPMI-R848 stimulated vs RPMI-CTRL unstimulated pDCs. (D) Venn diagram shows the number of upregulated genes in R848 stimulated pDCs versus unstimulated pDCs (purple) and the number of downregulated genes in unstimulated pDCs exposed to SN-mel 146 (red) and SN-mel 336 (orange) as compared to unstimulated pDCs in RPMI condition. (E, F) Volcano plots showing the log2 Fold Change and -log10 p-value of differential expression among SN-mel146-CTRL vs RPMI-CTRL (E) and SN-mel336-CTRL vs RPMI-CTRL (F) pDCs. Vertical red lines highlight a |Log2FoldChange| = 1. (G, H) Enrichment plots for the set of the interferon signaling in the transcriptome of SN-mel146 (G) and SN-mel336 (H) exposed pDCs versus RPMI cultured pDCs by GSEA.
Figure 6
Figure 6
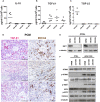
IL-10 and TGF-β production by melanoma cells and concomitant IRF7 downregulation, but preserved STING signaling, in melanoma-conditioned pDCs. IL-10 (A), TGF-β2 (B), and TGF-β1 (C) secretion by melanoma cell lines was measured by ELISA on SN-mel collected after 72 h of culture. Scatter dot plots show the concentration of cytokines per 1.5x10⁶ seeded cells. Bars represent the mean value of biological replicates (n =3-5). The statistical significance was calculated by one-way ANOVA (A p= 0.0019; B p< 0.0001; C p= 0.0508) and Bonferroni’s multiple comparison test. (D) Representative images of TGF-β RNAscope (left panels) and BDCA2 staining (right panels) in PCM cases. Magnification 200X. Scale bar 100 µm. (E) Immunoblots showing IRF7 expression in pDCs cultured in RPMI medium or SN-mel for 24 h, as labeled. α-tubulin was used as housekeeping control. (F) Immunoblots showing STING, TBK1, and IRF3 expression and their phosphorylation p-STING (Ser366), p-TBK1 (Ser172), and p-IRF3 (Ser396) in pDCs cultured in RPMI or SN-mel as labeled. Histone H3 and α-tubulin were used as housekeeping control.
Figure 7
Figure 7
SN-mel exposure reduced glycolysis in pDCs. pDCs were cultured in RPMI medium or SN-mel 336 with no stimuli for 24h. pDCs were then subjected to the Glycolytic Rate Assay and glycolytic real-time proton efflux rate (glycoPER) is derived over the indicated time points (A). Vertical lines indicate addition of R848, rotenone plus antimycin A (Rot/AA) and 2-deoxy-D-glucose (2-DG). Colors represent different healthy donors and dots represent the mean value of technical replicates. Basal glycolysis corresponds to the glycoPER value obtained at the time point before R848 injection (B); p = 0.013). Induced glycolysis is calculated on the average glycoPER values over the four time points after R848 treatment (C); p = 0.042). Compensatory glycolysis corresponds to glycoPER value measured at the third time point after Rot/AA injection (D); p = 0.056). Bars represent the mean ± SD of biological replicates (n = 5). The statistical significance was calculated by two-tailed Paired Student’s t-test; * p < 0.05.
Figure 8
Figure 8
pDCs in melanoma immune microenvironment are impaired in IFN-α production. The graphical abstract summarize data obtained from the present study on melanoma-associated pDCs. Endogenous activation of pDCs results in I-IFN and CXCL10 production, with the latter contributing to the amplification of the local T-cell infiltration. Exposure of pDCs to melanoma TME hijacks pDC functions via TGF-β and oncometabolites (i.e. increased lactic acid and reduced glucose). Specifically, the reduction of both glucose uptake and lactic acid export by pDCs impairs their proficiency to IFN-α production. Adapted from “Tumor Microenvironment”, by BioRender.com (2023). Retrieved from https://app.biorender.com/biorender-templates.

Similar articles

Cited by

References

    1. Hodi FS, O'Day SJ, McDermott DF, Weber RW, Sosman JA, Haanen JB, et al. . Improved survival with ipilimumab in patients with metastatic melanoma. N Engl J Med (2010) 363(8):711–23. doi: 10.1056/NEJMoa1003466 - DOI - PMC - PubMed
    1. Wolchok JD, Chiarion-Sileni V, Gonzalez R, Grob J-J, Rutkowski P, Lao CD, et al. . Long-term outcomes with nivolumab plus ipilimumab or nivolumab alone versus ipilimumab in patients with advanced melanoma. J Clin Oncol (2022) 40(2):127–37. doi: 10.1200/JCO.21.02229 - DOI - PMC - PubMed
    1. Curti BD, Faries MB. Recent advances in the treatment of melanoma. New Engl J Med (2021) 384(23):2229–40. doi: 10.1056/NEJMra2034861 - DOI - PubMed
    1. Eggermont A, Blank C, Mandalà M, Long G, Atkinson V, Dalle S, et al. . Adjuvant pembrolizumab versus placebo in resected stage III melanoma (EORTC 1325-MG/KEYNOTE-054): distant metastasis-free survival results from a double-blind, randomised, controlled, phase 3 trial. Lancet Oncol (2021) 22(5):643–54. doi: 10.1016/S1470-2045(21)00065-6 - DOI - PubMed
    1. Larkin J, Weber J, Del Vecchio M, Gogas H, Arance A, Dalle S, et al. . Adjuvant nivolumab versus ipilimumab (CheckMate 238 trial): Reassessment of 4-year efficacy outcomes in patients with stage III melanoma per AJCC-8 staging criteria. Eur J Cancer (2022) 173:285–96. doi: 10.1016/j.ejca.2022.06.041 - DOI - PubMed

Publication types