. 2024 Jan 4:13:1287418.
doi: 10.3389/fcimb.2023.1287418. eCollection 2023.

A peroxidase-derived ligand that induces Fusarium graminearum Ste2 receptor-dependent chemotropism

Affiliations

A peroxidase-derived ligand that induces Fusarium graminearum Ste2 receptor-dependent chemotropism

Pooja S Sridhar et al. Front Cell Infect Microbiol. .

Abstract

Introduction: The fungal G protein-coupled receptors Ste2 and Ste3 are vital in mediating directional hyphal growth of the agricultural pathogen Fusarium graminearum towards wheat plants. This chemotropism is induced by a catalytic product of peroxidases secreted by the wheat. Currently, the identity of this product, and the substrate it is generated from, are not known.

Methods and results: We provide evidence that a peroxidase substrate is derived from F. graminearum conidia and report a simple method to extract and purify the FgSte2-activating ligand for analyses by mass spectrometry. The mass spectra arising from t he ligand extract are characteristic of a 400 Da carbohydrate moiety. Consistent with this type of molecule, glycosidase treatment of F. graminearum conidia prior to peroxidase treatment significantly reduced the amount of ligand extracted. Interestingly, availability of the peroxidase substrate appears to depend on the presence of both FgSte2 and FgSte3, as knockout of one or the other reduces the chemotropism-inducing effect of the extracts.

Conclusions: While further characterization is necessary, identification of the F. graminearum-derived peroxidase substrate and the FgSte2-activating ligand will unearth deeper insights into the intricate mechanisms that underlie fungal pathogenesis in cereal crops, unveiling novel avenues for inhibitory interventions.

Keywords: GPCR; carbohydrate; chemotropism; ligand; peroxidase; plant-pathogen interaction.


Conflict of interest statement

The authors declare that the research was conducted in the absence of any commercial or financial relationships that could be construed as a potential conflict of interest.

Figures

Figure 1
Figure 1
F. graminearum conidia produce plant peroxidase substrates that are converted to FgSte2-activating ligands causing chemotropism. (A) A schematic diagram depicting the general experimental approach for extracting FgSte2-activating ligand from F. graminearum conidia and assaying its chemotropism activity is shown. (B) Directed hyphal growth of wild-type and Fgste2Δ F. graminearum strains towards a gradient of wild-type F. graminearum conidial extract was measured after 14 h of exposure. Extracts were generated by treating the indicated number of wild-type F. graminearum conidia (either 5 x 10⁵ or 1 x 10⁷) with 4 µM HRP for 1 h at room temperature. Data were analyzed with a one-way ANOVA with multiple comparisons, using the untreated wild-type extract as a control. Bars with different letters are significantly different. b, c, d compared to a, p< 0.0001. c compared to b, p< 0.01. d compared to c, p< 0.001. Data represent the average of three independent experiments. n = 500 hyphae per plate. Error bars represent standard deviation. (C) A peroxidase activity assay was performed to assessing the relative levels of hydrogen peroxide secreted by F. graminearum conidia. Reactions contained the indicated compositions and oxidization of pyrogallol was measured by absorbance at 420 nm. Data represent the average of technical duplicates from a single experiment. Data were analyzed with a one-way ANOVA with multiple comparisons, *p< 0.05, **p< 0.01. Error bars represent standard deviation.
Figure 2
Figure 2
Presence of FgSte2 and FgSte3 influence ligand extraction but do not compromise F. graminearum resistance to growth stressors. (A) Directed hyphal growth of wild-type F. graminearum towards a gradient of peroxidase-treated extracts from wild-type, Fgste2Δ and Fgste3Δ F. graminearum conidia was measured after 14 h of exposure. Extracts were generated by treating 2 x 10⁷ conidia with 40 µM HRP for 1 h at room temperature. ***p< 0.001, ****p< 0.0001, compared to WT extract. Data represent the average of three independent experiments. n = 500 hyphae per plate. Error bars indicate standard deviation. (B) Serial dilutions of the indicated strains of F. graminearum conidia were spotted onto PDA plates containing either no stressor (-ve), cell wall integrity stressor (300 µg/mL Calcofluor White; CFW), osmotic stressor (1M Sorbitol), or oxidative stressor (0.2 mM H2O2). Plates were incubated for 48 h at 25°C and imaged. One representative image for each plate is shown. Fgmgv1Δ lacking MAPK in the CWI pathway was used as a control for the CFW condition. (C) Directed hyphal growth of wild-type F. graminearum towards a gradient of HRP-treated S. cerevisiae extracts was measured after 14 h of exposure and compared to BY4741 YFL026W extract, **p< 0.01. Data represent the average of three independent experiments and were analyzed with a student’s t-test. n = 500 hyphae per plate. Error bars indicate standard deviation.
Figure 3
Figure 3
The peroxidase-generated FgSte2-activating ligand is hydrophilic and polar. (A) Directed hyphal growth of wild-type F. graminearum towards fractions collected after liquid-liquid fractionation of the peroxidase-treated wild-type F. graminearum conidial extract was measured after 14 h of exposure and compared to the unfractionated control (****p< 0.0001). Data represent the average of three independent experiments and were analyzed with a one-way ANOVA. n = 500 hyphae per plate. Error bars indicate standard deviation. H2O, aqueous; CHCl3, chloroform; EtAc, Ethyl acetate. (B) HRP-treated wild-type conidial extract was fractionated by adsorption using a C-18 cartridge and the flowthrough (FT), wash and elution were collected. Directed hyphal growth of wild-type F. graminearum towards purification fractions was measured after 14 h of exposure. Data is representative of one experiment. n = 500 hyphae per plate.
Figure 4
Figure 4
Mass spectra of HRP-treated and untreated wild-type F. graminearum conidial extracts. (A) Full (50 to 2500 m/z) and (B) zoomed in (390 to 500 m/z) mass spectra, acquired in positive ionization (ESI+) mode after flow injection are shown for undiluted HRP-treated extract with the masses of the most abundant peaks labelled in with their m/z. (C) Full (50 to 2500 m/z) and (D) zoomed in (390 to 500 m/z) mass spectra, acquired in positive ionization (ESI+) mode after flow injection is shown for the untreated extract with the masses of the most abundant peaks labelled in with their m/z. (E) Full (50 to 2000 m/z) and (F) zoomed in (100 to 1300 m/z) mass spectra, acquired in negative ionization (ESI-) mode after flow injection is shown for the 3-fold diluted HRP-treated extract with the masses of the most abundant peaks labelled in m/z. (G) Full (50 to 2000 m/z) and (H) zoomed in (100 to 1300 m/z) mass spectra, acquired in negative ionization (ESI-) mode after flow injection is shown for the 3-fold diluted untreated extract with the masses of the most abundant peaks labelled in m/z. Collision energy was set at 10 V for all analyses.
Figure 5
Figure 5
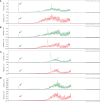
Unique masses in HRP-treated extract are present in a higher abundance than the untreated control. Extracted ion chromatograms obtained from LC-MS under positive ionization (ESI+) of HRP-treated extracts are shown for (A) 423 m/z, (B) 439 m/z, (C) 823 m/z, (D) 839 m/z. Chromatograms for HRP-treated and untreated extracts are shown in green and red, respectively.
Figure 6
Figure 6
Comparison of m/z 399 abundance in extracts from different strains. Extracted ion chromatograms for the m/z 399 species detected under ESI- conditions are shown for extracts from wild-type (WT), Fgste3Δ, Fgste2Δ, FgSte2-expressing S. cerevisiae (Sc-FgSte2) and HRP solution (-ve). Relative abundances (measured by area under the peak) of m/z 399 mass from each extract are included in parentheses. Intensities were measured relative to the wild-type (WT) extract.
Figure 7
Figure 7
Glycosidase treatment of F. graminearum conidia leads to decrease in extraction of FgSte2-activating ligand by peroxidase. (A) A schematic representation of the general structures of N- and O-linked glycosylation of proteins is shown. Cleavage sites for PNGase F (Cγ-Nδ bond between-acetylglucosamine and Asparagine residue), β-galactosidase (β-1,4-D-galactosidic bond), and sialidase (α2-3, α2-6, and α2-8 linked sialic acid residues) are shown. (B) Wild-type F. graminearum conidia were pretreated with indicated amounts of PNGase F (3.75 µg or 7.5 µg) or not treated with PNGase F (C). HRP-treated extracts were then generated from these conidia and assessed for chemotropism in wild-type F. graminearum conidia. Data represent the average of three independent experiments and were analyzed with a one-way ANOVA. n = 500 hyphae per plate. Error bars indicate standard deviation. (C) Wild-type F. graminearum conidia were pretreated with indicated combinations of β-galactosidase and sialidase. HRP-treated extracts were then generated from these conidia and assessed for chemotropism in wild-type F. graminearum conidia. Graph represents data from a single experiment. n = 500 hyphae per plate. (D) Directed hyphal growth of wild-type F. graminearum towards a gradient of 4 µM HRP, either untreated (C) or pretreated with PNGase F (PNGase F). Data represent the average of three independent experiments. n = 500 hyphae per plate. Error bars represent standard deviation. ****p < 0.0001.
Figure 8
Figure 8
Overall distribution of genes whose expression level is altered by loss of FgSte2 in F. graminearum. (A) Principal Component Analysis (PCA) and (B) Volcano plot of differential gene expression in Fgste2Δ relative to wild-type F. graminearum. Plots were obtained using DESeq2 software. (C) Genes downregulated in F. graminearum when FgSTE2 was knocked out were categorized based on biological function and represented as a pie chart. The percentage of genes in each biological function and the fraction of those genes among the total downregulated are indicated.

References

    1. Almagro L., Gómez Ros L. V., Belchi-Navarro S., Bru R., Ros Barceló A., Pedreño M. A. (2009). Class III peroxidases in plant defence reactions. J. Exp. Bot. 60, 377–390. doi: 10.1093/jxb/ern277 - DOI - PubMed
    1. Alvaro C. G., Thorner J. (2016). Heterotrimeric G protein-coupled receptor signaling in yeast mating pheromone response. J. Biol. Chem. 291, 7785–7798. doi: 10.1074/jbc.R116.714980 - DOI - PMC - PubMed
    1. Barbosa I. P., Kemmelmeier C. (1993). Chemical composition of the hyphal wall from fusarium graminearum. Exp. Mycology 17, 274–283. doi: 10.1006/emyc.1993.1026 - DOI
    1. Barkai N., Rose M. D., Wingreen N. S. (1998). Protease helps yeast find mating partners. Nature 396, 422–423. doi: 10.1038/24760 - DOI - PubMed
    1. Basenko E. Y., Pulman J. A., Shanmugasundram A., Harb O. S., Crouch K., Starns D., et al. . (2018). FungiDB: an integrated bioinformatic resource for fungi and oomycetes. J. Fungi (Basel) 4. doi: 10.3390/jof4010039 - DOI - PMC - PubMed

Publication types

Supplementary concepts

LinkOut - more resources