The corticofugal oscillatory modulation of the cochlear receptor during auditory and visual attention is preserved in tinnitus
- PMID: 38239605
- PMCID: PMC10794612
- DOI: 10.3389/fncir.2023.1301962
The corticofugal oscillatory modulation of the cochlear receptor during auditory and visual attention is preserved in tinnitus
Abstract
Introduction: The mechanisms underlying tinnitus perception are still under research. One of the proposed hypotheses involves an alteration in top-down processing of auditory activity. Low-frequency oscillations in the delta and theta bands have been recently described in brain and cochlear infrasonic signals during selective attention paradigms in normal hearing controls. Here, we propose that the top-down oscillatory activity observed in brain and cochlear signals during auditory and visual selective attention in normal subjects, is altered in tinnitus patients, reflecting an abnormal functioning of the corticofugal pathways that connect brain circuits with the cochlear receptor.
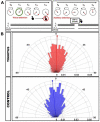
Methods: To test this hypothesis, we used a behavioral task that alternates between auditory and visual top-down attention while we simultaneously measured electroencephalogram (EEG) and distortion-product otoacoustic emissions (DPOAE) signals in 14 tinnitus and 14 control subjects.
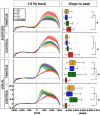
Results: We found oscillatory activity in the delta and theta bands in cortical and cochlear channels in control and tinnitus patients. There were significant decreases in the DPOAE oscillatory amplitude during the visual attention period as compared to the auditory attention period in tinnitus and control groups. We did not find significant differences when using a between-subjects statistical approach comparing tinnitus and control groups. On the other hand, we found a significant cluster in the delta band in tinnitus when using within-group statistics to compare the difference between auditory and visual DPOAE oscillatory power.
Conclusion: These results confirm the presence of top-down infrasonic low-frequency cochlear oscillatory activity in the delta and theta bands in tinnitus patients, showing that the corticofugal suppression of cochlear oscillations during visual and auditory attention in tinnitus patients is preserved.
Keywords: EEG; attention; auditory efferent; corticofugal; oscillations; tinnitus.
Copyright © 2024 Donoso-San Martín, Leiva, Dragicevic, Medel and Delano.
Conflict of interest statement
The authors declare that the research was conducted in the absence of any commercial or financial relationships that could be construed as a potential conflict of interest.
Figures


Similar articles
-
Oscillatory infrasonic modulation of the cochlear amplifier by selective attention.PLoS One. 2019 Jan 7;14(1):e0208939. doi: 10.1371/journal.pone.0208939. eCollection 2019. PLoS One. 2019. PMID: 30615632 Free PMC article.
-
Attentional modulation of the inner ear: a combined otoacoustic emission and EEG study.J Neurosci. 2014 Jul 23;34(30):9995-10002. doi: 10.1523/JNEUROSCI.4861-13.2014. J Neurosci. 2014. PMID: 25057201 Free PMC article. Clinical Trial.
-
The medial olivocochlear reflex strength is modulated during a visual working memory task.J Neurophysiol. 2021 Jun 1;125(6):2309-2321. doi: 10.1152/jn.00032.2020. Epub 2021 May 12. J Neurophysiol. 2021. PMID: 33978484
-
Role of attention in the generation and modulation of tinnitus.Neurosci Biobehav Rev. 2013 Sep;37(8):1754-73. doi: 10.1016/j.neubiorev.2013.07.007. Epub 2013 Jul 19. Neurosci Biobehav Rev. 2013. PMID: 23876286 Review.
-
Auditory sensori-neural alterations induced by salicylate.Prog Neurobiol. 2000 Dec;62(6):583-631. doi: 10.1016/s0301-0082(00)00027-7. Prog Neurobiol. 2000. PMID: 10880852 Review.
References
-
- Berens P. (2009). CircStat: A MATLAB toolbox for circular statistics. J. Stat. Softw. 31 1–21. 10.18637/jss.v031.i10 - DOI
Publication types
MeSH terms
LinkOut - more resources
Full Text Sources
Medical

