. 2024 Jan 4:14:1284648.
doi: 10.3389/fmicb.2023.1284648. eCollection 2023.

Nutrient-dependent cross-kingdom interactions in the hyphosphere of an arbuscular mycorrhizal fungus

Affiliations

Nutrient-dependent cross-kingdom interactions in the hyphosphere of an arbuscular mycorrhizal fungus

Maede Faghihinia et al. Front Microbiol. .

Abstract

Introduction: The hyphosphere of arbuscular mycorrhizal (AM) fungi is teeming with microbial life. Yet, the influence of nutrient availability or nutrient forms on the hyphosphere microbiomes is still poorly understood.

Methods: Here, we examined how the microbial community (prokaryotic, fungal, protistan) was affected by the presence of the AM fungus Rhizophagus irregularis in the rhizosphere and the root-free zone, and how different nitrogen (N) and phosphorus (P) supplements into the root-free compartment influenced the communities.

Results: The presence of AM fungus greatly affected microbial communities both in the rhizosphere and the root-free zone, with prokaryotic communities being affected the most. Protists were the only group of microbes whose richness and diversity were significantly reduced by the presence of the AM fungus. Our results showed that the type of nutrients AM fungi encounter in localized patches modulate the structure of hyphosphere microbial communities. In contrast we did not observe any effects of the AM fungus on (non-mycorrhizal) fungal community composition. Compared to the non-mycorrhizal control, the root-free zone with the AM fungus (i.e., the AM fungal hyphosphere) was enriched with Alphaproteobacteria, some micropredatory and copiotroph bacterial taxa (e.g., Xanthomonadaceae and Bacteroidota), and the poorly characterized and not yet cultured Acidobacteriota subgroup GP17, especially when phytate was added. Ammonia-oxidizing Nitrosomonas and nitrite-oxidizing Nitrospira were significantly suppressed in the presence of the AM fungus in the root-free compartment, especially upon addition of inorganic N. Co-occurrence network analyses revealed that microbial communities in the root-free compartment were complex and interconnected with more keystone species when AM fungus was present, especially when the root-free compartment was amended with phytate.

Conclusion: Our study showed that the form of nutrients is an important driver of prokaryotic and eukaryotic community assembly in the AM fungal hyphosphere, despite the assumed presence of a stable and specific AM fungal hyphoplane microbiome. Predictable responses of specific microbial taxa will open the possibility of using them as co-inoculants with AM fungi, e.g., to improve crop performance.

Keywords: arbuscular mycorrhizal (AM) fungi/al; extraradical hyphae; hyphosphere; inorganic and organic; microbiome; networks; nutrient cycling; nutrient mobilization.


Conflict of interest statement

The authors declare that the research was conducted in the absence of any commercial or financial relationships that could be construed as a potential conflict of interest.

Figures

Figure 1
Figure 1
The schematic of the experimental design. The root-free compartment was supplemented with different combinations of organic and inorganic nutrients, with the total amount being the same in all supplemented compartments.
Figure 2
Figure 2
Influence of mycorrhizal inoculation and nutrient supplement in the root-free compartment on abundance of (A) prokaryotes, (B) protists, (C) fungi, and (D) AOB as determined by qPCR. Statistically significant differences are indicated by asterisks. Asterisks indicate levels of significance; p ≤ 0.05 (*), p ≤ 0.01 (**), p ≤ 0.001 (***), and p ≤ 0.0001 (****).
Figure 3
Figure 3
Nonmetric multidimensional scaling (NMDS) ordinations of Bray-Curtis dissimilarities of microbial communities (A) Prokaryotes, (B) Protists, (C) Fungi in the root-free compartment at the operational taxonomic unit level in mycorrhizal (M) and non-mycorrhizal (NM) pots with different nutrient supplements. Ellipses indicate normal distributions of each treatment group. Stress values are indicated in the upper right corner of each plot.
Figure 5
Figure 5
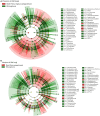
Linear discriminant analysis (LDA) effect size cladograms (LEfSe; Kruskal–Wallis (p < 0.05); Pairwise Wilcoxon (p < 0.05); logarithmic LDA score > 2.0) highlighting the prokaryotic biomarkers that differ statistically in terms of abundance between the rhizosphere and the root-free compartments in presence (A) or absence (B) of the AM fungus. The nodes radiated inside to outside represent phylogenetic levels from kingdom to genus. Taxonomic rank designations are given before the names of the microbes: “p_; c_; o_; f_; g_” stands for phylum, class, order, family or genus. The letters and numbers in the cladograms refer to the respective prokaryotic names, which can be found in the keys to the right of each cladogram. The biomarkers are represented by colored nodes and shading (red and green). The species that do not show significant differences are colored yellow.
Figure 4
Figure 4
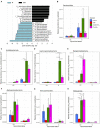
Effect of mycorrhizal inoculation and nutrient amendment into the root-free compartment on bacterial relative abundance. (A) List of differentially abundant bacterial taxa between mycorrhizal (M) and non-mycorrhizal (NM) treatments in the root-free compartment, ranked by effect size. (B–H) Differentially (M vs. NM) abundant bacterial taxa in the root-free compartment under different nutrient amendments (B: Bacteroidota, C: Acidobacteriota, D: Gammaproteobacteria, E: Betaproteobacteria, F: Alphaproteobacteria, G: Verrucomicrobia, H: Nitrospirota). Asterisks indicate levels of significance of comparison between nutrient amendment treatments withing the respective mycorrhizal inoculation treatment; p ≤ 0.05 (*), p ≤ 0.01 (**), p ≤ 0.001 (***) and p ≤ 0.0001 (****).
Figure 6
Figure 6
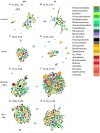
Co-occurrence networks of bacteria (purple-green), archaea (gray-black), protists (different shades of red), and fungi (yellow-brown) in the absence (A,C,E,G) or presence (B,D,F,H) of the AM fungus (Rhizophagus irregularis) under different nutrient amendment into the root-free compartment (A,B) unamended control, (C,D) amended with chitin, (E,F) amended with phytate and NH4Cl, (G,H) amended with Na2HPO4 and NH4Cl). Each network was constructed using data from four independent pots. The number of nodes (N) and edges (E) are indicated in each panel. The size of the nodes is proportional to the degree of centrality. Edges are colored by interaction type; positive (black) and negative (red) correlations. Edge thickness reflects the strength of the association. Interdependencies among taxa were determined by SparCC (Sparse Correlations for Compositional data).
Figure 7
Figure 7
Taxonomic identity of bacterial, protistan, and fungal connector nodes and their associated degree centrality in the absence (NM) or presence (M) of AM fungus Rhizophagus irregularis parsed by the type of nutrient amendment in the root-free compartment.
Figure 8
Figure 8
The schematic of the main results of the study illustrating the effects of the hyphosphere of the AM fungus Rhizophagus irregularis, modulated by the type of nutrient supplement, on prokaryotic, fungal, and protist communities. Circles represent spatially separated patches that contain different sources of organic and inorganic nutrients. The different microbial groups in the co-occurrence networks are shown with different shapes. The size of the nodes is proportional to the degree of centrality. The color of the nodes represents different microbial groups at phylum level (see Figure 6). Black numbers indicate the number of keystone taxa (connector nodes) in each network (see the list of keystone taxa in Additional File 1, Supplementary Table S7). Green numbers indicate the richness (i.e., number of OTU) of prokaryotes, orange numbers the richness of protists and dark red numbers the richness of fungi (more details in Supplementary Table S5).

References

    1. Amacker N., Gao Z., Hu J., Jousset A. L. C., Kowalchuk G. A., Geisen S. (2022). Protist feeding patterns and growth rate are related to their predatory impacts on soil bacterial communities. FEMS Microbiol. Ecol. 98:fiac057. doi: 10.1093/femsec/fiac057, PMID: - DOI - PMC - PubMed
    1. Artursson V., Finlay R. D., Jansson J. K. (2006). Interactions between arbuscular mycorrhizal fungi and bacteria and their potential for stimulating plant growth. Environ. Microbiol. 8, 1–10. doi: 10.1111/j.1462-2920.2005.00942.x, PMID: - DOI - PubMed
    1. Avrahami S., Liesack W., Conrad R. (2003). Effects of temperature and fertilizer on activity and community structure of soil ammonia oxidizers. Environ. Microbiol. 5, 691–705. doi: 10.1046/j.1462-2920.2003.00457.x, PMID: - DOI - PubMed
    1. Bastian M., Heymann S., Jacomy M., (2009). Gephi: an open source software for exploring and manipulating networks. Proceedings of the International AAAI Conference on Weblogs and Social Media, San Jose, California, USA.
    1. Beeckman F., Motte H., Beeckman T. (2018). Nitrification in agricultural soils: impact, actors and mitigation. Curr. Opin. Biotechnol. 50, 166–173. doi: 10.1016/j.copbio.2018.01.014, PMID: - DOI - PubMed

LinkOut - more resources