. 2024 Apr 15;209(8):973-986.
doi: 10.1164/rccm.202308-1321OC.

The Plasma Lipidomic Landscape in Patients with Sepsis due to Community-acquired Pneumonia

Affiliations

The Plasma Lipidomic Landscape in Patients with Sepsis due to Community-acquired Pneumonia

Osoul Chouchane et al. Am J Respir Crit Care Med. .

Abstract

Rationale: The plasma lipidome has the potential to reflect many facets of the host status during severe infection. Previous work is limited to specific lipid groups or was focused on lipids as prognosticators.Objectives: To map the plasma lipidome during sepsis due to community-acquired pneumonia (CAP) and determine the disease specificity and associations with clinical features.Methods: We analyzed 1,833 lipid species across 33 classes in 169 patients admitted to the ICU with sepsis due to CAP, 51 noninfected ICU patients, and 48 outpatient controls. In a paired analysis, we reanalyzed patients still in the ICU 4 days after admission (n = 82).Measurements and Main Results: A total of 58% of plasma lipids were significantly lower in patients with CAP-attributable sepsis compared with outpatient controls (6% higher, 36% not different). We found strong lipid class-specific associations with disease severity, validated across two external cohorts, and inflammatory biomarkers, in which triacylglycerols, cholesterol esters, and lysophospholipids exhibited the strongest associations. A total of 36% of lipids increased over time, and stratification by survival revealed diverging lipid recovery, which was confirmed in an external cohort; specifically, a 10% increase in cholesterol ester levels was related to a lower odds ratio (0.84; P = 0.006) for 30-day mortality (absolute mortality, 18 of 82). Comparison with noninfected ICU patients delineated a substantial common illness response (57.5%) and a distinct lipidomic signal for patients with CAP-attributable sepsis (37%).Conclusions: Patients with sepsis due to CAP exhibit a time-dependent and partially disease-specific shift in their plasma lipidome that correlates with disease severity and systemic inflammation and is associated with higher mortality.

Keywords: cholesterol; lipidomics; respiratory failure; sepsis; triglycerides.


Figures

Figure 1.
Figure 1.
Flow chart depicting group composition, exclusions, and comparisons between groups. CAP = community-acquired pneumonia; CAPSOD = Community Acquired Pneumonia and Sepsis Outcome Diagnostics; EARLI = Early Assessment of Renal and Lung Injury t24H = 24 hours after admission.
Figure 2.
Figure 2.
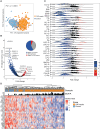
Sepsis due to community-acquired pneumonia (CAP) is associated with a major shift of the plasma lipidome. (A) Principal component (PC) analysis of the plasma lipidomes of patients with CAP-attributable sepsis (n = 169) and controls (n = 48). Each dot represents a subject, and the color indicates the group. The x-axis and y-axis show the first and second PCs with the respective percentages of explained variance. The difference between the groups on the PC analysis plot was tested by a Wilcoxon ranked sum test of the first PC coordinates. (B) The volcano plot shows the differential abundance of 1,833 lipids between patients with CAP-attributable sepsis and controls. Each dot represents a lipid species, and the color indicates significance. The difference between groups was tested using a Student’s t test comparing the Box-Cox transformed values of the lipid species. The x-axis denotes the fold change between groups, and the y-axis shows the Benjamini-Hochberg–adjusted −log10 P value, adjusted for 1,833 comparisons. The pie chart represents the whole lipidome and indicates what percentage of lipids is more abundant, less abundant, or unchanged. (C) Plasma lipidomic landscape plot comparing patients with CAP-attributable sepsis versus controls. Each dot represents an individual lipid species within its overarching lipid class (y-axis). The color of the dot indicates whether the individual lipid is significantly altered after Benjamini-Hochberg correction for all annotated lipids (white, significant; black, not significant). The x-axis represents the fold change between groups. On the edges of the plot, asterisks denote class-wide significant differences as determined by a Wilcoxon rank sum test of aggregated values per class (a sum of all lipids per class per subject). Figure E1 shows all box plots of this analysis. Asterisks on the left of the plot indicate a significant class-wide decrease (*P < 0.05, **P < 0.01, and ****P < 0.0001). (D) Unsupervised hierarchical clustering. Subjects are clustered based on the aggregated value of the different lipid classes. SOFA = Sequential Organ Failure Assessment.
Figure 3.
Figure 3.
The plasma lipidome largely recovers during an ICU stay. (A) Principal component (PC) analysis of the plasma lipidomes of patients with community-acquired pneumonia (CAP) and patients with sepsis on ICU admission and the same patients on Day 4 of the ICU stay (n = 82). Each dot represents a subject, and the color indicates the group. The x-axis and y-axis show the first and second PCs with the respective percentages of explained variance. The difference between CAP-attributable sepsis admission and Day 4 samples on the PC analysis plot was tested by a (paired) Wilcoxon signed rank test of the first PC coordinates. (B) The volcano plot shows the difference in abundance of lipids between patients with CAP-attributable sepsis on admission and after 4 days. Each dot represents a lipid species, and the color indicates significance. The difference between groups was tested using a paired Student’s t test comparing the Box-Cox–transformed (as described in Methods) values of the lipid species. The x-axis denotes the fold change between groups, and the y-axis shows the Benjamini-Hochberg–adjusted −log10 P value, adjusted for 1,833 comparisons. The pie chart represents the whole lipidome and indicates what percentage of lipids is more abundant, less abundant, or unchanged. (C) Plasma lipidomic landscape plot comparing patients with CAP-attributable sepsis at ICU admission versus their respective Day 4 samples. Each dot represents an individual lipid species within its overarching lipid class (y-axis). The color of the dot indicates whether the individual lipid is significantly altered after Benjamini-Hochberg correction for all annotated lipids (white, significant; black, not significant). The position of the dot on the x-axis represents the fold change between groups. Figure E4 shows all box plots of this analysis. Asterisks on the right of the plot indicate a significant class-wide increase (*P < 0.05, **P < 0.01, ***P < 0.001, and ****P < 0.0001). BH = Benjamini-Hochberg.
Figure 4.
Figure 4.
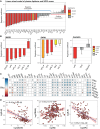
The plasma lipidome strongly correlates with disease severity. (A) Results of the linear mixed model showing the associations between Sequential Organ Failure Assessment (SOFA) scores and lipid class levels in the plasma of patients with community-acquired pneumonia and sepsis at ICU admission and Day 4. The y-axis depicts the regression coefficient of each lipid class, and the color indicates the Benjamini-Hochberg (BH)–adjusted significance (adjusted for 35 comparisons) of the association. Because there was a significant interaction between SOFA score and sampling time point for the lipid classes triacylglycerol and diacylglycerol-P, these lipid classes were treated as separate variables for each sampling day. (B) Associations between SOFA scores and lipid class levels for the lipid classes that are present in our cohort (Molecular Diagnosis and Risk Stratification of Sepsis [MARS]) and in the validation cohorts. Linear mixed models were used to calculate the regression coefficients for the MARS and Community Acquired Pneumonia and Sepsis Outcome Diagnostics (CAPSOD) cohorts in which lipid level measurements at two time points were included (MARS, admission and Day 4; CAPSOD, admission and 24 h). In the Early Assessment of Renal and Lung Injury cohort, a generalized linear model was used because lipids were measured only on admission. Significance is based on BH-adjusted P values (35 comparisons for MARS, 5 comparisons for the Early Assessment of Renal and Lung Injury study, 3 comparisons for CAPSOD). (C) Correlation plot depicting the association between plasma biomarkers of plasma systemic inflammation and plasma lipid levels (aggregated per class) of patients with community-acquired pneumonia and sepsis on ICU admission only (n = 169). The only correlations shown are those that remained significant after BH correction for 231 comparisons. The size and color indicate the strength of the correlation (Spearman’s ρ). (D) Scatter plots illustrating the correlations of IL-8 to cholesterol esters, CD163 to triacylglycerols, and IL-6 to (lyso)phospholipids. CAP = community-acquired pneumonia; Chol-E = cholesterol ester; EARLI = Early Assessment of Renal and Lung Injury; LPC = (lyso)phospholipid; LPE = lysophosphatidylethanolamine; NS = not significant; PC = phosphatidylcholine; TG = triacylglycerol.
Figure 5.
Figure 5.
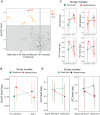
The plasma lipidome is predictive of 30-day mortality. (A) Plot illustrating the odds ratio of 30-day mortality for a 10% increase in the Δ of each lipid class (Day 4 value minus admission value) derived from a logistic regression model. The gray rectangle represents the threshold for significance, and the color represents significance of the respective lipid class. (B) Line plot showing the trend of cholesterol ester levels from ICU admission to Day 4 of the ICU stay, separated for survivors and nonsurvivors. (C) Line plot showing the trend of the other lipid classes with a significantly low odds ratio for 30-day mortality (PC-O, [lyso]phospholipid [LPS]-O, SMt, and LPA) from ICU admission to Day 4 of the ICU stay, separated for survivors and nonsurvivors. (D) Line plot showing the trend of cholesterol and LPC between admission and 24 hours after admission in the Community Acquired Pneumonia and Sepsis Outcome Diagnostics cohort, stratified into survivors and nonsurvivors. Cholesterol and LPC are depicted because these lipids demonstrate a significant relation to 30-day mortality in the MARS cohort and have been measured in the Community Acquired Pneumonia and Sepsis Outcome Diagnostics cohort (*P < 0.05 and **P < 0.01). Chol-E = cholesterol ester; LPA = lysophosphatidic acid; LPC = (lyso)phospholipid; PC-O = alkylphosphatidylcholine; SMt = hydroxysphingomyelin.
Figure 6.
Figure 6.
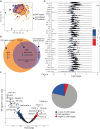
Separating lipidomic changes distinct for community-acquired pneumonia (CAP) and sepsis from a common critical illness response. (A) Principal component analysis of the plasma lipidomes of patients with CAP-attributable sepsis (n = 169) and noninfected ICU patients (n = 51). Each dot represents a subject, and the color indicates the group. The x-axis and y-axis show the first and second principal components with the respective percentages of explained variance. The difference between groups on the plot was tested by a Wilcoxon rank-sum test of the first principal component coordinates. (B) Venn diagram comparing the significantly altered lipids in patients with CAP-attributable sepsis versus noninfected ICU patients. Within the overlapping part of the response, we identified whether the lipid species were affected in the same way in both groups (up, more abundant; down, less abundant) or in opposite directions. (C) The volcano plot shows the differential abundance of lipids between patients with CAP-attributable sepsis and noninfected ICU patients. Each dot represents a lipid species, and the color indicates significance. The difference between groups was tested using a Student’s t test comparing the Box-Cox transformed values of the lipid species. The x-axis denotes the fold change between groups, and the y-axis shows the Benjamini-Hochberg–adjusted −log10 P value (adjusted for 1,833 comparisons). The pie chart represents the whole lipidome and indicates what percentage of lipids is more abundant, less abundant, or unchanged. (D) The plasma lipidomic landscape plot comparing patients with CAP-attributable sepsis versus noninfected ICU patients. Each dot represents an individual lipid species within its overarching lipid class (y-axis). The color of the dot (white, significant; black, not significant) indicates whether the individual lipid is significantly altered after Benjamini-Hochberg correction for all annotated lipids. The position of the dot on the x-axis represents the fold change between groups. On the edges of the plot, asterisks denote class-wide significant differences as determined by a Wilcoxon ranked sum test of aggregated values per class (a sum of all lipids per class per subject). Figure E6 shows all box plots of this analysis. Asterisks on the left of the plot indicate a significant class-wide decrease, and asterisks on the right of the plot indicate a significant class-wide increase. *P < 0.05, **P < 0.01, ***P < 0.001, ****P < 0.0001. BH = Benjamini-Hochberg; PC = principal component.
Figure 7.
Figure 7.
Schematic depiction of lipidomic changes in cholesterol (ester) and triglyceride pathways during severe infection. The colors of lipids depict their relation to disease severity based on our data (blue, negatively associated with disease severity; red, positively associated with disease severity; white, not present). 1) The liver synthesizes and releases apolipoprotein A-I (APO-A1). Moving through the bloodstream, APO-A1 picks up phospholipids and cholesterol (Chol) secreted by the tissues (and liver). 2) The APO-A1, Chol, and phospholipids together form nascent or discoidal high-density lipoprotein (HDL). 3) Lecithin–cholesterol acyltransferase on the surface of the nascent HDL reacts with phosphatidylcholines (PCs; from its membranes) and Chol (from the blood plasma) to form Chol esters (Chol-E) and lyso-PC (LPC) by transferring one of the fatty acids of PC to cholesterol. The newly formed Chol-E is taken up by HDL, which becomes spherical by doing so, leading to the formation of HDL3-C. 4) This mature HDL3-C is acted upon by the enzyme CETP, which leads to the exchange of Chol-E to very low-density lipoproteins, for which triacylglycerols (TGs) are gained in return. This increase of TGs content transforms the HDL to triglyceride-rich HDL2-C. 5) HDL2-C and the TG-rich lipoproteins can subsequently be transported to the liver. 6) In the liver, HDL2-C can bind SR-B1 and “empty” its Chol-E load, at which time it can be transported to the bile ducts. 7) The TG-rich lipoproteins that have endotoxins attached to their outer lipid layer are taken up in the liver. 8) The associations of lipids and inflammatory cytokines found in our dataset or described in the literature. Induction of inflammatory cytokines leads to decreased HDL levels due to decreased APO-A1 release by the liver. In addition, severe community-acquired pneumonia leads to inhibition of lipoprotein lipase, an enzyme that hydrolyzes TGs. Concomitantly, there is increased hepatic secretion of TG-rich lipoproteins. Combined, these processes lead to higher amounts of triglycerides in the blood plasma bound to lipoproteins, which are able to bind and neutralize bacterial endotoxins. The clearance of these endotoxin-neutralizing lipoproteins is stimulated by inflammatory cytokines. 9) This clearance has systemic immunomodulatory effects and local effects on the hepatic response to circulating cytokines. CAP = community-acquired pneumonia; LCAT = lecithin–cholesterol acyltransferase; VLDL = very low-density lipoprotein.

Comment in

References

    1. Torres A, Cilloniz C, Niederman MS, Menéndez R, Chalmers JD, Wunderink RG, et al. Pneumonia. Nat Rev Dis Primers . 2021;7:25. - PubMed
    1. Mayr FB, Yende S, Angus DC. Epidemiology of severe sepsis. Virulence . 2014;5:4–11. - PMC - PubMed
    1. van der Poll T, Shankar-Hari M, Wiersinga WJ. The immunology of sepsis. Immunity . 2021;54:2450–2464. - PubMed
    1. Scicluna BP, van Vught LA, Zwinderman AH, Wiewel MA, Davenport EE, Burnham KL, et al. MARS consortium Classification of patients with sepsis according to blood genomic endotype: a prospective cohort study. Lancet Respir Med . 2017;5:816–826. - PubMed
    1. Davenport EE, Burnham KL, Radhakrishnan J, Humburg P, Hutton P, Mills TC, et al. Genomic landscape of the individual host response and outcomes in sepsis: a prospective cohort study. Lancet Respir Med . 2016;4:259–271. - PMC - PubMed

Publication types