. 2024 Feb 5;223(2):e202306094.
doi: 10.1083/jcb.202306094. Epub 2024 Jan 19.

Mechanism of exportin retention in the cell nucleus

Affiliations

Mechanism of exportin retention in the cell nucleus

Larisa E Kapinos et al. J Cell Biol. .

Abstract

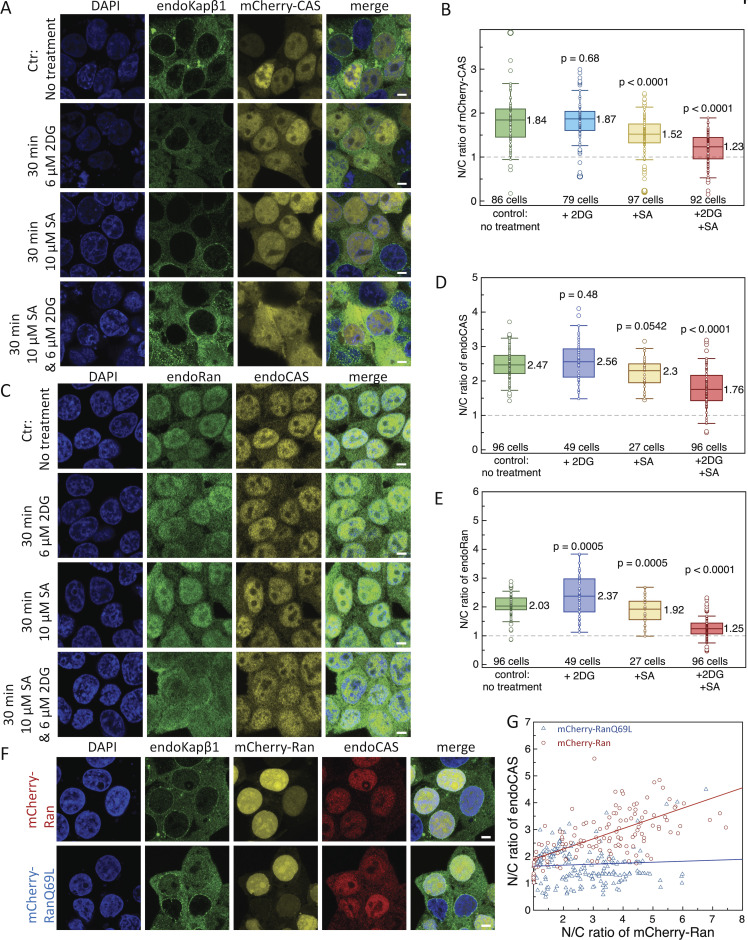
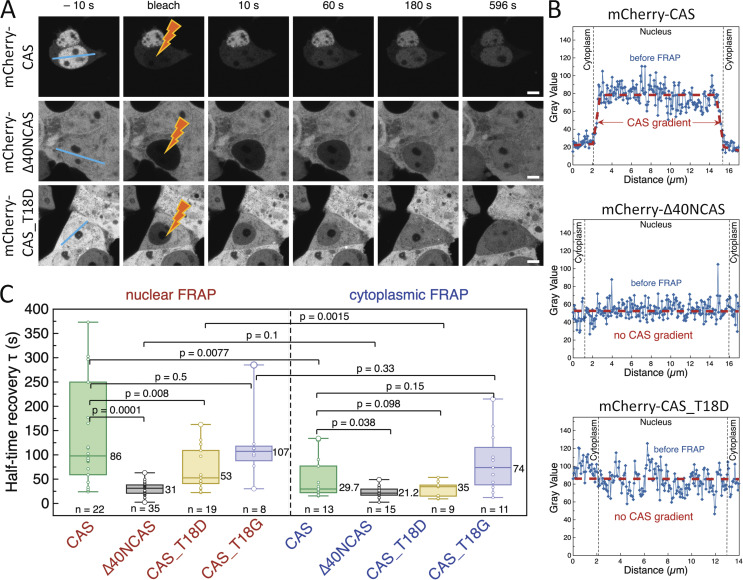
Exportin receptors are concentrated in the nucleus to transport essential cargoes out of it. A mislocalization of exportins to the cytoplasm is linked to disease. Hence, it is important to understand how their containment within the nucleus is regulated. Here, we have studied the nuclear efflux of exportin2 (cellular apoptosis susceptibility protein or CAS) that delivers karyopherinα (Kapα or importinα), the cargo adaptor for karyopherinβ1 (Kapβ1 or importinβ1), to the cytoplasm in a Ran guanosine triphosphate (RanGTP)-mediated manner. We show that the N-terminus of CAS attenuates the interaction of RanGTPase activating protein 1 (RanGAP1) with RanGTP to slow GTP hydrolysis, which suppresses CAS nuclear exit at nuclear pore complexes (NPCs). Strikingly, a single phosphomimetic mutation (T18D) at the CAS N-terminus is sufficient to abolish its nuclear retention and coincides with metastatic cellular behavior. Furthermore, downregulating Kapβ1 disrupts CAS nuclear retention, which highlights the balance between their respective functions that is essential for maintaining the Kapα transport cycle. Therefore, NPCs play a functional role in selectively partitioning exportins in the cell nucleus.


Conflict of interest statement

Disclosures: All authors have completed and submitted the ICMJE Form for Disclosure of Potential Conflicts of Interest. L.E. Kapinos reported “This work is funded by the Swiss National Science Foundation project no. 310030_201062.” R.Y.H. Lim reported “This work is funded by the Swiss National Science Foundation project no. 310030_201062.” No other disclosures were reported.

Figures

Figure 1.
Figure 1.
CAS nuclear localization involves its N-terminus. (A) CAS and Kapβ1 are asymmetrically partitioned in the nucleus and cytoplasm, respectively. Scale bar, 5 μm. (B) CAS structure adopted from Matsuura and Stewart (2004) (PDB ID: 1wa5, structure for the yeast homolog of CAS: CSE1Lp) and Cook et al. (2005) (PDB ID: 1z3h). Binding sites to RanGTP and Kapα such as HEATs 1–2 at the N-terminus (violet) and the C-loop (dark blue) are indicated. (C) Full-length CAS and truncation mutants used in this work. Binding sites for Kapα and RanGTP are indicated. (D) Immunostaining of Kapβ1 in cells expressing mCherry-CAS and associated truncation mutants. Scale bar, 5 μm. (E) N/C ratios reveal that mCherry-CAS, mCherry-CAS∆C, and mCherry-CAS∆Cloop are enriched in the nucleus but not mCherry-∆40NCAS, mCherry-∆40NCAS∆Cloop, mCherry-CASCloop, and mCherry-(1-40)NCAS. The dashed line indicates N/C = 1. Box plots denote the median, first, and third quartiles. The whiskers represent the minimum and maximum values. Number of independent experiments: N = 3. The data were tested for normality using a built-in function of GraphPad Prism software. P values were obtained using an unpaired two-tailed t test.
Figure S1.
Figure S1.
Characterization of CAS and its mutants. (A) Western blot of endoCAS and mCherry-CAS constructs expressed in HEK293T cells. All mCherry-CAS constructs were stably expressed and did not degrade. The epitope of anti-CAS is on the C-terminus of CAS, thus only CAS with non-truncated C-termini are detected. (B) Validation of CAS, CAS∆Cloop, and ∆40NCAS by SDS gel and Western blot. The fractions collected after size exclusion chromotography are indicated by a rectangle. (C) Polydispersity of CAS, CAS∆Cloop, and ∆40NCAS∆Cloop measured by mass photometry. (D) Binding of various CAS mutants with RanGTP in the presence and absence of Kapα measured by microscale thermophoresis (MST). It is worth noting that (i) preloading of Kapα to CAS inhibits subsequent RanGTP binding (left panel, solid red circles); and (ii) binding between ∆40NCAS and Kapα is enhanced. N = 3. Error bars denote standard deviation. Source data are available for this figure: SourceData FS1.
Figure 2.
Figure 2.
Equilibrium binding analysis of CAS, CAS truncation mutants, and associated transport complexes for the selection of FG Nups. Equilibrium dissociation constants (KD) describe the apparent binding affinity of each CAS complex to Nup214, Nup62, Nup98, and Nup153 (N ≥ 4). Box plots denote the median, first, and third quartiles. The whiskers represent the minimum and maximum values. Mean values are indicated below the box plots. The binding range of standalone Kapβ1 (black dashed lines) and Kapα·Kapβ1 (red dashed line) to each of the FG Nups is shown for comparison. See Kapinos et al. (2017) for details. P values were obtained using an unpaired two-tailed t test.
Figure S2.
Figure S2.
SPR-based kinetic binding analysis of various CAS complexes with FG Nups. (A) Kinetic binding maps for CAS (blue) and Kapα·CAS·RanGTP (yellow) with Nup214, Nup62, Nup98, and Nup153. N = 4–10. (B) Kinetic maps for CAS (blue), CAS∆Cloop (yellow), and ∆40NCAS (purple) binding to FG Nups. N = 4.
Figure 3.
Figure 3.
SARS-CoV-2 ORF6 sequesters Kapα to the cytoplasm but does not affect CAS nuclear retention. (A) Immunostaining of endoCAS in cells co-expressing Kapα-mCherry with eGFP-ORF6, ORF6-eGFP, or ORF6-eGFP-NES2. Scale bar, 5 μm. (B) N/C ratio showing that the localization of each ORF6 construct is largely cytoplasmic. (C) N/C ratio showing that Kapα-mCherry has a larger cytoplasmic fraction when ORF6 is present. (D) N/C ratio showing that the nuclear retention of endoCAS is largely unaffected by the sequestration of Kapα-mCherry in the cytoplasm. Dashed line indicates N/C = 1. Box plots denote the median, first, and third quartiles. The whiskers represent the minimum and maximum values. Median values are indicated next to the box plots. N = 3. The data were tested for normality using a built-in function of GraphPad Prism software. P values were obtained using an unpaired two-tailed t test.
Figure 4.
Figure 4.
Interfering with RanGTP disrupts CAS nuclear retention. (A) Immunostaining of endoKapβ1 in cells expressing mCherry-CAS in the absence and presence of SA and DG. Scale bar, 5 μm. (B) The combined use of SA and DG leads to a marked reduction of mCherry-CAS in the nucleus. (C) Immunostaining of endoRan and endoCAS in the absence and presence of SA and DG. Scale bar, 5 μm. (D and E) (D) EndoCAS and (E) endoRan are reduced in the nucleus when SA and DG are present. (F) Immunostaining of endoCAS and endoKapβ1 in cells expressing either mCherry-Ran or its non-hydrolyzable mutant mCherry-RanQ69L. Scale bar, 5 μm. (G) Scatter plot showing a correlation between the N/C ratios of endoCAS and mCherry-Ran. The N/C ratios of endoCAS and mCherry-RanQ69L are not correlated. Each data point is obtained from an individual cell. Dashed line indicates N/C = 1. Box plots denote the median, first, and third quartiles. The whiskers represent the minimum and maximum values. Median values are indicated next to the box plots. N = 3. The data were tested for normality using a built-in function of GraphPad Prism software. P values were obtained using an unpaired two-tailed t test.
Figure 5.
Figure 5.
CAS nuclear retention requires RanBP1 and RanBP2. (A) Immunostaining of endoRan and RanBP1/2 in cells expressing mCherry-CAS after silencing RanBP1 or RanBP2. Scale bar, 5 μm. (B and C) Cytoplasmic-to-nuclear (C/N) ratios of (B) endoRanBP1 and (C) (endoRanBP2) after siRNA treatment. (D) Silencing RanBP1 or RanBP2 shifts the N/C ratio of mCherry-CAS toward one. (E) N/C ratio of endoRan does not show a significant change after depleting RanBP1 and RanBP2 by siRNA. Dashed line indicates N/C = 1. Box plots denote the median, first, and third quartiles. The whiskers represent the minimum and maximum values. Median values are indicated next to the box plots. N = 3. The data were tested for normality using a built-in function of GraphPad Prism software. P values were obtained using an unpaired two-tailed t test.
Figure S3.
Figure S3.
Western blot showing the depletion of RanBP1 and RanBP2 by siRNA. (A and B) Western blot analysis for RanBP2 (A) and RanBP1 (B). GAPDH was used as a loading control. Source data are available for this figure: SourceData FS3.
Figure 6.
Figure 6.
Kapβ1 depletion leads to CAS mis-localization. (A) Steady-state distribution of endoCAS and endoKapβ1 in control MDCK cells and transfected with either scramble siRNA-Cy5 or siRNA specific for Kapβ1 (siRNA1 and siRNA2). Scale bar, 5 μm. (B) Western blot showing the depletion of Kapβ1 by siRNA1 and siRNA2. (C) N/C ratios of endoKapβ1 and endoCAS under siRNA conditions. Only cells labeled with siRNA-Cy5 were analyzed. The dashed line indicates N/C = 1. Box plots denote the median, first, and third quartiles. The whiskers represent the minimum and maximum values. (D) Immunostaining of endoRan and endoCAS in control MDCK cells and transfected with either scramble siRNA-Cy5 or siRNA specific for the Kapβ1 (siRNA1 and siRNA2). Scale bar, 5 μm. (E) N/C ratios of endoRan obtained at each of these conditions. The dashed line indicates N/C = 1. Box plots denote the median, first, and third quartiles. The whiskers represent the minimum and maximum values. N = 3 or 4 in all experiments. The data were tested for normality using a built-in function of GraphPad Prism software. P values were obtained using unpaired two-tailed t test. Source data are available for this figure: SourceData F6.
Figure S4.
Figure S4.
Phosphorylation of the CAS N-terminus reduces the nuclear retention of CAS, which colocalizes with F-actin. (A) Immunostaining of Kapβ1 in cells expressing mCherry-CAS in the presence and absence of oxidative stress (H2O2) and MEK1 inhibitor. (B) Oxidative stress reduces the N/C ratio of mCherry-CAS. This is rescued by adding MEK1 inhibitor, which has a null effect in the absence of H2O2. Box plots denote the median, first, and third quartiles. The whiskers represent the minimum and maximum values. N = 3. The data were tested for normality using a built-in function of GraphPad Prism software. P values were obtained using an unpaired two-tailed t test. (C) Representative images of HEK293T cells expressing mCherry-CAS, mCherry-CAS_T18G, or mCherry-CAS_T18D. Filamentous actin (F-actin) is stained with mEos2-Lifeact-7 peptide (Addgene 54809; green). mCherry-CAS_T18D colocalizes with F-actin at invadopodia but does not show enrichment in the nucleus. Scale bar, 5 µm.
Figure 7.
Figure 7.
A single phosphomimetic mutation (T18D) at the CAS N-terminus is sufficient to abolish its nuclear retention. (A) Immunostaining of Kapβ1 in cells expressing mCherry-CAS_T18D in the presence and absence of MEK1 inhibitor. Cells expressing mCherry-CAS_T18G, which has a neutral mutation at the same position is shown for comparison. Scale bar, 5 μm. (B) N/C ratios for mCherry-CAS_T18G and mCherry-CAS_T18D in the presence and absence of MEK1 inhibitor. The dashed line indicates N/C = 1. Box plots denote the median, first, and third quartiles. The whiskers represent the minimum and maximum values. Median values are indicated next to the box plots. N = 3 or 4. The data were tested for normality using a built-in function of GraphPad Prism software. P values were obtained using unpaired two-tailed t test. (C) Filamentous actin (F-actin) is stained using mEos2-Lifeact-7 peptide in cells expressing mCherry-CAS, mCherry-CAS_T18G, and mCherry-CAS_T18D. Only mCherry-CAS_T18D lacks retention in the nucleus and enriches with cytoplasmic micro-vesicles and invadopodia (indicated by arrows). Magnification of the bounded region (red) in Row 3 is shown in Row 4. Colocalization of F-actin and mCherryCAS_T18D gives a Pearson’s coefficient of 0.767. Scale bar, 5 µm. (D) The wound healing rate of mCherry-CAS_T18D cells (green) is the fastest overall. This is followed by mCherry-CAS (black) and mCherry-CAS_T18G (blue) cells. Non-transfected cells are shown to be slowest (red). Note: The slope of mCherry-CAS is omitted due to its similarity to mCherry-CAS_T18G. N = 3.
Figure S5.
Figure S5.
Wound healing assays. (A) Schematic description of a wound healing assay and its analysis. (B) Representative images are shown for HEK293T cells expressing mCherry-CAS, mCherry-CAS_T18G, or mCherry-CAS_T18D. Scale bar, 100 µm.
Figure 8.
Figure 8.
CAS transport kinetics reveals a distinct mechanism controlling its nuclear retention. (A) Successive image frames capture the photobleaching and fluorescence recovery of mCherry-CAS, mCherry-Δ40NCAS, and mCherry-CAS_T18D within the nucleus. Note: Only mCherry-CAS shows nuclear retention. Scale bar, 5 μm. (B) The gray value profile highlights the concentration gradient (i.e., slope) of mCherry-CAS that exists between the nucleus and cytoplasm but is absent in mCherry-Δ40NCAS and mCherry-CAS_T18D. (C) The recovery half-times for mCherry-CAS, mCherry-Δ40NCAS, mCherry-CAS_T18D, and mCherry-CAS_T18G are summarized in the boxplots for nuclear and cytoplasmic FRAP, respectively. Box plots denote the median, first, and third quartiles. The whiskers represent the minimum and maximum values. N = 3. The data were tested for normality using a built-in function of GraphPad Prism software. P values were obtained using an unpaired two-tailed t test.
Figure 9.
Figure 9.
CAS nuclear retention depends on its N-terminus interaction with RanGTP vis-à-vis SWITCHI. (A) Structure of the yeast homolog of CAS (CSE1; purple) in complex with Kap60 (yeast Kapα; green) and Gsp1pGTP (yeast RanGTP; yellow) (PDB ID: 1wa5). The T18D mutation (red arrow) at the CAS N-terminus is also indicated (see Fig. 7 and main text for details). Its conformation was modeled using the ELASPICwebserver (Witvliet et al., 2016). K67A and N68A mutations (red) on the CAS N terminus and N609A and E656A mutations (black) are shown. (B) Immunostaining of Kapβ1 in cells expressing mCherry-CAS and mCherry-CAS mutants shown. Scale bar, 5 μm. (C) N/C ratios reveal that CAS nuclear accumulation is significantly reduced for mCherry-CAS mutants carrying the K67A and N68A mutations. N608A and E658A mutations in the C-terminus of CAS have no impact on CAS nuclear localization. The dashed line indicates N/C = 1. Box plots denote the median, first, and third quartiles. The whiskers represent the minimum and maximum values. N = 3 or 4. The data were tested for normality using a built-in function of GraphPad Prism software. P values were obtained using an unpaired two-tailed t test. (D) Schematic model illustrating the closed loop of Kapβ1 and CAS that regulates Kapα nuclear import and export, respectively. CAS nuclear retention follows from a “hold” and “release” mechanism at RanGAP1. RanGTP hydrolysis is suppressed by the CAS N-terminus in the “hold” state and achieves “release” by the action of RanBP1 (or RanBP2). See text for details. SWITCH I (I) and SWITCHII (II) on RanGTP are indicated in the cartoon.

Similar articles

Cited by

References

    1. Akey, C.W., Singh D., Ouch C., Echeverria I., Nudelman I., Varberg J.M., Yu Z., Fang F., Shi Y., Wang J., et al. . 2022. Comprehensive structure and functional adaptations of the yeast nuclear pore complex. Cell. 185:361–378.e25. 10.1016/j.cell.2021.12.015 - DOI - PMC - PubMed
    1. Azmi, A.S., Uddin M.H., and Mohammad R.M.. 2021. The nuclear export protein XPO1-from biology to targeted therapy. Nat. Rev. Clin. Oncol. 10.1038/s41571-020-00442-4 - DOI - PubMed
    1. Baade, I., and Kehlenbach R.H.. 2019. The cargo spectrum of nuclear transport receptors. Curr. Opin. Cell Biol. 58:1–7. 10.1016/j.ceb.2018.11.004 - DOI - PubMed
    1. Behrens, P., Brinkmann U., and Wellmann A.. 2003. CSE1L/CAS: its role in proliferation and apoptosis. Apoptosis. 8:39–44. 10.1023/A:1021644918117 - DOI - PubMed
    1. Bischoff, F.R., and Görlich D.. 1997. RanBP1 is crucial for the release of RanGTP from importin beta-related nuclear transport factors. FEBS Lett. 419:249–254. 10.1016/S0014-5793(97)01467-1 - DOI - PubMed

Publication types

MeSH terms

Substances