. 2024 Jan 19;10(3):eadk2506.
doi: 10.1126/sciadv.adk2506. Epub 2024 Jan 19.

Global oceanic oxygenation controlled by the Southern Ocean through the last deglaciation

Affiliations

Global oceanic oxygenation controlled by the Southern Ocean through the last deglaciation

Yi Wang et al. Sci Adv. .

Abstract

Ocean dissolved oxygen (DO) can provide insights on how the marine carbon cycle affects global climate change. However, the net global DO change and the controlling mechanisms remain uncertain through the last deglaciation. Here, we present a globally integrated DO reconstruction using thallium isotopes, corroborating lower global DO during the Last Glacial Maximum [19 to 23 thousand years before the present (ka B.P.)] relative to the Holocene. During the deglaciation, we reveal reoxygenation in the Heinrich Stadial 1 (~14.7 to 18 ka B.P.) and the Younger Dryas (11.7 to 12.9 ka B.P.), with deoxygenation during the Bølling-Allerød (12.9 to 14.7 ka B.P.). The deglacial DO changes were decoupled from North Atlantic Deep Water formation rates and imply that Southern Ocean ventilation controlled ocean oxygen. The coherence between global DO and atmospheric CO2 on millennial timescales highlights the Southern Ocean's role in deglacial atmospheric CO2 rise.


Figures
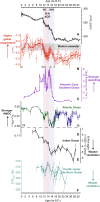
Fig. 1.
Fig. 1.. Global oceanic oxygenation reconstructions compared with global climate and ocean circulation records.
(A) Atmospheric CO2 concentrations from the Antarctic composite ice core records (54). ppm, parts per million. (B) authigenic sedimentary ε205Tl record from the core TN041-8PG/8JPC with the LOESS fit (Materials and Methods) shown in the solid red curve and the bootstrapped 2-SD envelope shown in the dashed red curve. Error bars are in 2 SD. When the measurement 2 SD is smaller than 0.3, the error bar was set to 0.3 (the long-term reproducibility of ε205Tl analyses, see Materials and Methods). 14C dates were shown in the yellow triangles. (C) Opal fluxes of TN057-13PC as an upwelling proxy in the Southern Ocean (28). (D) 231Pa/230Th activity ratios from the Bermuda Rise as an indicator of AMOC strength from the core OCE326 GGC-5 (green) (43) and ODP Site 1063 (blue) (44). The error bar represents 2 SE. The production ratio of 231Pa/230Th in the water columns is shown in the horizontal dashed line. (E) Radiocarbon age offsets between benthic foraminifera and the atmosphere (B-Atm) as a proxy for subsurface water mass ventilation from the Indian Ocean core SS172/4040 (42). The error bar is 2 SD. (F) The relative deviation (δ14R) between the deep water and the atmospheric Δ14C as an indicator for deep water ventilation from the Pacific Ocean at core MD97-2106 (47). Error bars are 1 SD. The HS1 and YD are shaded in light blue, whereas B-A/ACR is shaded in light red.
Fig. 2.
Fig. 2.. Compilation of qualitative oxygenation changes between the LGM and the Holocene from localized redox proxies.
(A) The upper ocean sites (water depth ≤ 1500 m) are denoted by solid circles, whereas the deep ocean sites (water depth > 1500 m) are represented by hollow squares. Lower, higher, and ambiguous changes in bottom water oxygenation during LGM compared to the Holocene are shown in green, blue, and gray symbols, respectively. Whenever there is an overlap, blue overlies green, which overlies the gray symbols. The studied site (TN041-8PG/8JPC) is shown in the yellow star. Base map was generated using Ocean Data View (75). (B) The number of compiled sites that show lower and higher oxygenation in LGM relative to the Holocene binned by the water depth. The bottom green arrow shows the globally integrated oceanic DO content change indicated by reconstructed seawater thallium isotopic composition change.
Fig. 3.
Fig. 3.. Pearson correlation between atmospheric pCO2 and authigenic Tl isotopic compositions.
The atmospheric pCO2 data are from (54). The Pearson correlation is statistically significant (P < 0.01). The LGM, HS1, B-A/ACR, YD, and the Holocene are denoted by green, purple, yellow, red, and blue circles, respectively.

References

    1. Jaccard S. L., Galbraith E. D., Martínez-Garciá A., Anderson R. F., Covariation of deep Southern Ocean oxygenation and atmospheric CO2 through the last ice age. Nature 530, 207–210 (2016). - PubMed
    1. Jaccard S. L., Galbraith E. D., Large climate-driven changes of oceanic oxygen concentrations during the last deglaciation. Nat. Geosci. 5, 151–156 (2012).
    1. Jacobel A. W., Anderson R. F., Jaccard S. L., McManus J. F., Pavia F. J., Winckler G., Deep Pacific storage of respired carbon during the last ice age: Perspectives from bottom water oxygen reconstructions. Quat. Sci. Rev. 230, 106065 (2020).
    1. Zhou Y., McManus J. F., Authigenic uranium deposition in the glacial North Atlantic: Implications for changes in oxygenation, carbon storage, and deep water-mass geometry. Quat. Sci. Rev. 300, 107914 (2023).
    1. Deutsch C., Brix H., Ito T., Frenzel H., Thompson L. A., Climate-forced variability of ocean hypoxia. Science 333, 336–339 (2011). - PubMed