. 2024 Jan 19;10(3):eadg1222.
doi: 10.1126/sciadv.adg1222. Epub 2024 Jan 19.

Engineered cocultures of iPSC-derived atrial cardiomyocytes and atrial fibroblasts for modeling atrial fibrillation

Affiliations

Engineered cocultures of iPSC-derived atrial cardiomyocytes and atrial fibroblasts for modeling atrial fibrillation

Grace E Brown et al. Sci Adv. .

Abstract

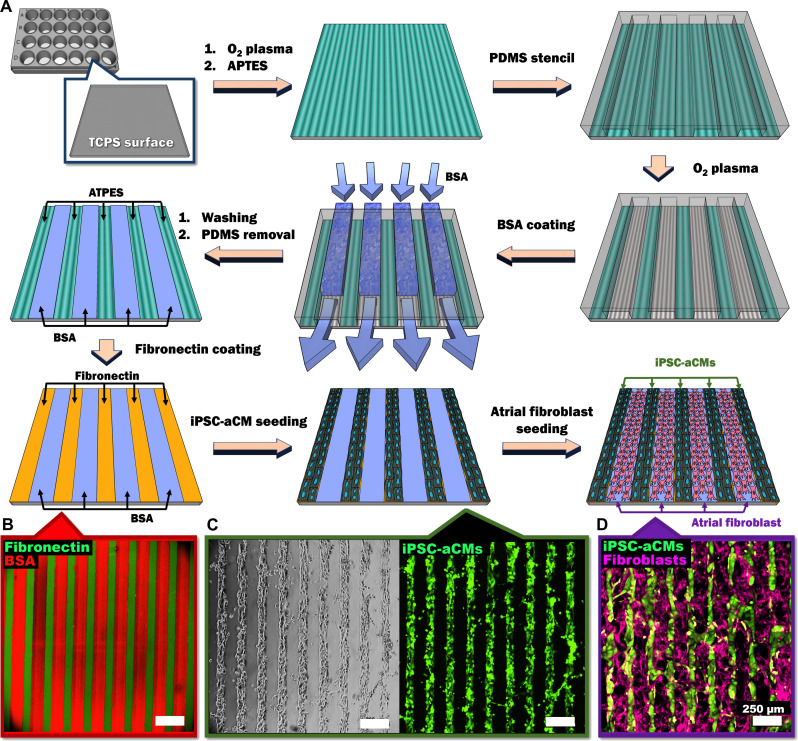
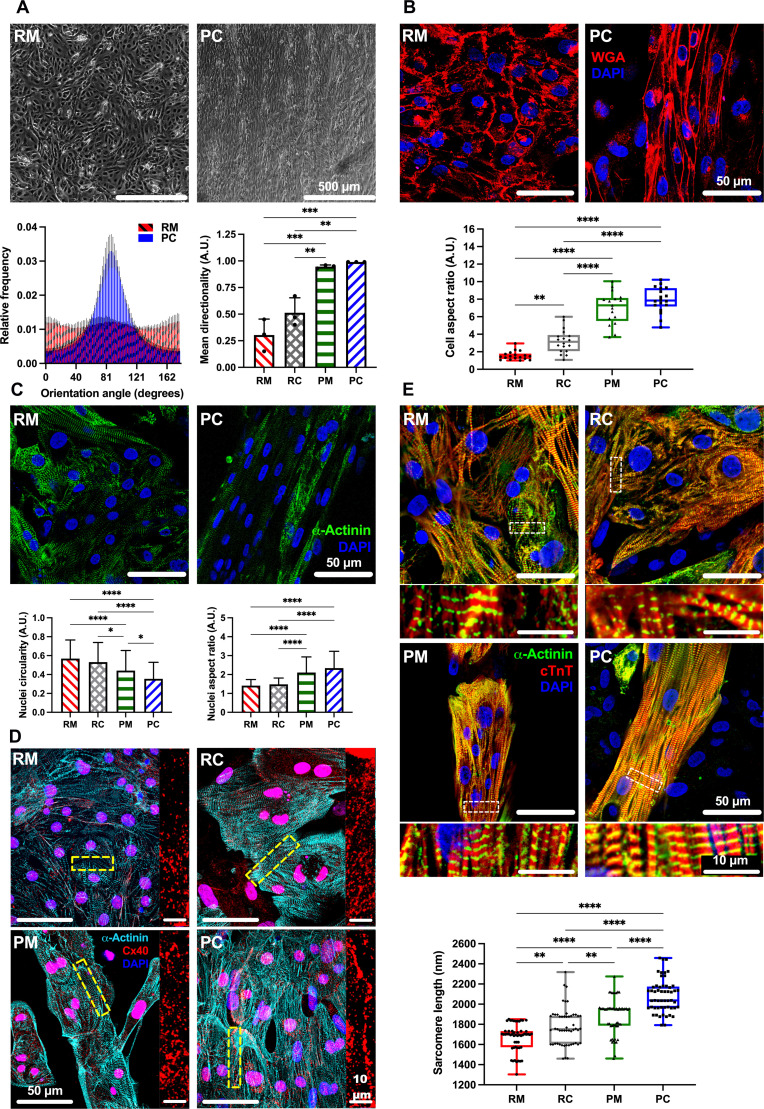
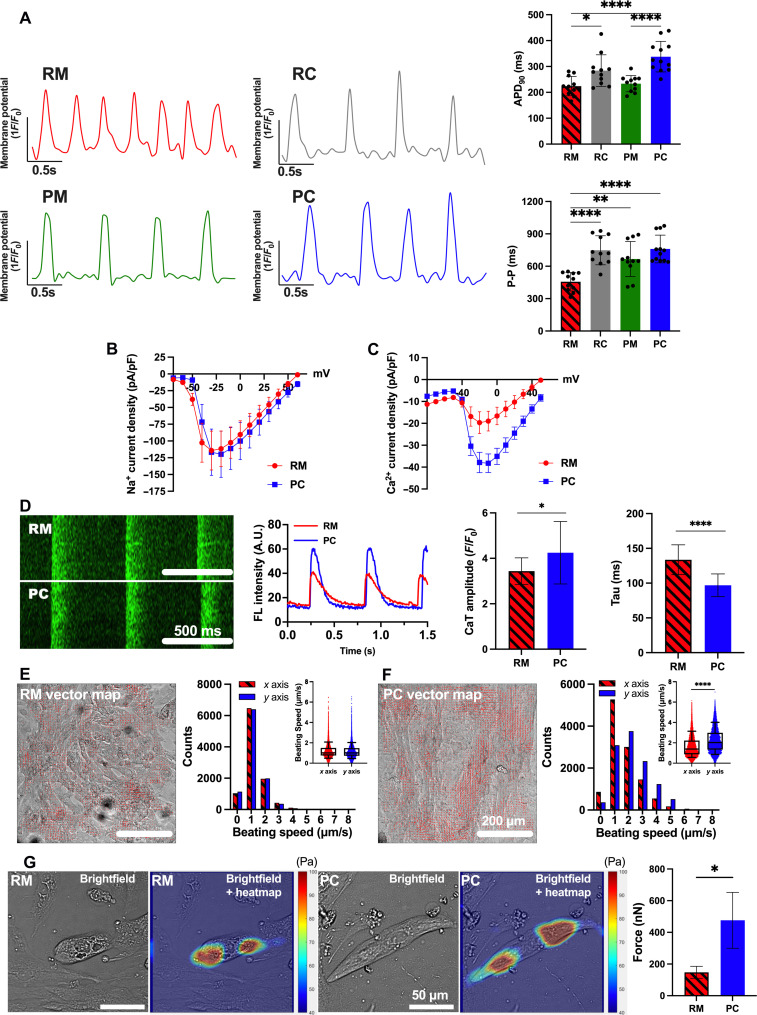
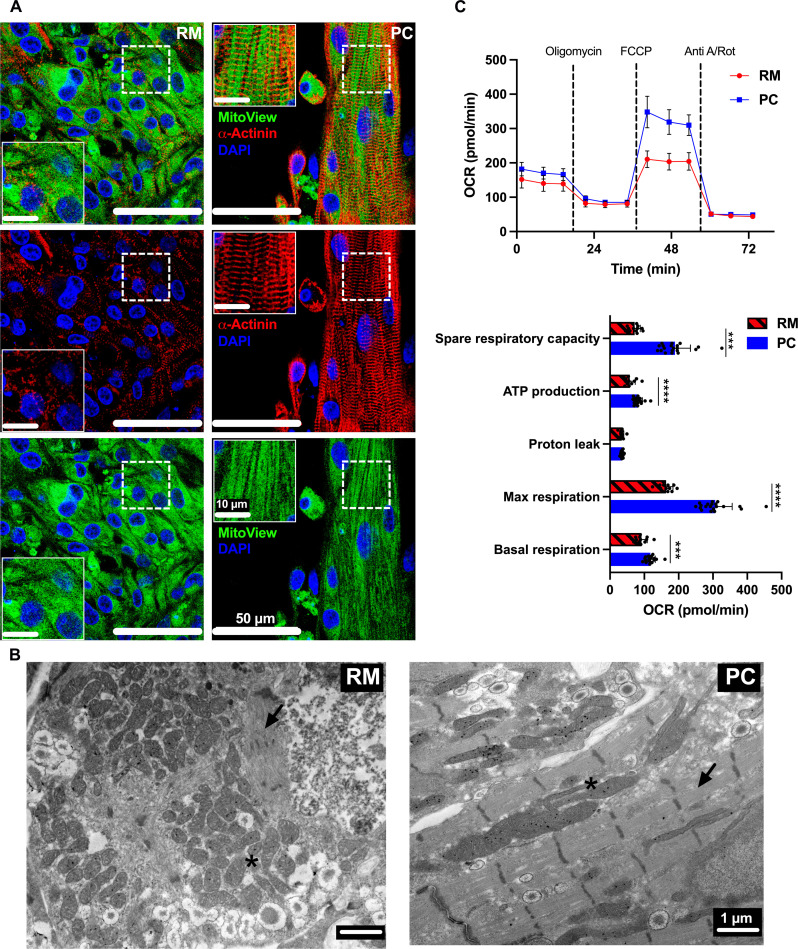
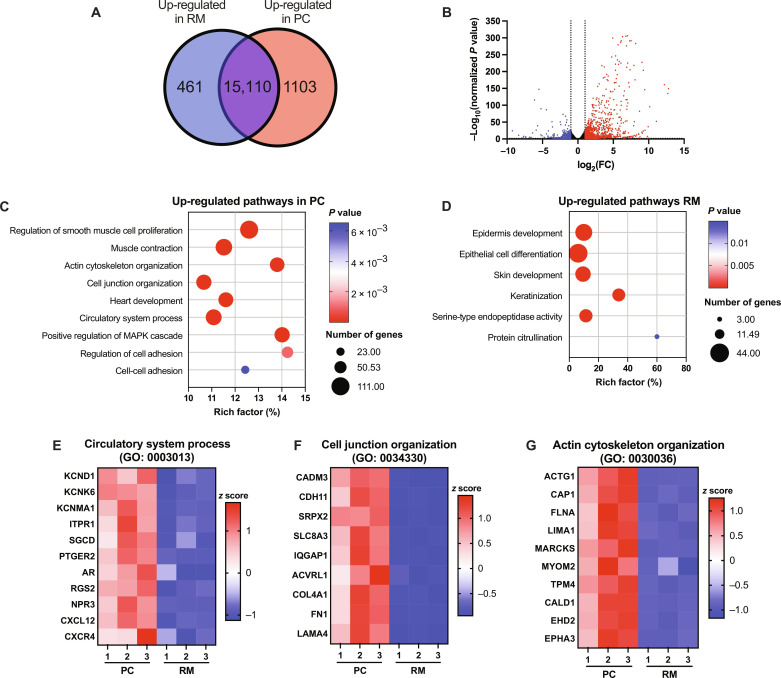
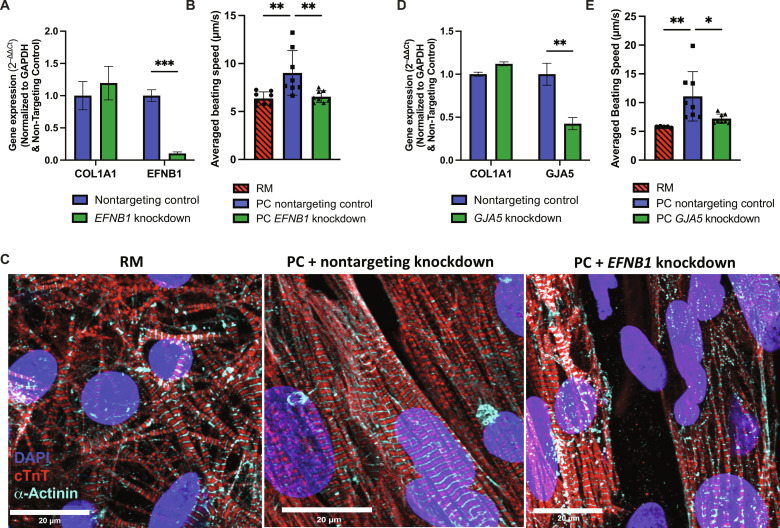
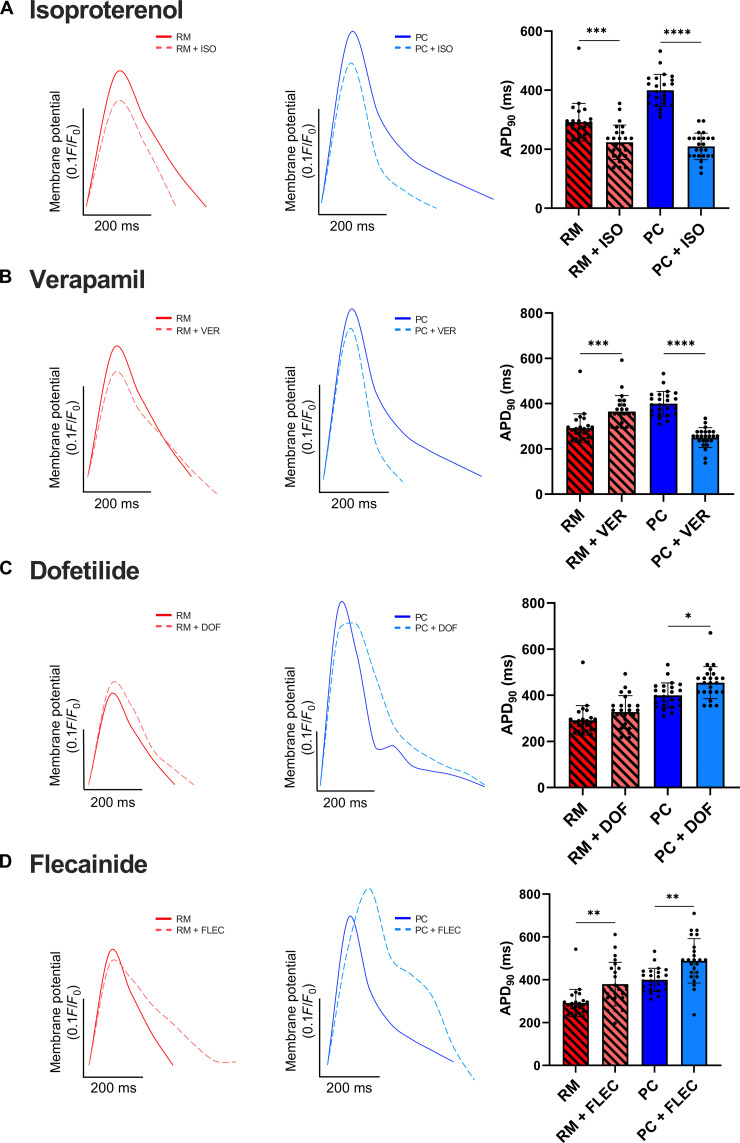
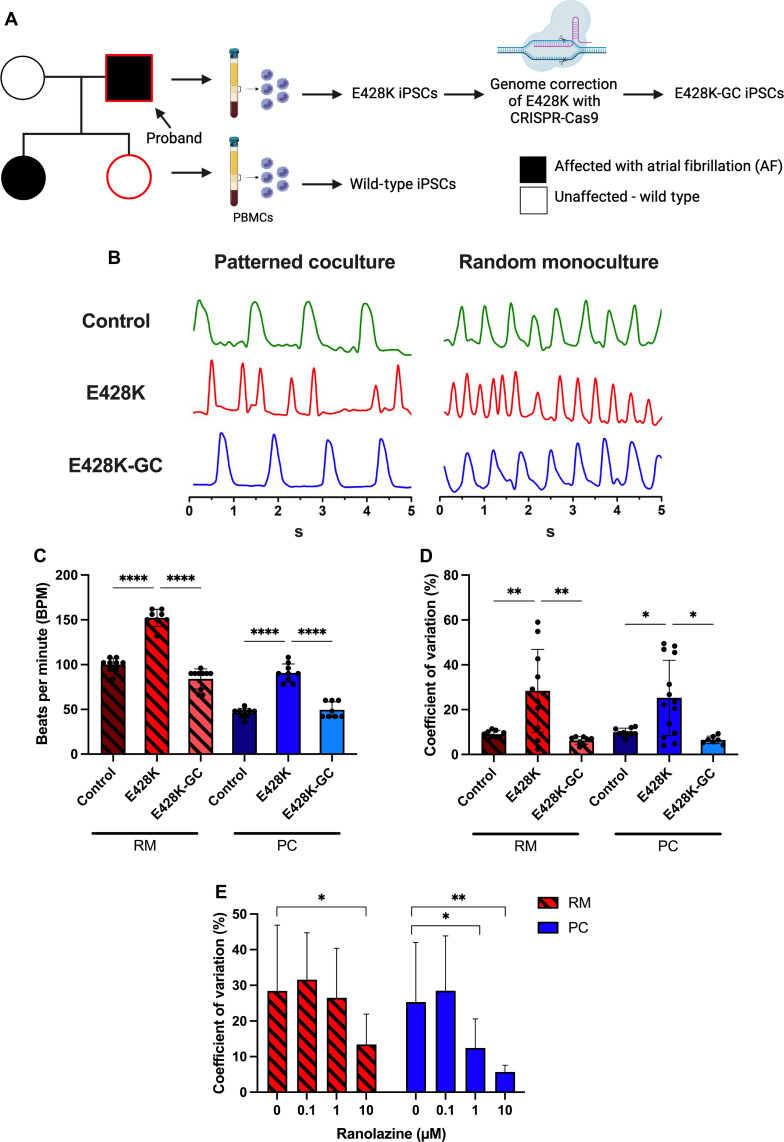
Atrial fibrillation (AF) is the most common sustained cardiac arrhythmia treatable with antiarrhythmic drugs; however, patient responses remain highly variable. Human induced pluripotent stem cell-derived atrial cardiomyocytes (iPSC-aCMs) are useful for discovering precision therapeutics, but current platforms yield phenotypically immature cells and are not easily scalable for high-throughput screening. Here, primary adult atrial, but not ventricular, fibroblasts induced greater functional iPSC-aCM maturation, partly through connexin-40 and ephrin-B1 signaling. We developed a protein patterning process within multiwell plates to engineer patterned iPSC-aCM and atrial fibroblast coculture (PC) that significantly enhanced iPSC-aCM structural, electrical, contractile, and metabolic maturation for 6+ weeks compared to conventional mono-/coculture. PC displayed greater sensitivity for detecting drug efficacy than monoculture and enabled the modeling and pharmacological or gene editing treatment of an AF-like electrophysiological phenotype due to a mutated sodium channel. Overall, PC is useful for elucidating cell signaling in the atria, drug screening, and modeling AF.


Figures

Fig. 1.
Fig. 1.. Soft lithographic process to generate PC of iPSC-aCMs and CFs within multiwell plates.
(A) Tissue culture polystyrene (TCPS) is first treated with oxygen plasma, followed by APTES. Next, a PDMS mask/stencil is placed atop the surface followed by oxygen plasma treatment to etch the unprotected APTES. BSA is then loaded into the channels created between the TCPS and PDMS mask via vacuum force to passivate the surface for CM attachment. The PDMS mask is then removed, and FN is added to create alternating lines (B) with BSA. Seeded CMs preferentially attach to the FN patterns as seen via (C) phase contrast and calcein AM. Seeded fibroblasts attach to the BSA-coated areas to create the (D) PC. Green color and purple color indicate the patterned iPSC-aCMs and atrial fibroblasts, respectively. Scale bar, 250 µm.
Fig. 2.
Fig. 2.. Structural maturity of iPSC-aCMs.
(A) Phase contrast images of iPSC-aCM RM and PC of iPSC-aCMs and primary adult ACFs showed improved linear orientation in PC, quantified in histogram (bottom left). When compared to RC and PM, RC increased mean directionality of iPSC-aCMs (bottom right); however, iPSC-aCMs in PM and PC showed nearly perfect directionality (n = 3 images). A.U., arbitrary units. (B) Wheat germ agglutinin (WGA) membrane stain showed improvement in iPSC-aCM AR in PC versus RM; in addition, PM and PC improved iPSC-aCM AR versus RM and RC (n = 18 cells). (C) Cell nuclei and α-actinin staining identified iPSC-aCMs. Nuclei circularity (bottom left) of iPSC-aCMs showed a decrease in PC versus RM, while the nuclei AR of iPSC-aCMs (bottom right) was increased in PC versus RM, indicating a more elongated phenotype (n = 85, 57, 74, and 132 nuclei for RM, RC, PM, and PC, respectively). (D) Connexin 40 (Cx40) staining localized around α-actinin–positive iPSC-aCMs was improved in PC versus RM. Right images are magnified regions as indicated by the dashed rectangles in the corresponding left images. (E) Culture platforms immunostained for cardiac troponin T (cTnT) and α-actinin were used to visualize sarcomere organization and to quantitate sarcomere length. PC had the longest sarcomere length versus other platforms (bottom) (n = 53 sarcomeres). Bottom images are magnified regions as indicated by the dashed rectangles in the corresponding top images. *P < 0.05, **P < 0.01,***P < 0.001, and ****P < 0.0001. (A) Scale bar, 500 µm; [(B) and (C)] Scale bar, 50 µm; and [(D) and (E)] Scale bar, 50 µm (10 µm for magnified images).
Fig. 3.
Fig. 3.. Electrical and contractile maturity of iPSC-aCMs.
(A) OVM traces of RM, RC, PM, and PC. APD90 was increased in RC and PC versus RM and PM (top right); P-P duration was increased (bottom right) in RC, PM, and PC versus RM (n = 12 cells). Current density for (B) sodium (PC: n = 10 cells; RM: n = 8) and (C) calcium (PC: n = 44; RM: n = 12) for iPSC-aCMs in RM and PC was measured via SyncroPatch-384, with PC showing increased calcium current density. Error bars represent SEM. (D) Time-series line-scan images (left) of calcium flux (Fluo-4/AM dye) and quantification (middle) in iPSC-aCMs, with PC showing higher amplitude (peak signal F/baseline signal F0) and lower tau versus RM (right) (four first beatings of four different cells). (E) Left image depicts registered vector field map; right histogram shows similar distribution of beating speed between x- and y-axis components (inset shows direct x and y comparison) for iPSC-aCMs in RM. (F) The y-axis contraction of iPSC-aCMs in PC was stronger than x-axis contraction. (G) Traction force microscopy on fluorescent bead-laden 25-kPa hydrogels was used to quantify iPSC-aCM contraction force. Bright-field images and its overlay images with traction heat maps (left) for iPSC-aCMs adhered to hydrogel surfaces and previously cultured in RM or PC. Contraction force of iPSC-aCMs in PC was higher (right) compared to RM (n = 6 cells). *P < 0.05, **P < 0.01, and ****P < 0.0001. (D) Scale bar, 500 ms; [(E) and (F)] Scale bar, 200 µm; and (G) Scale bar, 50 µm.
Fig. 4.
Fig. 4.. Metabolic maturity of iPSC-aCMs.
(A) Immunostaining for mitochondria via MitoView and sarcomeres via α-actinin showed that while the iPSC-aCM mitochondria were randomly distributed in random monoculture (RM), they were linear and aligned with the sarcomeres in PC. Inset images are magnified regions as indicated by the dashed rectangles in the corresponding larger image. (B) TEM images of iPSC-aCMs in RM and PC, with the latter containing elongated mitochondria (*) and aligned sarcomeres (arrow). (C) Seahorse analysis measuring OCR of iPSC-aCMs from RM and PC; additional parameters were calculated from this data. PC showed a significant increase in spare respiratory capacity, ATP production, max respiration, and basal respiration compared to RM (PC: n = 20 wells; RM: n = 12 wells). ***P < 0.001 and ****P < 0.0001. FCCP, carbonyl cyanide (trifluoromethoxy) phenylhydrazone; anti-A/Rot, antimycin A/rotenone; DAPI, 4′,6-diamidino-2-phenylindole. (A) Scale bar, 50 µm (10 µm for inset images) and (B) Scale bar, 1 µm.
Fig. 5.
Fig. 5.. RNA-seq analysis of iPSC-aCMs.
(A) Venn diagram depicting 461 genes differentially up-regulated in iPSC-aCMs from RM and 1103 genes up-regulated in iPSC-aCMs from PC; the iPSC-aCMs were purified from PC via magnetic activated cell sorting before sequencing. (B) Volcano plot showing the distribution of differentially expressed genes in PC compared to RM (red: up-regulated in PC relative to RM, and blue: downregulated in PC relative to RM or up-regulated in RM relative to PC). (C) up-regulated GO pathways in PC related to mature cardiac functions. (D) Up-regulated GO pathways in RM related to fetal and epidermis development. Down-selected genes up-regulated in PC in key cardiac pathways including (E) circulatory system process (GO: 0003013), (F) cell junction organization (GO: 0034330), and (G) actin cytoskeleton organization (GO: 0030036) (n = 3 sequencing replicates).
Fig. 6.
Fig. 6.. Knockdown of Cx40 or ephrin B1 (EFNB1) expression in primary adult ACFs before coculture with iPSC-aCMs.
(A) Verification of siRNA-mediated EFNB1 knockdown via gene expression analysis in ACFs 7 days following transfection (n = 6). Collagen 1a1 (COL1A1) was used an untargeted control ACF gene. Knocking down EFNB1 in ACFs before coculture (B) lowers speed of iPSC-aCM contraction movement (n = 8) and (C) disrupts sarcomere organization in iPSC-aCMs as visualized via immunostaining of cTnT and α-actinin. (D) Verification of siRNA-mediated Cx40 (GJA5) knockdown via gene expression analysis in ACFs 7 days following transfection (n = 6). (E) Knocking down GJA5 in ACFs before coculture lowers speed of iPSC-aCM contraction movement (n = 8). Scale bar, 20 µm.
Fig. 7.
Fig. 7.. Prototypical drug response of iPSC-aCMs.
(A) Isoproterenol (ISO)–treated RM and PC showed a statistically significant decrease in APD90, relative to vehicle [dimethyl sulfoxide (DMSO)]–treated control cultures; the relative decrease in APD90 was higher in PC compared to RM. (B) PC showed a significant decrease in APD90 when treated with verapamil (VER), while an increase was observed in RM. (C) PC showed a significant increase in APD90 in response to dofetilide (DOF), while no significant difference was observed in RM. (D) Flecainide (FLEC)–treated RM and PC both showed a significant increase in APD90. All panels have n = 24 cells. *P < 0.05, **P < 0.01, ***P < 0.001, and ****P < 0.0001.
Fig. 8.
Fig. 8.. Modeling AF in iPSC-aCMs with E428K mutation in SCN5A.
(A) Left to right: Schematics of family tree with E428K mutation and an unaffected genetic control (wild type), isolation of peripheral blood mononuclear cells (PBMCs), generation of iPSCs from PBMCs, and CRISPR correction to generate a genome-corrected (GC) control. Diagram constructed in BioRender. (B) OVM traces comparing PC to RM for the iPSC lines showed a uniform beating pattern in the control line and an irregular beating pattern in the E428K line, which was corrected with the E248K-GC line. (C) An increase in beats per minute was observed in the E428K line versus control and GC lines; however, values were higher in RM versus PC, which was closer to the adult heart’s beating rates (n = 8 cells). (D) An increase in coefficient of variation (mean peak-to-peak interval divided by the SD) was observed in the E428K line compared to the control and GC lines in both RM and PC (n = 8 cells for control and E428K-GC lines; n = 11 cells for RM E428K line; n = 14 cells for PC E428K line). (E) Coefficient of variation was significantly decreased in E428K-PC treated with both 1 and 10 μM ranolazine (Rano), whereas a significant decrease was observed only at 10 μM Rano treatment in E428K-RM, suggesting that PC are more sensitive to Rano treatment (n = 11 cells). *P < 0.05, **P < 0.01, and ****P < 0.0001.

References

    1. Chugh S. S., Havmoeller R., Narayanan K., Singh D., Rienstra M., Benjamin E. J., Gillum R. F., Kim Y. H., McAnulty J. H. Jr., Zheng Z. J., Forouzanfar M. H., Naghavi M., Mensah G. A., Ezzati M., Murray C. J. L., Worldwide epidemiology of atrial fibrillation: A global burden of Disease 2010 Study. Circulation 129, 837–847 (2014). - PMC - PubMed
    1. Krijthe B. P., Kunst A., Benjamin E. J., Lip G. Y. H., Franco O. H., Hofman A., Witteman J. C. M., Stricker B. H., Heeringa J., Projections on the number of individuals with atrial fibrillation in the European Union, from 2000 to 2060. Eur. Heart J. 34, 2746–2751 (2013). - PMC - PubMed
    1. Wijesurendra R. S., Casadei B., Mechanisms of atrial fibrillation. Heart 105, 1860–1867 (2019). - PubMed
    1. Ly O. T., Brown G. E., Han Y. D., Darbar D., Khetani S. R., Bioengineering approaches to mature induced pluripotent stem cell-derived atrial cardiomyocytes to model atrial fibrillation. Exp. Biol. Med. 246, 1816–1828 (2021). - PMC - PubMed
    1. Chen Y. H., Xu S. J., Bendahhou S., Wang X. L., Wang Y., Xu W. Y., Jin H. W., Sun H., Su X. Y., Zhuang Q. N., Yang Y. Q., Li Y. B., Liu Y., Xu H. J., Li X. F., Ma N., Mou C. P., Chen Z., Barhanin J., Huang W., KCNQ1 gain-of-function mutation in familial atrial fibrillation. Science 299, 251–254 (2003). - PubMed

Publication types