

Identifying the perceived local properties of networks reconstructed from biased random walks
- PMID: 38241390
- PMCID: PMC10798465
- DOI: 10.1371/journal.pone.0296088
Identifying the perceived local properties of networks reconstructed from biased random walks
Abstract
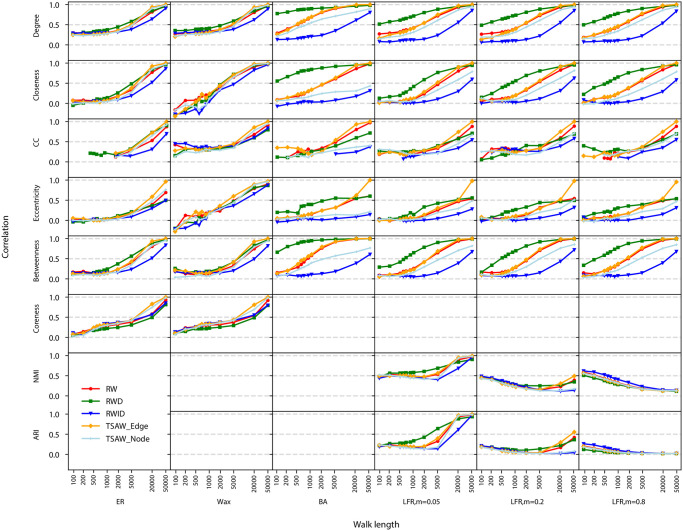
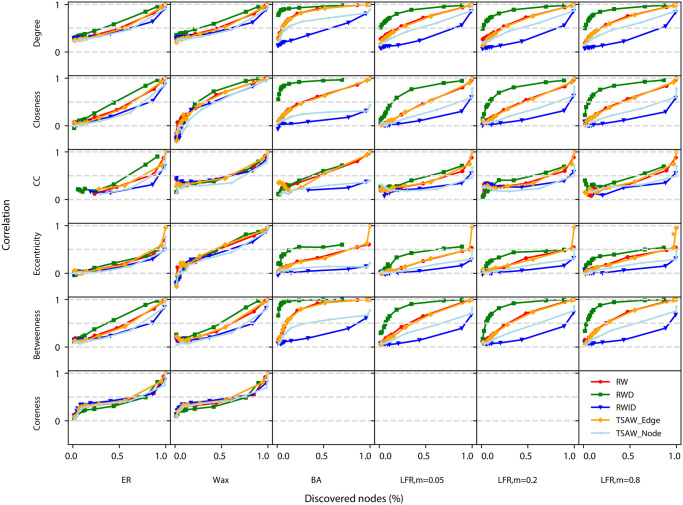
Many real-world systems give rise to a time series of symbols. The elements in a sequence can be generated by agents walking over a networked space so that whenever a node is visited the corresponding symbol is generated. In many situations the underlying network is hidden, and one aims to recover its original structure and/or properties. For example, when analyzing texts, the underlying network structure generating a particular sequence of words is not available. In this paper, we analyze whether one can recover the underlying local properties of networks generating sequences of symbols for different combinations of random walks and network topologies. We found that the reconstruction performance is influenced by the bias of the agent dynamics. When the walker is biased toward high-degree neighbors, the best performance was obtained for most of the network models and properties. Surprisingly, this same effect is not observed for the clustering coefficient and eccentric, even when large sequences are considered. We also found that the true self-avoiding displayed similar performance as the one preferring highly-connected nodes, with the advantage of yielding competitive performance to recover the clustering coefficient. Our results may have implications for the construction and interpretation of networks generated from sequences.
Copyright: © 2024 Guerreiro et al. This is an open access article distributed under the terms of the Creative Commons Attribution License, which permits unrestricted use, distribution, and reproduction in any medium, provided the original author and source are credited.
Conflict of interest statement
The authors have declared that no competing interests exist.
Figures


Similar articles
-
Estimating mean first passage time of biased random walks with short relaxation time on complex networks.PLoS One. 2014 Apr 3;9(4):e93348. doi: 10.1371/journal.pone.0093348. eCollection 2014. PLoS One. 2014. PMID: 24699325 Free PMC article.
-
Nonlocal biased random walks and fractional transport on directed networks.Phys Rev E. 2020 Aug;102(2-1):022142. doi: 10.1103/PhysRevE.102.022142. Phys Rev E. 2020. PMID: 32942357
-
Random walks in weighted networks with a perfect trap: an application of Laplacian spectra.Phys Rev E Stat Nonlin Soft Matter Phys. 2013 Jun;87(6):062140. doi: 10.1103/PhysRevE.87.062140. Epub 2013 Jun 28. Phys Rev E Stat Nonlin Soft Matter Phys. 2013. PMID: 23848660
-
Characteristic times of biased random walks on complex networks.Phys Rev E Stat Nonlin Soft Matter Phys. 2014 Jan;89(1):012803. doi: 10.1103/PhysRevE.89.012803. Epub 2014 Jan 9. Phys Rev E Stat Nonlin Soft Matter Phys. 2014. PMID: 24580277
-
Exploring biological network structure with clustered random networks.BMC Bioinformatics. 2009 Dec 9;10:405. doi: 10.1186/1471-2105-10-405. BMC Bioinformatics. 2009. PMID: 20003212 Free PMC article.
Cited by
-
Comparing random walks in graph embedding and link prediction.PLoS One. 2024 Nov 6;19(11):e0312863. doi: 10.1371/journal.pone.0312863. eCollection 2024. PLoS One. 2024. PMID: 39504339 Free PMC article.
References
-
- Arruda HF, Silva FN, Costa LF, Amancio DR. Knowledge acquisition: A Complex networks approach. Information Sciences. 2017;421:154–166. doi: 10.1016/j.ins.2017.08.091 - DOI
-
- Cantwell GT, Kirkley A, Newman M. The friendship paradox in real and model networks. Journal of Complex Networks. 2021;9(2):cnab011. doi: 10.1093/comnet/cnab011 - DOI
-
- Costa LdF, Oliveira ON Jr, Travieso G, Rodrigues FA, Villas Boas PR, Antiqueira L, et al. Analyzing and modeling real-world phenomena with complex networks: a survey of applications. Advances in Physics. 2011;60(3):329–412. doi: 10.1080/00018732.2011.572452 - DOI
MeSH terms
LinkOut - more resources
Full Text Sources
