. 2024 Jan 23;121(4):e2311013121.
doi: 10.1073/pnas.2311013121. Epub 2024 Jan 19.

SAGA1 and SAGA2 promote starch formation around proto-pyrenoids in Arabidopsis chloroplasts

Affiliations

SAGA1 and SAGA2 promote starch formation around proto-pyrenoids in Arabidopsis chloroplasts

Nicky Atkinson et al. Proc Natl Acad Sci U S A. .

Abstract

The pyrenoid is a chloroplastic microcompartment in which most algae and some terrestrial plants condense the primary carboxylase, Rubisco (ribulose-1,5-bisphosphate carboxylase/oxygenase) as part of a CO2-concentrating mechanism that improves the efficiency of CO2 capture. Engineering a pyrenoid-based CO2-concentrating mechanism (pCCM) into C3 crop plants is a promising strategy to enhance yield capacities and resilience to the changing climate. Many pyrenoids are characterized by a sheath of starch plates that is proposed to act as a barrier to limit CO2 diffusion. Recently, we have reconstituted a phase-separated "proto-pyrenoid" Rubisco matrix in the model C3 plant Arabidopsis thaliana using proteins from the alga with the most well-studied pyrenoid, Chlamydomonas reinhardtii [N. Atkinson, Y. Mao, K. X. Chan, A. J. McCormick, Nat. Commun. 11, 6303 (2020)]. Here, we describe the impact of introducing the Chlamydomonas proteins StArch Granules Abnormal 1 (SAGA1) and SAGA2, which are associated with the regulation of pyrenoid starch biogenesis and morphology. We show that SAGA1 localizes to the proto-pyrenoid in engineered Arabidopsis plants, which results in the formation of atypical spherical starch granules enclosed within the proto-pyrenoid condensate and adjacent plate-like granules that partially cover the condensate, but without modifying the total amount of chloroplastic starch accrued. Additional expression of SAGA2 further increases the proportion of starch synthesized as adjacent plate-like granules that fully encircle the proto-pyrenoid. Our findings pave the way to assembling a diffusion barrier as part of a functional pCCM in vascular plants, while also advancing our understanding of the roles of SAGA1 and SAGA2 in starch sheath formation and broadening the avenues for engineering starch morphology.

Keywords: Arabidopsis; CO2-concentrating mechanism; Chlamydomonas; EPYC1; Rubisco.


Conflict of interest statement

Competing interests statement:The authors declare no competing interest.

Figures

Fig. 1.
Fig. 1.
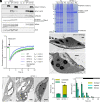
Expression of SAGA1 leads to the formation of atypical starch granules associated with the proto-pyrenoid and a distinct condensate phenotype. (A) Immunoblots showing expression of SAGA1::mCherry (S1) in three independent T3 homozygous (homo) lines and respective azygous (Az) segregants in the S2Cr background (see SI Appendix, Fig. S13 for uncropped immunoblots). (B) SAGA1::mCherry localizes to the chloroplast in S2Cr. (C) TEM of chloroplasts from S2Cr, S1-1, and EPYC1::GFP in S2Cr (EP1-1) (34) (D) Immunoblots showing expression of SAGA1::mCherry and EPYC1::GFP (EP1S1) in three independent T3 homozygous lines and respective azygous segregants in the S2Cr background. (E) SAGA1::mCherry localizes to the proto-pyrenoid and forms a ring around EPYC1::GFP. (F) Representative TEM images of EP1S1-1 chloroplasts with atypical spherical enclosed (E), adjacent (A), and typical stromal (S) starch granule labeled. The lighter-staining pattern is highlighted with an asterisk. (Scale bar, 0.5 µm.)
Fig. 2.
Fig. 2.
Proto-pyrenoids in EP1S1 plants contain SAGA1 and EPYC1, are liquid-like, and contribute to the formation of atypical starch granules. (A) SAGA1, EPYC1 and Rubisco protein levels in S2Cr T3 homozygous lines expressing SAGA1 (S1; S1-1), EPYC1 (EP1), SAGA1, and EPYC1 (EP1S1; EP1S1-1) and an azygous EP1S1-1 segregant (Az) are shown. Whole leaf tissue samples (input) and pelleted condensate extracts (pellet) were assessed by immunoblot analyses with anti-SAGA1, anti-EPYC1, anti-CrRbcS2, or polyclonal anti-Rubisco [AtRbcL, AtRbcS1B (At5g38430), AtRbcS2B (At5g38420), and CrRbcS2 are shown] antibodies. Anti-actin is shown as an input loading control. Molecular weights: AtRbcL, 55 kDa; AtRbcS1B/2B, 14.8 kDa; CrRbcS2, 15.5 kDa; EPYC1, 34 kDa; SAGA1, 180 kDa. The immunoblots shown were derived from the same experiment and gels/blots were processed in parallel. (B) Coomassie-stained SDS-PAGE gel showing the composition of the input, the supernatant following condensate extraction and centrifugation (Sup), and the pelleted condensate (Pel). (C) Fluorescence recovery assays of bleached areas for condensates in EP1 and EP1S1-1, -2, and -3 lines compared to nonbleached regions. Each dataset is the mean ± SEM of 17 to 23 individual condensates from different chloroplasts. Half FRAP (T0.5) values (the time point when condensates achieve 50% bleaching recovery) are shown for each dataset. (D) Example TEM images of periodic acid-thiocarbohydrazide-silver proteinate (PATAg) stained sections from EP1S1-1. (E) Representative immunogold labeling of SAGA1 in EP1S1-1. Gold nanoparticles are highlighted with circles. (Scale bars for all TEM images, 0.5 µm.) (F) Average number of gold particles observed in the condensate versus the stroma. Mean ± SEM, n = 23 (S2Cr) and 48 (EP1S1-1). (G) Starch area in EP1S1-1 plants based on TEM images taken over a 12:12 h light: dark cycle followed by a 4 h in the dark (see SI Appendix, Fig. S3 for more details). White bar = light, black bar = dark, and shaded bar = starvation in dark. Starch granules were scored as stromal, adjacent to the condensate (i.e., between 10% and 90% of the starch granule periphery was in contact with the condensate), or enclosed by the condensate (i.e., greater than 90% of the granule periphery was in contact with the condensate). Each time point represents the mean ± SEM of 22 to 39 chloroplasts.
Fig. 3.
Fig. 3.
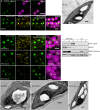
Proto-pyrenoids in plants expressing SAGA1, SAGA2, and EPYC1 are associated with the formation of large adjacent starch granules. (A) SAGA2::mNeon localizes to the chloroplast in S2Cr. (B) SAGA2::mCherry mainly colocalizes with EPYC1::GFP in condensates in S2Cr (EP1S2). White and red arrows illustrate examples of SAGA2 encircling a cavity (likely a starch granule) within and away from a condensate, respectively. (C) Representative TEM image of EP1S2. (D) SAGA2::mCherry mainly colocalizes to the distorted condensates when expressed with SAGA1 and EPYC1::GFP in S2Cr (EP1S1S2-1, -2 and -3). (E) Immunoblots showing differential expression of SAGA1, SAGA2, and EPYC1 in three independent T3 EP1S1S2 lines and their azygous segregants (note: Az2 still showed SAGA2 expression and was excluded from further analyses). (F) Representative TEM images of each EP1S1S2 line. (Scale bar on all confocal and TEM images, 5 µm.)
Fig. 4.
Fig. 4.
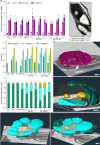
Plants expressing SAGA1, SAGA2, and EPYC1 produce plate-like starch granules that encircle the proto-pyrenoid. (A) Leaf starch content at 1 h, 8 h, and 16 h into the photoperiod. Bars represent the mean ± SEM from three individual rosettes. (B) Example of enclosed, adjacent, and stromal starch granules (in EP1S1). The circularity values for each granule were calculated using the freehand selection tool in Fiji (1 = perfect circle and 0 = straight line). (C) Circularity of starch granules for each plant line measured from TEM images. (D) Proportion of starch area based on granules categorized as enclosed, adjacent, or stromal. Starch granules were designated “adjacent” if between 0% and 90% of perimeter bordered the condensate, and “enclosed” if >90% of perimeter bordered the condensate. The bars represent the mean ± SEM of starch granules from 28 to 48 chloroplasts in plants imaged at the end of the photoperiod. (E) 3-D reconstructions of the SAGA1 network in EP1S1 obtained using SBF-SEM. (F) 3-D reconstructions of stromal (S), enclosed (E), and adjacent (A) starch granules in EP1S1. The condensate is shown in transparent yellow. (G) 3-D reconstructions of adjacent starch granules in EP1S1S2 with (Right) and without (Left) stromal starch granules shown. In (F) and (G) the condensate is shown in transparent yellow. (Scale bar on all SBF-SEM images, 1 µm.) See SI Appendix, Fig. S8 and Movies S1–S12 for raw video data and 3-D reconstruction videos.
Fig. 5.
Fig. 5.
Growth is reduced but not photosynthetic performance in EP1S1S2 lines. (A) Fresh weight of EP1S1S2 lines and their azygous (Az) segregants 32 d after germination. The S2Cr background line was used as a control for line 1 as the Az segregant line had consistent germination and growth problems. (B) Rosette expansion for S1 and EP1S1 lines measured over 30 d postgermination. Error bars show the mean ± SEM of 12 to 21 individual rosettes. (C) Net CO2 assimilation (A) based on substomatal [CO2] (Ci) under saturating light (1,500 μmol photons m−2 s−1). Values show the mean ± SEM of the three separate EP1S1S2 lines, each composed of five to eight individual measurements on separate rosettes (see SI Appendix, Figs. S10 and S11 for further details). (D) Violin plot showing the proportion of starch area associated with the condensate (enclosed or adjacent), in EP1S1S2-1 (Line 1), representative of 45 to 48 starch-containing chloroplasts. Asterisks show significance where P < 0.001 using a Mann–Whitney U test. (E) Representative TEM images from the predawn dataset analyzed in (D). (Scale bar, 0.5 µm.)

References

    1. Erb T. J., Zarzycki J., A short history of RubisCO: The rise and fall (?) of Nature’s predominant CO2 fixing enzyme. Curr. Opin. Biotechnol. 49, 100–107 (2018). - PMC - PubMed
    1. Tcherkez G., The mechanism of Rubisco-catalysed oxygenation. Plant Cell Environ. 39, 983–997 (2016). - PubMed
    1. Walker B. J., Vanloocke A., Bernacchi C. J., Ort D. R., The Costs of photorespiration to food production now and in the future. Annu. Rev. Plant Biol. 67, 107–129 (2016). - PubMed
    1. South P. F., Cavanagh A. P., Liu H. W., Ort D. R., Synthetic glycolate metabolism pathways stimulate crop growth and productivity in the field. Science 363, eaat9077 (2019). - PMC - PubMed
    1. López-Calcagno P. E., et al. , Stimulating photosynthetic processes increases productivity and water-use efficiency in the field. Nat. Plants 6, 1054–1063 (2020). - PubMed

MeSH terms

LinkOut - more resources