. 2024 Apr 1;84(7):1133-1148.
doi: 10.1158/0008-5472.CAN-23-0295.

Cyclic Fasting-Mimicking Diet Plus Bortezomib and Rituximab Is an Effective Treatment for Chronic Lymphocytic Leukemia

Affiliations

Cyclic Fasting-Mimicking Diet Plus Bortezomib and Rituximab Is an Effective Treatment for Chronic Lymphocytic Leukemia

Franca Raucci et al. Cancer Res. .

Abstract

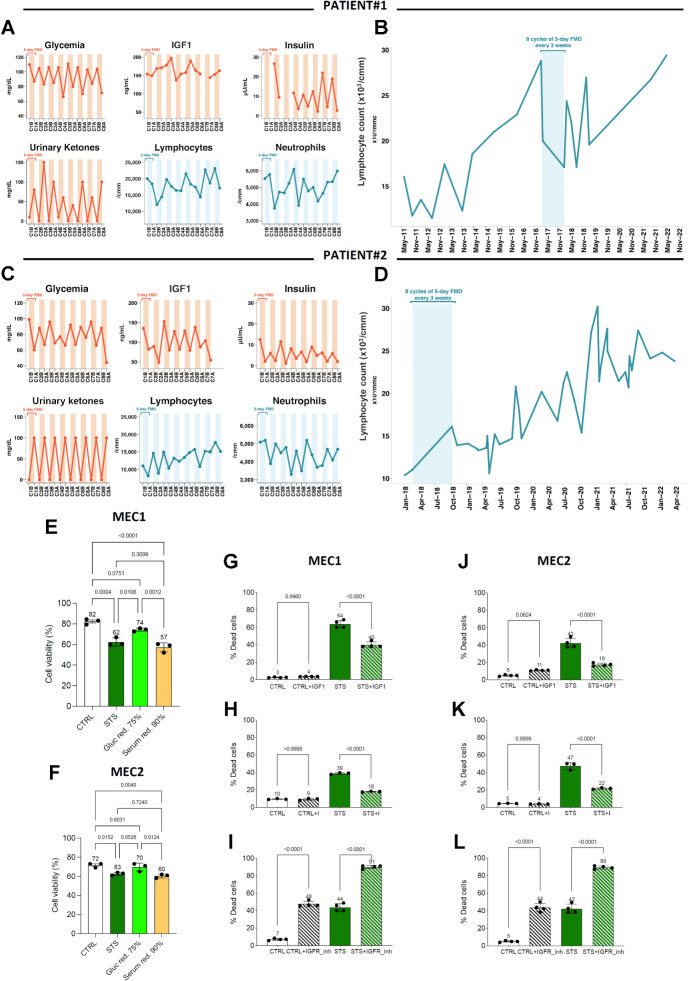
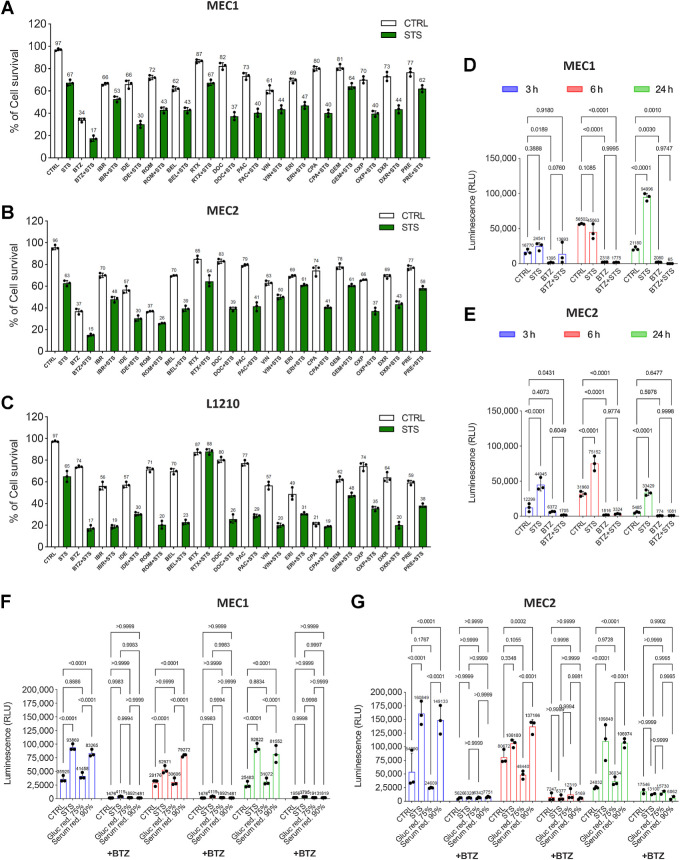
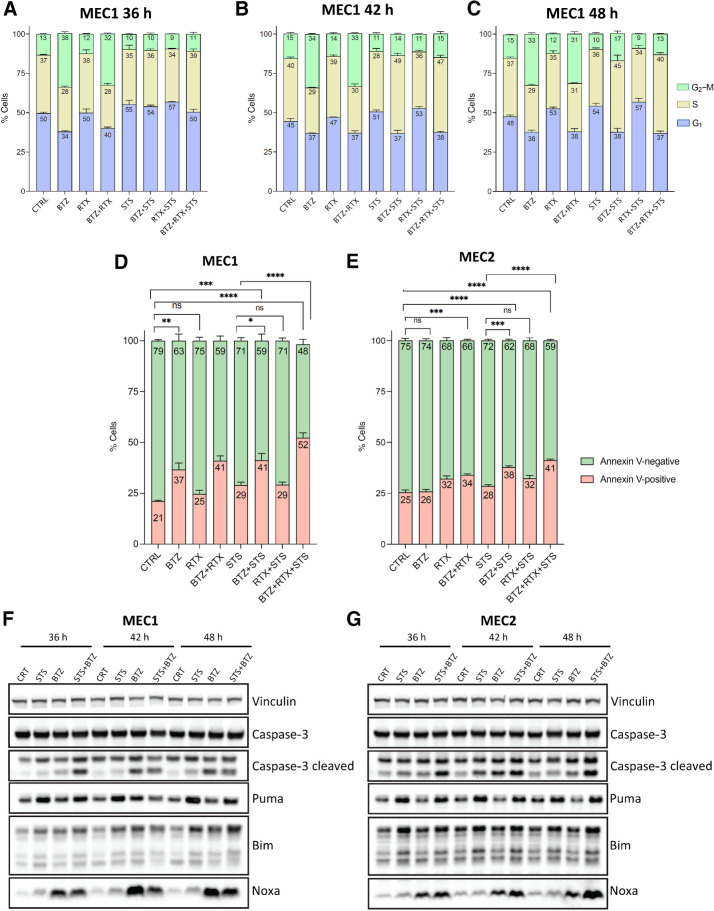
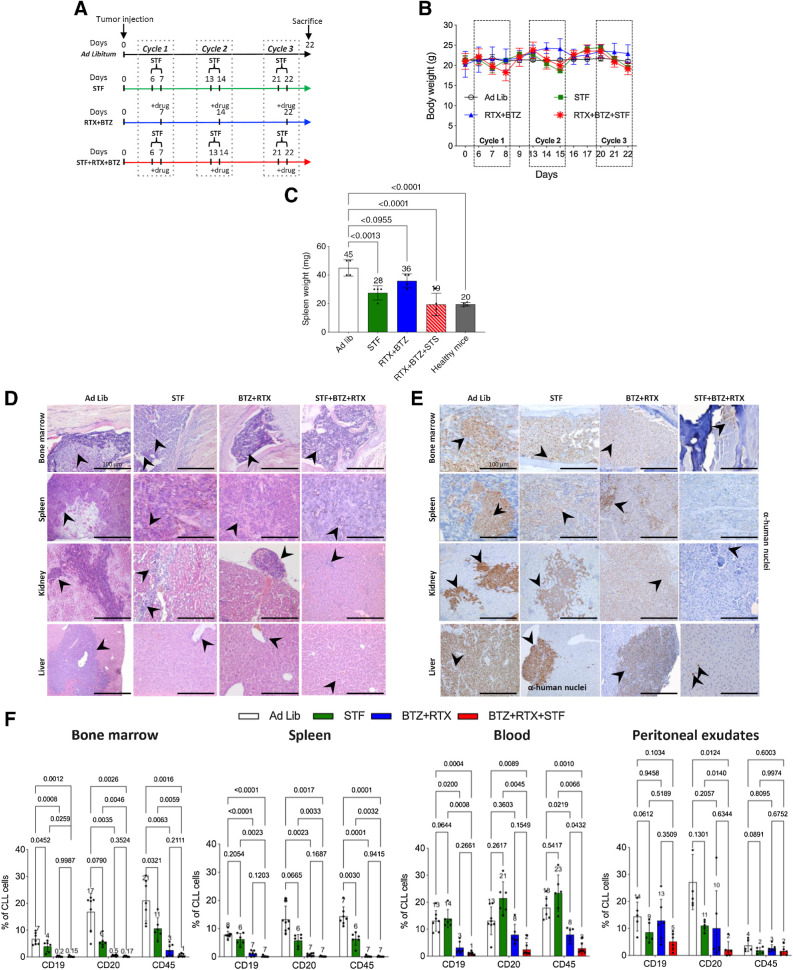
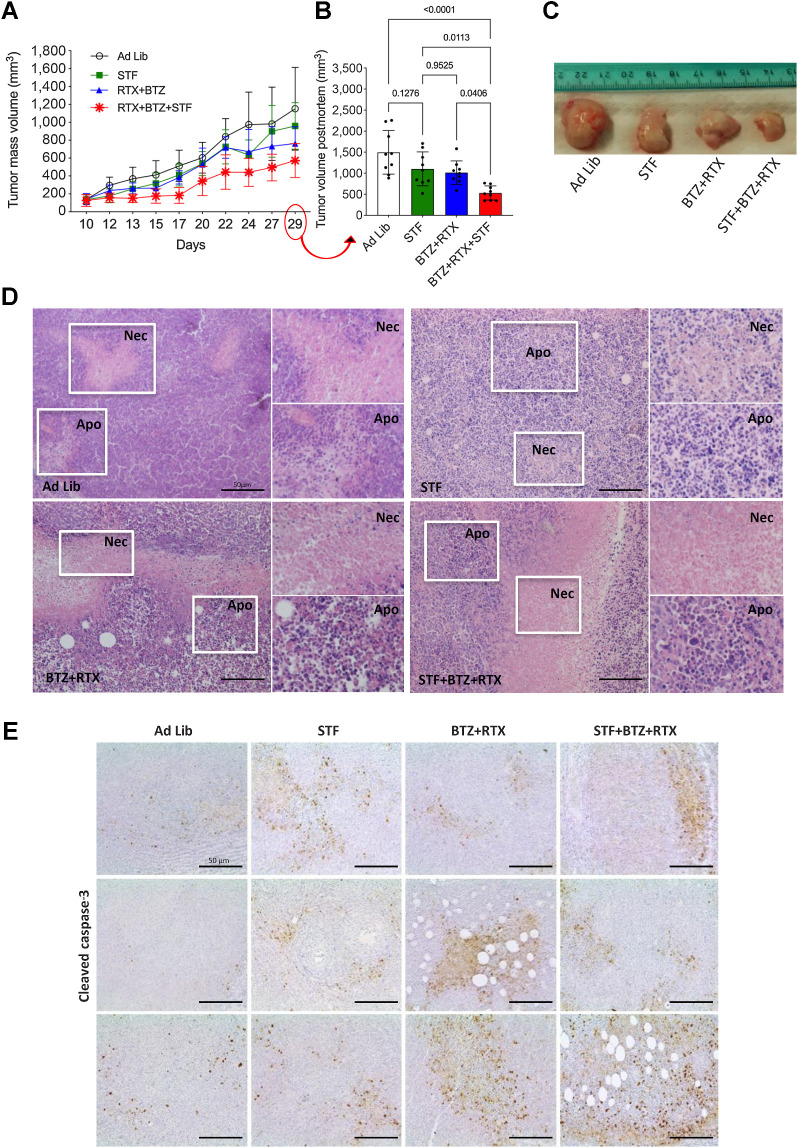
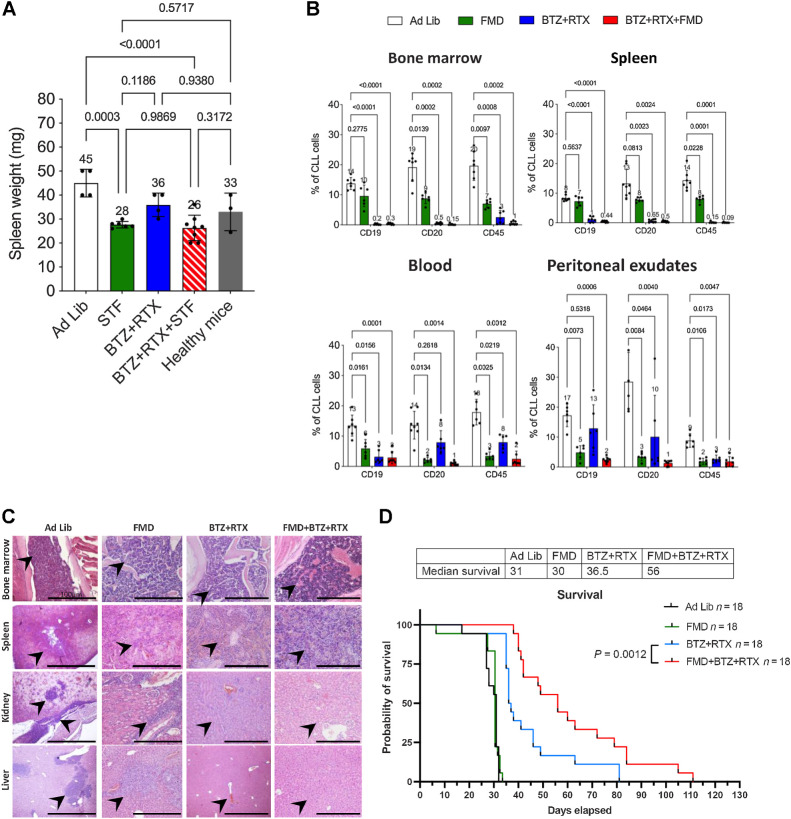
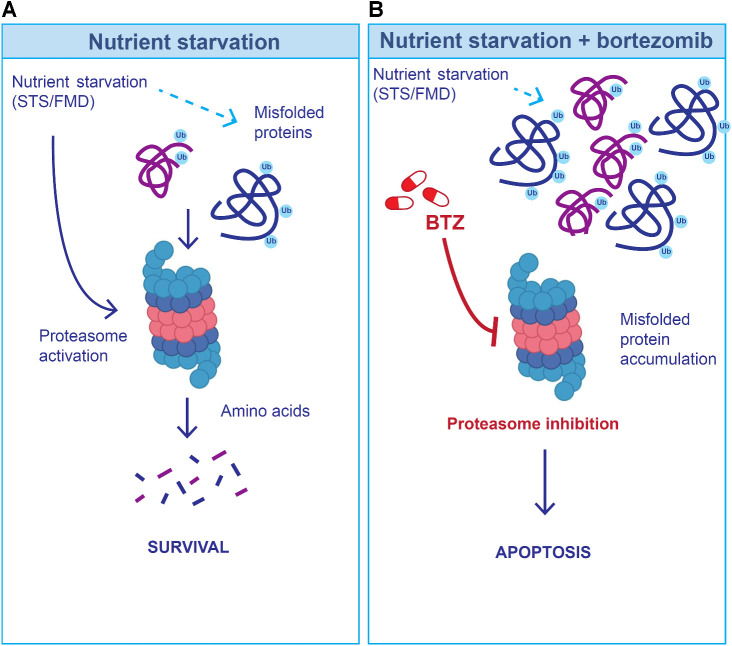
Cyclic fasting-mimicking diet (FMD) is an experimental nutritional intervention with potent antitumor activity in preclinical models of solid malignancies. FMD cycles are also safe and active metabolically and immunologically in cancer patients. Here, we reported on the outcome of FMD cycles in two patients with chronic lymphocytic leukemia (CLL) and investigated the effects of fasting and FMD cycles in preclinical CLL models. Fasting-mimicking conditions in murine CLL models had mild cytotoxic effects, which resulted in apoptosis activation mediated in part by lowered insulin and IGF1 concentrations. In CLL cells, fasting conditions promoted an increase in proteasome activity that served as a starvation escape pathway. Pharmacologic inhibition of this escape mechanism with the proteasome inhibitor bortezomib resulted in a strong enhancement of the proapoptotic effects of starvation conditions in vitro. In mouse CLL models, combining cyclic fasting/FMD with bortezomib and rituximab, an anti-CD20 antibody, delayed CLL progression and resulted in significant prolongation of mouse survival. Overall, the effect of proteasome inhibition in combination with FMD cycles in promoting CLL death supports the targeting of starvation escape pathways as an effective treatment strategy that should be tested in clinical trials.

Significance: Chronic lymphocytic leukemia cells resist fasting-mimicking diet by inducing proteasome activation to escape starvation, which can be targeted using proteasome inhibition by bortezomib treatment to impede leukemia progression and prolong survival.


Figures

Figure 1. FMD reduces lymphocyte counts in CLL patients and it has mild anti-CLL effects in in vitro models by acting through the IGF axis. A–D, Kinetics of peripheral blood lymphocytes, neutrophils, and metabolic parameters (blood IGF1, glucose, and insulin, and urinary ketone bodies) in two patients with CLL undergoing 8 FMD cycles in the NCT03340935 trial. A and C illustrate long-term lymphocyte kinetics to include the timeframes before and after the dietary intervention. During FMD, blood and urine samples were collected at the initiation and at the end of each FMD cycle to measure the concentration of plasma glucose, serum insulin/IGF1, urinary ketone bodies, as well as total neutrophil and lymphocyte counts (B and D). C1B, cycle 1, before FMD; C1A, cycle 1, after FMD; C2B, cycle 2, before FMD; C2A, cycle 2, after FMD; C3B, cycle 2, before FMD; C3A, cycle 3, after FMD; C4B, cycle 4, before FMD; C4A, cycle 4, after FMD; C5B, cycle 5, before FMD; C5A, cycle 5, after FMD; C6B, cycle 6, before FMD; C6A, cycle 6, after FMD; C7B, cycle 7, before FMD; C7A, cycle 7, after FMD; C8B, cycle 8, before FMD; C8A, cycle 8, after FMD. E and F, Effects of glucose (Gluc red., 75%) or serum (Serum red., 90%) restriction on the viability of MEC1 (E) and MEC2 (F) cells cultured in control (CTRL), STS medium, glucose-restricted medium (75% of glucose reduction as compared with CTRL medium), or serum restricted medium (90% of serum reduction as compared with CTRL medium). Data are presented as the mean ± SD of three independent experiments (n = 3). Statistical significance was determined using a one-way ANOVA test with Tukey post hoc analysis. *, P < 0.05; **, P < 0.01; ***, P < 0.001; ns, not significant. G–L, Effects of IGF1/insulin supplementation and IGFR1 inhibition on the viability of MEC1 (G–I) and MEC2 (J–L) cells cultured in CTRL and STS medium, alone or in combination with IGF, the IGFR1 inhibitor BMS-754807, or insulin. Bar plots indicate the percentage of dead cells at the end of the experiments, and the percentage of dead cells in each replicate is indicated by a single point. The test of proportions was used to compare the ratio of dead cells with or without the IGFR1 inhibitors in each treatment condition.
Figure 1.
FMD reduces lymphocyte counts in CLL patients and it has mild anti-CLL effects in in vitro models by acting through the IGF axis. A–D, Kinetics of peripheral blood lymphocytes, neutrophils, and metabolic parameters (blood IGF1, glucose, and insulin, and urinary ketone bodies) in two patients with CLL undergoing 8 FMD cycles in the NCT03340935 trial. A and C illustrate long-term lymphocyte kinetics to include the timeframes before and after the dietary intervention. During FMD, blood and urine samples were collected at the initiation and at the end of each FMD cycle to measure the concentration of plasma glucose, serum insulin/IGF1, urinary ketone bodies, as well as total neutrophil and lymphocyte counts (B and D). C1B, cycle 1, before FMD; C1A, cycle 1, after FMD; C2B, cycle 2, before FMD; C2A, cycle 2, after FMD; C3B, cycle 2, before FMD; C3A, cycle 3, after FMD; C4B, cycle 4, before FMD; C4A, cycle 4, after FMD; C5B, cycle 5, before FMD; C5A, cycle 5, after FMD; C6B, cycle 6, before FMD; C6A, cycle 6, after FMD; C7B, cycle 7, before FMD; C7A, cycle 7, after FMD; C8B, cycle 8, before FMD; C8A, cycle 8, after FMD. E and F, Effects of glucose (Gluc red., 75%) or serum (Serum red., 90%) restriction on the viability of MEC1 (E) and MEC2 (F) cells cultured in control (CTRL), STS medium, glucose-restricted medium (75% of glucose reduction as compared with CTRL medium), or serum restricted medium (90% of serum reduction as compared with CTRL medium). Data are presented as the mean ± SD of three independent experiments (n = 3). Statistical significance was determined using a one-way ANOVA test with Tukey post hoc analysis. *, P < 0.05; **, P < 0.01; ***, P < 0.001; ns, not significant. G–L, Effects of IGF1/insulin supplementation and IGFR1 inhibition on the viability of MEC1 (GI) and MEC2 (JL) cells cultured in CTRL and STS medium, alone or in combination with IGF, the IGFR1 inhibitor BMS-754807, or insulin. Bar plots indicate the percentage of dead cells at the end of the experiments, and the percentage of dead cells in each replicate is indicated by a single point. The test of proportions was used to compare the ratio of dead cells with or without the IGFR1 inhibitors in each treatment condition.
Figure 2. STS activates the proteasome as an adaptive resistance mechanism. A–C, Survival rates of MEC1 (A), MEC2 (B), and L1210 (C) cells cultured in CTRL and STS medium, alone or in the presence of the indicated drugs. Cell survival was measured by erythrosine B exclusion assay. CTRL, physiological condition; BTZ, bortezomib (10 nmol/L); IBR, ibrutinib (5 μmol/L); IDE, idelalisib (50 μmol/L); ROM, romodepsin (10 ng/mL); BEL, belinostat (50 μmol/L); RTX, rituximab (1 μg/mL); DOC, docetaxel (10 μmol/L); PAC, paclitaxel (10 μmol/L); VIN, vincristine (250 nmol/L); doxorubicin (1 μmol/L); ERI, eribulin (10 μmol/L); CPA, cyclophosphamide (100 μmol/L); GEM, gemcitabine, (5 μmol/L); OXP, oxaliplatin (2 μmol/L); DXR, dexamethasone, (100 μmol/L); PRE, predinisone (10 μg/mL). Results from three independent experiments. Data are expressed as mean ± SD. D and E, Proteasome activity in MEC1 (D) and MEC2 (E) cells cultured in CTRL and STS medium, alone or in the presence of bortezomib. Bortezomib, 10 nmol/L. Results from three independent experiments are shown. Data are expressed as mean ± SD. F and G, Impact of glucose restriction (75% of glucose compared with CTRL medium) or serum restriction (90% of serum compared to control medium) on the proteasome activity in MEC1 (F) and MEC2 (G) cells cultured in four different conditions, with or without bortezomib. Gluc red., glucose restricted; Serum red., serum restricted. Data are presented as the mean ± (SD) of three independent experiments (n = 3). Statistical significance was determined using a two-way ANOVA test with Tukey post hoc analysis. *, P < 0.05; **, P < 0.01; ***, P < 0.001; ns, not significant.
Figure 2.
STS activates the proteasome as an adaptive resistance mechanism. A–C, Survival rates of MEC1 (A), MEC2 (B), and L1210 (C) cells cultured in CTRL and STS medium, alone or in the presence of the indicated drugs. Cell survival was measured by erythrosine B exclusion assay. CTRL, physiological condition; BTZ, bortezomib (10 nmol/L); IBR, ibrutinib (5 μmol/L); IDE, idelalisib (50 μmol/L); ROM, romodepsin (10 ng/mL); BEL, belinostat (50 μmol/L); RTX, rituximab (1 μg/mL); DOC, docetaxel (10 μmol/L); PAC, paclitaxel (10 μmol/L); VIN, vincristine (250 nmol/L); doxorubicin (1 μmol/L); ERI, eribulin (10 μmol/L); CPA, cyclophosphamide (100 μmol/L); GEM, gemcitabine, (5 μmol/L); OXP, oxaliplatin (2 μmol/L); DXR, dexamethasone, (100 μmol/L); PRE, predinisone (10 μg/mL). Results from three independent experiments. Data are expressed as mean ± SD. D and E, Proteasome activity in MEC1 (D) and MEC2 (E) cells cultured in CTRL and STS medium, alone or in the presence of bortezomib. Bortezomib, 10 nmol/L. Results from three independent experiments are shown. Data are expressed as mean ± SD. F and G, Impact of glucose restriction (75% of glucose compared with CTRL medium) or serum restriction (90% of serum compared to control medium) on the proteasome activity in MEC1 (F) and MEC2 (G) cells cultured in four different conditions, with or without bortezomib. Gluc red., glucose restricted; Serum red., serum restricted. Data are presented as the mean ± (SD) of three independent experiments (n = 3). Statistical significance was determined using a two-way ANOVA test with Tukey post hoc analysis. *, P < 0.05; **, P < 0.01; ***, P < 0.001; ns, not significant.
Figure 3. Impact of STS and bortezomib on cell-cycle progression and apoptosis. A–C, Cell-cycle analysis using PI staining and flow cytometry. A, Cell-cycle distribution of MEC1 cells treated with CTRL, STS, bortezomib (BTZ), rituximab (RTX), STS + rituximab, STS + bortezomib, bortezomib + rituximab, or STS + bortezomib + rituximab for 36 hours, as assessed by FACS analysis of PI incorporation. B, Cell-cycle distribution analysis after 42 hours of treatment. C, Cell-cycle distribution analysis after 48 hours of treatment. Data are presented as mean ± SD of three independent experiments. D and E, Proapoptotic effects of STS, bortezomib, or STS + bortezomib, alone or in combination with rituximab, in MEC1 and MEC2 cells. The percentage of Annexin V–positive (apoptotic) cells among total cancer cells was quantified by FACS analysis at 36 hours in MEC1 cells (D) and MEC2 cells (E) after exposure to the indicated treatments. Data are presented as mean ± SEM of three independent experiments. F and G, Western blot analysis of the expression of caspase-3, cleaved caspase-3, Noxa, PUMA, and BIM protein levels in MEC1 (F) and MEC2 (G) cells exposed to STS, bortezomib, or their combination, compared to with untreated control cells. Western blot data were replicated in tso independent experiments. Vinculin was used as a protein loading control.
Figure 3.
Impact of STS and bortezomib on cell-cycle progression and apoptosis. A–C, Cell-cycle analysis using PI staining and flow cytometry. A, Cell-cycle distribution of MEC1 cells treated with CTRL, STS, bortezomib (BTZ), rituximab (RTX), STS + rituximab, STS + bortezomib, bortezomib + rituximab, or STS + bortezomib + rituximab for 36 hours, as assessed by FACS analysis of PI incorporation. B, Cell-cycle distribution analysis after 42 hours of treatment. C, Cell-cycle distribution analysis after 48 hours of treatment. Data are presented as mean ± SD of three independent experiments. D and E, Proapoptotic effects of STS, bortezomib, or STS + bortezomib, alone or in combination with rituximab, in MEC1 and MEC2 cells. The percentage of Annexin V–positive (apoptotic) cells among total cancer cells was quantified by FACS analysis at 36 hours in MEC1 cells (D) and MEC2 cells (E) after exposure to the indicated treatments. Data are presented as mean ± SEM of three independent experiments. F and G, Western blot analysis of the expression of caspase-3, cleaved caspase-3, Noxa, PUMA, and BIM protein levels in MEC1 (F) and MEC2 (G) cells exposed to STS, bortezomib, or their combination, compared to with untreated control cells. Western blot data were replicated in tso independent experiments. Vinculin was used as a protein loading control.
Figure 4. Cyclic fasting synergizes with bortezomib (BTZ)-rituximab (RTX) to retard CLL progression. A, Experimental scheme of fasting and BTX in an intravenous mouse CLL model (MEC1 cells). Three cycles of each of the indicated treatments were administered. B, Body weight (g) modifications over the time and under the indicated treatment conditions are represented. C, Spleen weight (mg) modifications over the time, and under the indicated treatment conditions, are represented. D, H&E staining of bone marrow, spleen, kidney, and liver. Ad lib + Vehicle, N = 8; STF + vehicle, N = 6; BTZ+RTX: Ad lib + bortezomib (0.35 mg/kg) + rituximab (10 mg/kg) once a week for 3 weeks (days 7, 14, 21), N = 7; STF + bortezomib +rituximab: Fasting + bortezomib (0.35 mg/kg once a week) + rituximab (10 mg/kg) once a week for 3 weeks (days 7, 14, 21), N = 7. Each treatment was administered for three cycles. Black arrows, lymphocytes. Scale bar, 100 μm E, Immune staining of several mouse tissues through anti-human nuclei antibody: eight-week-old NODSCID ilrg−/− female mice were injected intravenously with MEC1 cells, and the indicated tissues were collected and stained to identify the presence of human cells (leukemic lymphocytes; black arrows). Scale bar, 100 μm. Ad lib + vehicle, N = 8; STF = fasting + vehicle, N = 6; bortezomib + rituximab = Ad lib + bortezomib (0.35 mg/kg) + rituximab (10 mg/kg) once a week for 3 weeks (days 7, 14, 21), N = 7; STS + bortezomib + rituximab = fasting + bortezomib (0.35 mg/kg once a week) + rituximab (10 mg/kg) once a week for 3 weeks (days 7, 14, 21), N = 7. F, Effect of STF, bortezomib–rituximab, or their combination on CLL cell infiltration of the bone marrow, spleen, blood, and peritoneal exudates, as evaluated by FACS analysis. At the end of experimental procedures, cells collected from different organs or tissues were analyzed by flow cytometry after staining with mAb directed against human CD19, CD20, and CD45, respectively, to identify leukemic B-cell population. Ad lib + Vehicle, N = 7; STF = fasting + vehicle, N = 6; bortezomib + rituximab = Ad lib + bortezomib (0.35 mg/kg) + rituximab (10 mg/kg) once a week for 3 weeks (days 7, 14, 21), N = 7; STF + BTZ + RTX = fasting + bortezomib (0.35 mg/kg once a week) + rituximab (10 mg/kg) once a week for 3 weeks (days 7, 14, 21), N = 7.
Figure 4.
Cyclic fasting synergizes with bortezomib (BTZ)-rituximab (RTX) to retard CLL progression. A, Experimental scheme of fasting and BTX in an intravenous mouse CLL model (MEC1 cells). Three cycles of each of the indicated treatments were administered. B, Body weight (g) modifications over the time and under the indicated treatment conditions are represented. C, Spleen weight (mg) modifications over the time, and under the indicated treatment conditions, are represented. D, H&E staining of bone marrow, spleen, kidney, and liver. Ad lib + Vehicle, N = 8; STF + vehicle, N = 6; BTZ+RTX: Ad lib + bortezomib (0.35 mg/kg) + rituximab (10 mg/kg) once a week for 3 weeks (days 7, 14, 21), N = 7; STF + bortezomib +rituximab: Fasting + bortezomib (0.35 mg/kg once a week) + rituximab (10 mg/kg) once a week for 3 weeks (days 7, 14, 21), N = 7. Each treatment was administered for three cycles. Black arrows, lymphocytes. Scale bar, 100 μm E, Immune staining of several mouse tissues through anti-human nuclei antibody: eight-week-old NODSCID ilrg−/− female mice were injected intravenously with MEC1 cells, and the indicated tissues were collected and stained to identify the presence of human cells (leukemic lymphocytes; black arrows). Scale bar, 100 μm. Ad lib + vehicle, N = 8; STF = fasting + vehicle, N = 6; bortezomib + rituximab = Ad lib + bortezomib (0.35 mg/kg) + rituximab (10 mg/kg) once a week for 3 weeks (days 7, 14, 21), N = 7; STS + bortezomib + rituximab = fasting + bortezomib (0.35 mg/kg once a week) + rituximab (10 mg/kg) once a week for 3 weeks (days 7, 14, 21), N = 7. F, Effect of STF, bortezomib–rituximab, or their combination on CLL cell infiltration of the bone marrow, spleen, blood, and peritoneal exudates, as evaluated by FACS analysis. At the end of experimental procedures, cells collected from different organs or tissues were analyzed by flow cytometry after staining with mAb directed against human CD19, CD20, and CD45, respectively, to identify leukemic B-cell population. Ad lib + Vehicle, N = 7; STF = fasting + vehicle, N = 6; bortezomib + rituximab = Ad lib + bortezomib (0.35 mg/kg) + rituximab (10 mg/kg) once a week for 3 weeks (days 7, 14, 21), N = 7; STF + BTZ + RTX = fasting + bortezomib (0.35 mg/kg once a week) + rituximab (10 mg/kg) once a week for 3 weeks (days 7, 14, 21), N = 7.
Figure 5. Cyclic fasting and bortezomib + rituximab cooperate in retarding the growth of subcutaneous CLL masses. A, Experimental scheme of cyclic fasting and bortezomib (BTZ) + rituximab (RTX) in subcutaneous mouse CLL model (MEC1 cells). Each of the indicated treatments was administered for three cycles. B, Bar plots representing the volume of subcutaneous tumor masses collected at the end of the experiment and estimated through the formula indicated in Materials and Methods. C, Picture of some tumor masses after dissection. D, H&E-stained tumor sections from subcutaneous tumor masses explanted at the end of the experiment. Necrotic (Nec) and/or apoptotic areas (Apo) are visible in all experimental group (white boxes and higher magnifications). Scale bar, 50 μm. E, IHC analysis of cleaved caspase-3 expression in tumor masses collected at the indicated time points from animals exposed to the indicated treatment conditions. Three pictures are shown for each treatment condition.
Figure 5.
Cyclic fasting and bortezomib + rituximab cooperate in retarding the growth of subcutaneous CLL masses. A, Experimental scheme of cyclic fasting and bortezomib (BTZ) + rituximab (RTX) in subcutaneous mouse CLL model (MEC1 cells). Each of the indicated treatments was administered for three cycles. B, Bar plots representing the volume of subcutaneous tumor masses collected at the end of the experiment and estimated through the formula indicated in Materials and Methods. C, Picture of some tumor masses after dissection. D, H&E-stained tumor sections from subcutaneous tumor masses explanted at the end of the experiment. Necrotic (Nec) and/or apoptotic areas (Apo) are visible in all experimental group (white boxes and higher magnifications). Scale bar, 50 μm. E, IHC analysis of cleaved caspase-3 expression in tumor masses collected at the indicated time points from animals exposed to the indicated treatment conditions. Three pictures are shown for each treatment condition.
Figure 6. Cyclic FMD plus bortezomib + rituximab retards CLL progression in an intravenous CLL model. A, Spleen weight (mg) modifications over the time and under the indicated treatment conditions are represented. B, Effect of FMD, bortezomib + rituximab, or their combination, on the percentage of CLL cells in the bone marrow, spleen, blood and peritoneal exudates, as evaluated by FACS analysis. At the end of experimental procedures, cells collected from the indicated organs or tissues were analyzed by flow cytometry after staining with mAb against human CD19, CD20, and CD45 to identify leukemic B cell populations. Ad lib + Vehicle, N = 8; FMD: Fasting-mimicking diet + vehicle, N = 6; bortezomib + rituximab: Ad lib + bortezomib (0.35 mg/kg) + rituximab (10 mg/kg) once a week for 3 weeks (days 7, 14, 21), N = 7; FMD + bortezomib + rituximab: FMD + bortezomib (0.35 mg/kg once a week) + rituximab (10 mg/kg) once a week for 3 weeks (days 7, 14, 21), N = 7. C, H&E staining of bone marrow, spleen, kidney, and liver. Ad lib + Vehicle, N = 8; FMD: + vehicle, N = 6; bortezomib + rituximab: Ad lib + bortezomib (0.35 mg/kg) + rituximab (10 mg/kg) once a week for 3 weeks (days 7, 14, 21), N = 7; FMD + bortezomib + rituximab: fasting + bortezomib (0.35 mg/kg once a week) + rituximab (10 mg/kg) once a week for 3 weeks (days 7, 14, 21), N = 7. Each treatment was administered for three cycles. Black arrows and higer magnifications indicate hematoxylin-positive lymphocytes. Scale bar, 100 μm. D, Kaplan–Meier survival curves of mice randomly allocated to ad libitum diet (CTRL, N = 18), cyclic FMD (N = 18), bortezomib + rituximab (N = 18), or cyclic FMD+ bortezomib + rituximab (N = 18) in an intravenous CLL murine model. Bortezomib was administered up to a maximum of 5 cycles. FMD and rituximab were administered until unacceptable toxicities or animal death/sacrifice.
Figure 6.
Cyclic FMD plus bortezomib + rituximab retards CLL progression in an intravenous CLL model. A, Spleen weight (mg) modifications over the time and under the indicated treatment conditions are represented. B, Effect of FMD, bortezomib + rituximab, or their combination, on the percentage of CLL cells in the bone marrow, spleen, blood and peritoneal exudates, as evaluated by FACS analysis. At the end of experimental procedures, cells collected from the indicated organs or tissues were analyzed by flow cytometry after staining with mAb against human CD19, CD20, and CD45 to identify leukemic B cell populations. Ad lib + Vehicle, N = 8; FMD: Fasting-mimicking diet + vehicle, N = 6; bortezomib + rituximab: Ad lib + bortezomib (0.35 mg/kg) + rituximab (10 mg/kg) once a week for 3 weeks (days 7, 14, 21), N = 7; FMD + bortezomib + rituximab: FMD + bortezomib (0.35 mg/kg once a week) + rituximab (10 mg/kg) once a week for 3 weeks (days 7, 14, 21), N = 7. C, H&E staining of bone marrow, spleen, kidney, and liver. Ad lib + Vehicle, N = 8; FMD: + vehicle, N = 6; bortezomib + rituximab: Ad lib + bortezomib (0.35 mg/kg) + rituximab (10 mg/kg) once a week for 3 weeks (days 7, 14, 21), N = 7; FMD + bortezomib + rituximab: fasting + bortezomib (0.35 mg/kg once a week) + rituximab (10 mg/kg) once a week for 3 weeks (days 7, 14, 21), N = 7. Each treatment was administered for three cycles. Black arrows and higer magnifications indicate hematoxylin-positive lymphocytes. Scale bar, 100 μm. D, Kaplan–Meier survival curves of mice randomly allocated to ad libitum diet (CTRL, N = 18), cyclic FMD (N = 18), bortezomib + rituximab (N = 18), or cyclic FMD+ bortezomib + rituximab (N = 18) in an intravenous CLL murine model. Bortezomib was administered up to a maximum of 5 cycles. FMD and rituximab were administered until unacceptable toxicities or animal death/sacrifice.
Figure 7. Hypothetical model to explain the cooperative anti-CLL effect of fasting/FMD and bortezomib (BTZ). A, Because nutrient starvation slows down protein synthesis, at least in part as a result of reduced extracellular insulin and IGF1 concentration, it could result in the accumulation of misfolded proteins, which are degraded via the proteasome. B, When the proteasome is inhibited (through bortezomib) during starvation conditions, misfolded proteins cannot be timely degraded, and they may accumulate in the cytoplasm, with the results of an increased CLL cell toxicity.
Figure 7.
Hypothetical model to explain the cooperative anti-CLL effect of fasting/FMD and bortezomib (BTZ). A, Because nutrient starvation slows down protein synthesis, at least in part as a result of reduced extracellular insulin and IGF1 concentration, it could result in the accumulation of misfolded proteins, which are degraded via the proteasome. B, When the proteasome is inhibited (through bortezomib) during starvation conditions, misfolded proteins cannot be timely degraded, and they may accumulate in the cytoplasm, with the results of an increased CLL cell toxicity.

References

    1. Lee C, Raffaghello L, Brandhorst S, Safdie FM, Bianchi G, Martin-Montalvo A, et al. . Fasting cycles retard growth of tumors and sensitize a range of cancer cell types to chemotherapy. Sci Transl Med 2012;4:124ra27. - PMC - PubMed
    1. Di Biase S, Lee C, Brandhorst S, Manes B, Buono R, Cheng CW, et al. . Fasting-mimicking diet reduces HO-1 to promote T cell-mediated tumor cytotoxicity. Cancer Cell 2016;30:136–46. - PMC - PubMed
    1. Caffa I, Spagnolo V, Vernieri C, Valdemarin F, Becherini P, Wei M, et al. . Fasting-mimicking diet and hormone therapy induce breast cancer regression. Nature 2020;583:620–4. - PMC - PubMed
    1. Salvadori G, Zanardi F, Iannelli F, Lobefaro R, Vernieri C, Longo VD. Fasting-mimicking diet blocks triple-negative breast cancer and cancer stem cell escape. Cell Metab 2021;33:2247–59. - PMC - PubMed
    1. Di Tano M, Raucci F, Vernieri C, Caffa I, Buono R, Fanti M, et al. . Synergistic effect of fasting-mimicking diet and vitamin C against KRAS mutated cancers. Nat Commun 2020;11:2332. - PMC - PubMed

Publication types