. 2024 Mar 15;84(6):887-904.
doi: 10.1158/0008-5472.CAN-23-1908.

AKT1 interacts with DHX9 to Mitigate R Loop-Induced Replication Stress in Ovarian Cancer

Affiliations

AKT1 interacts with DHX9 to Mitigate R Loop-Induced Replication Stress in Ovarian Cancer

Tzu-Ting Huang et al. Cancer Res. .

Abstract

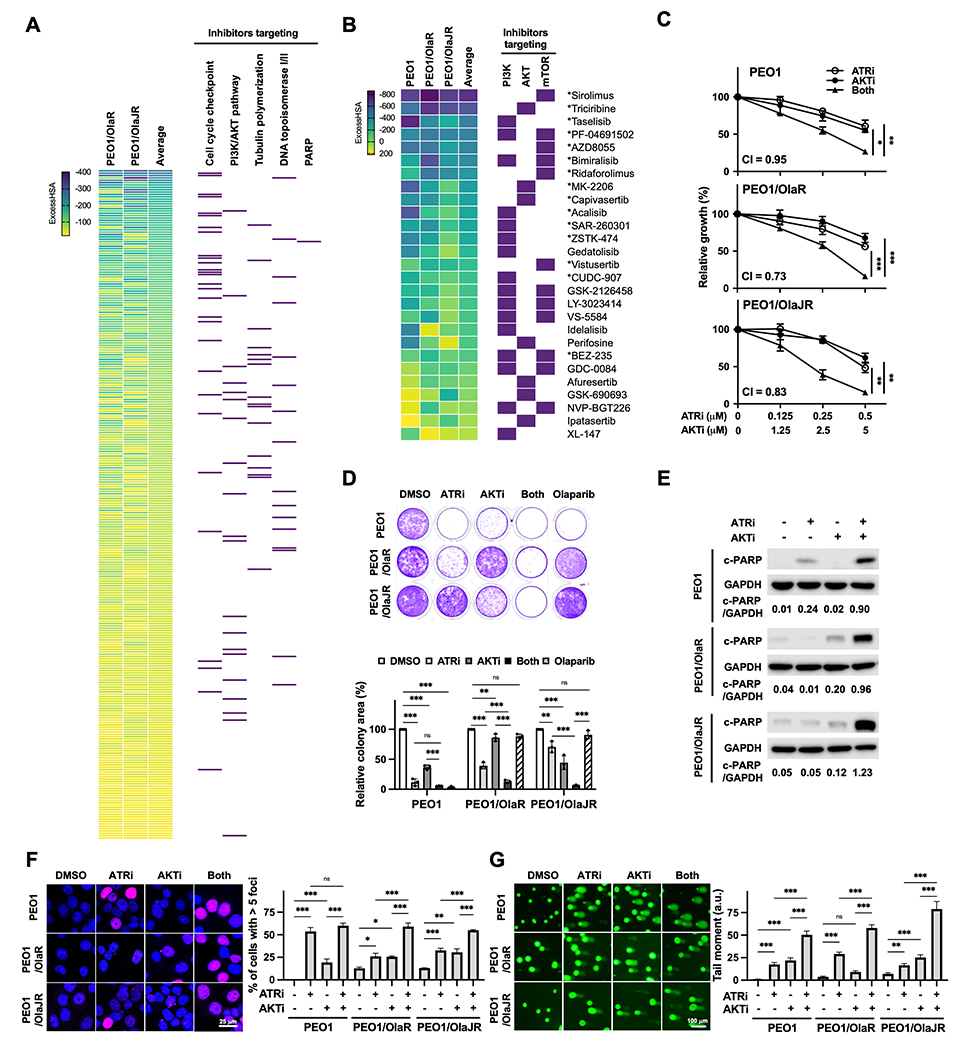
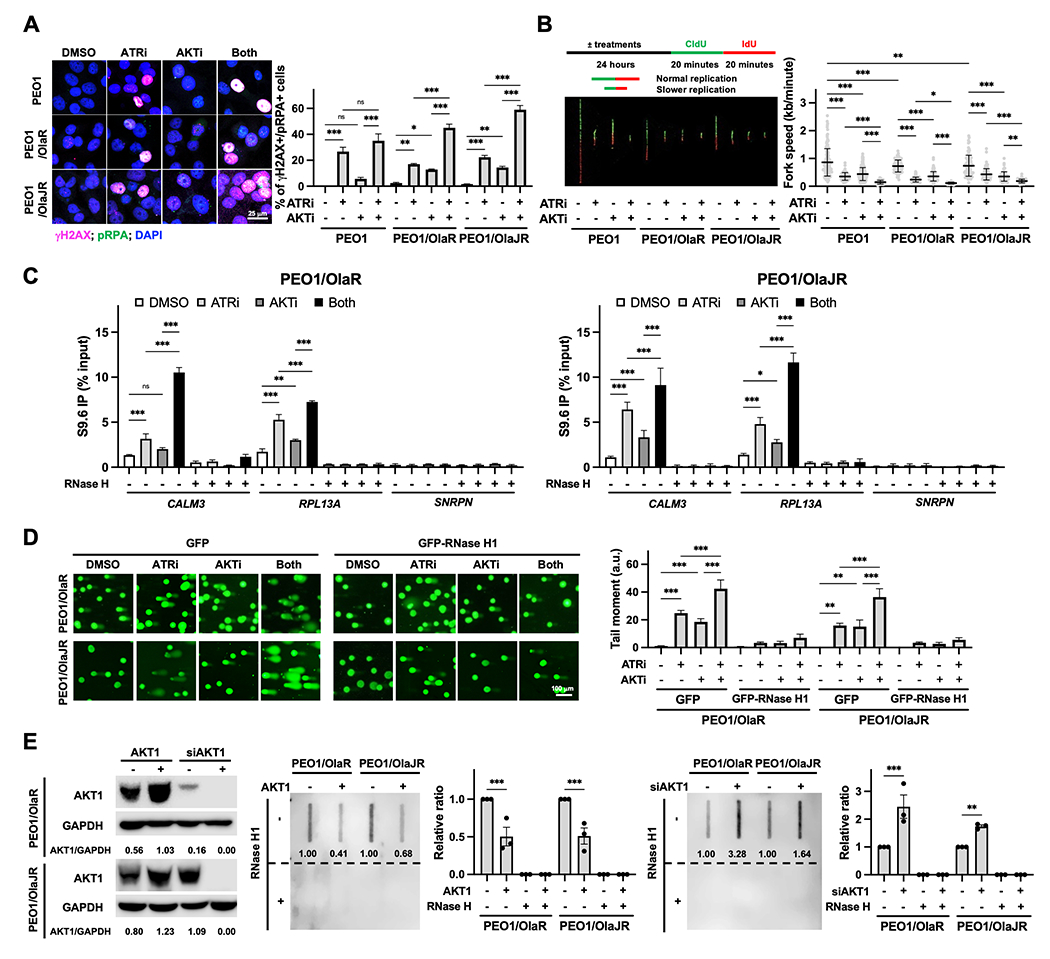
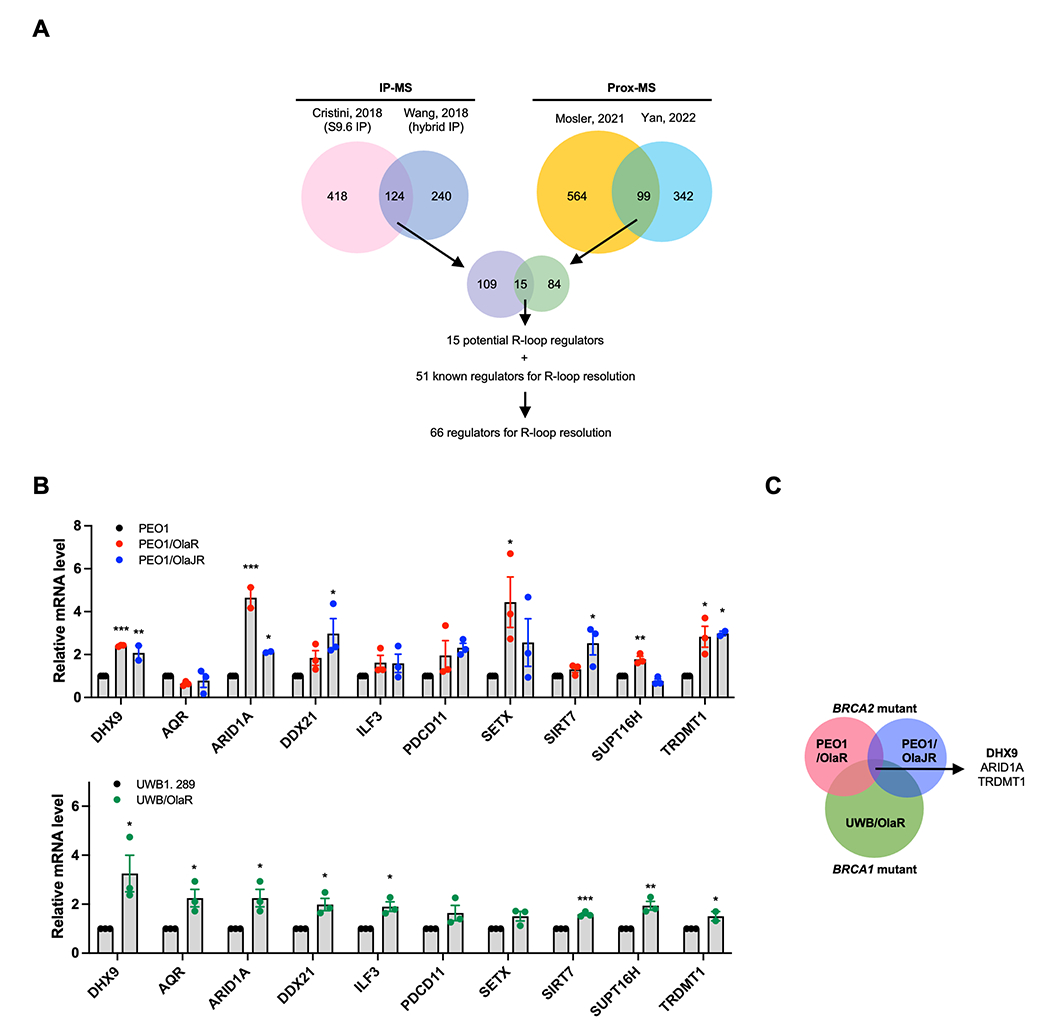
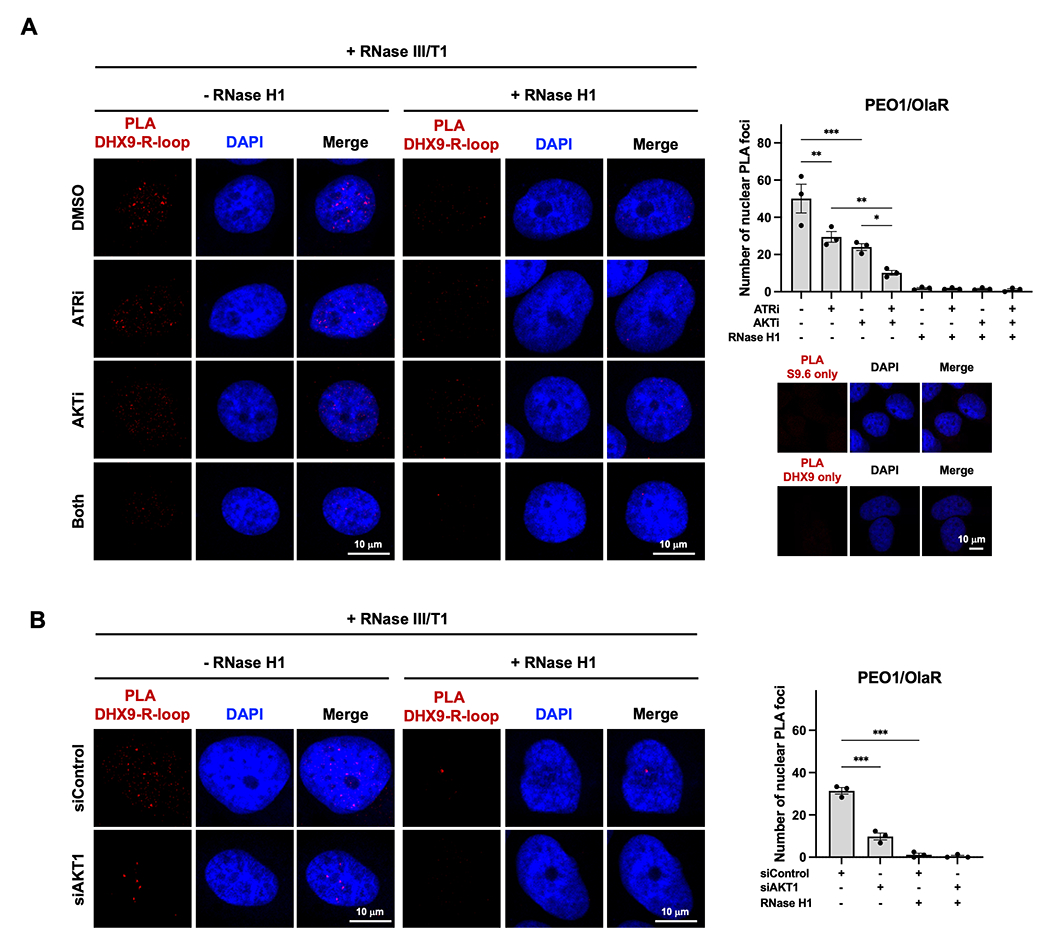
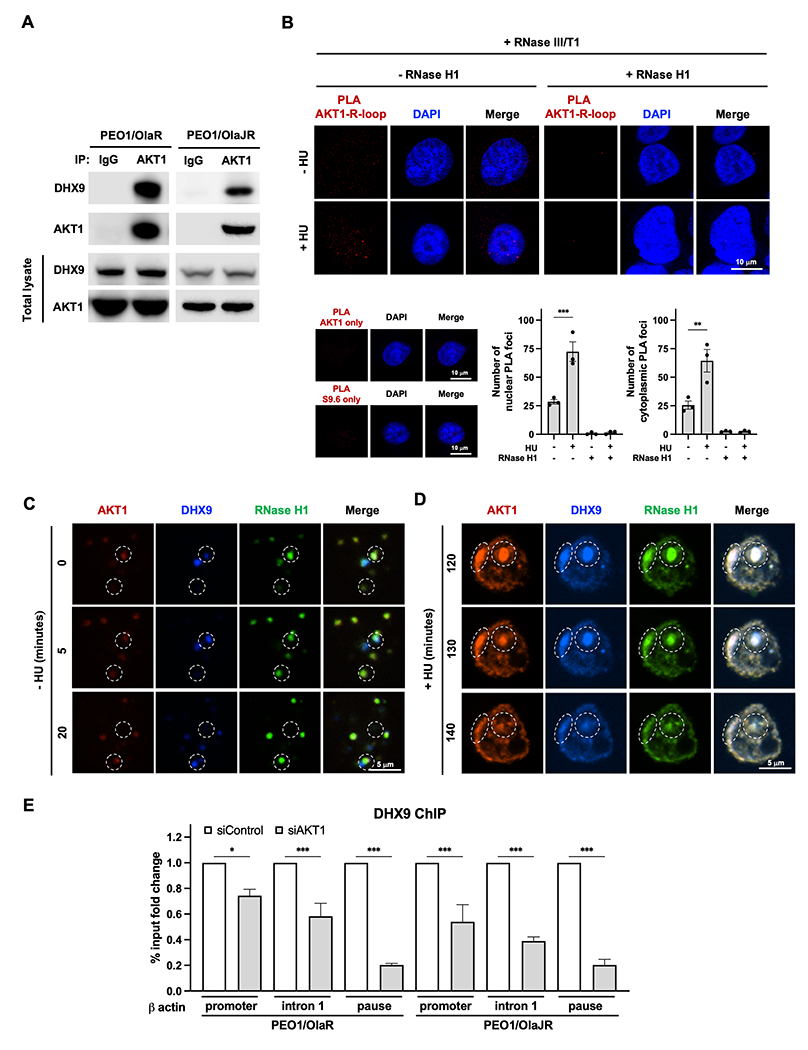
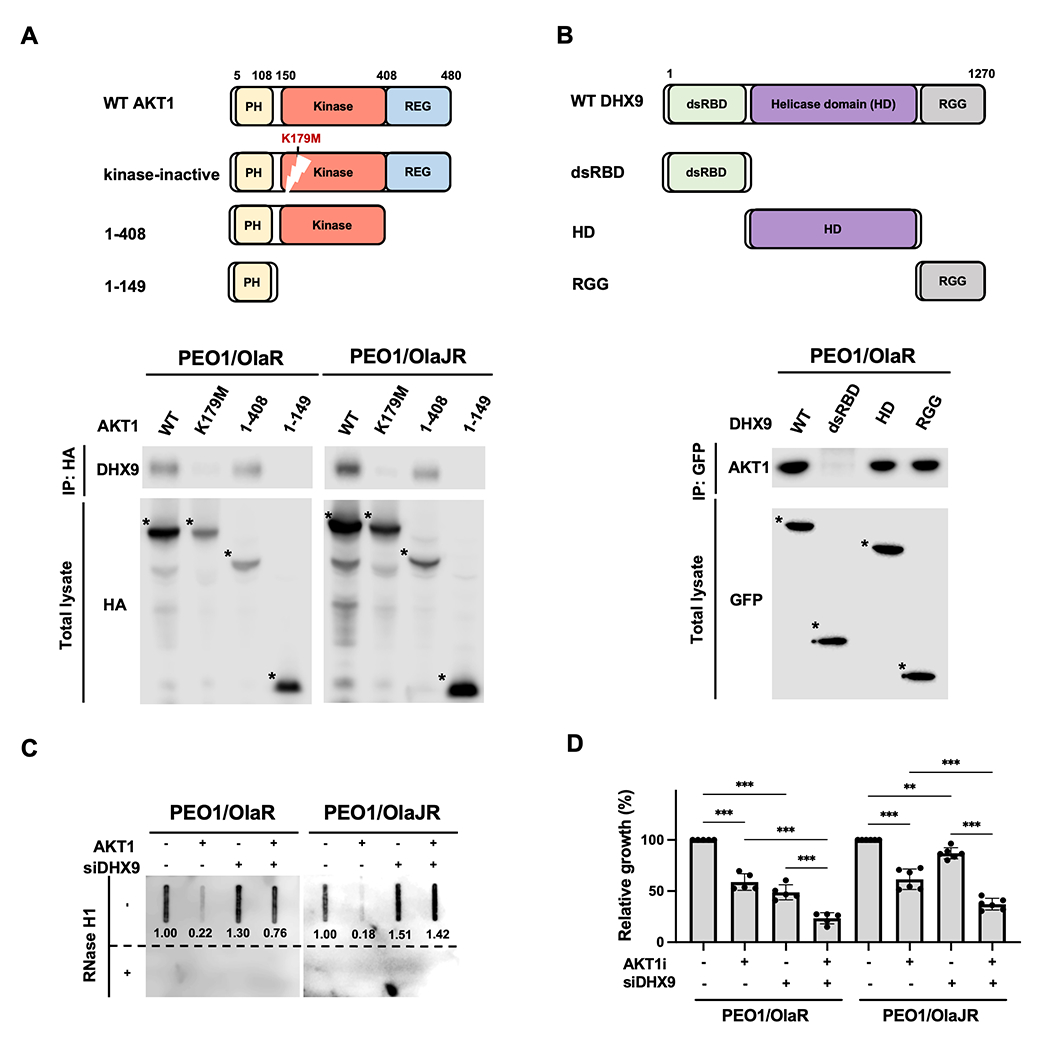
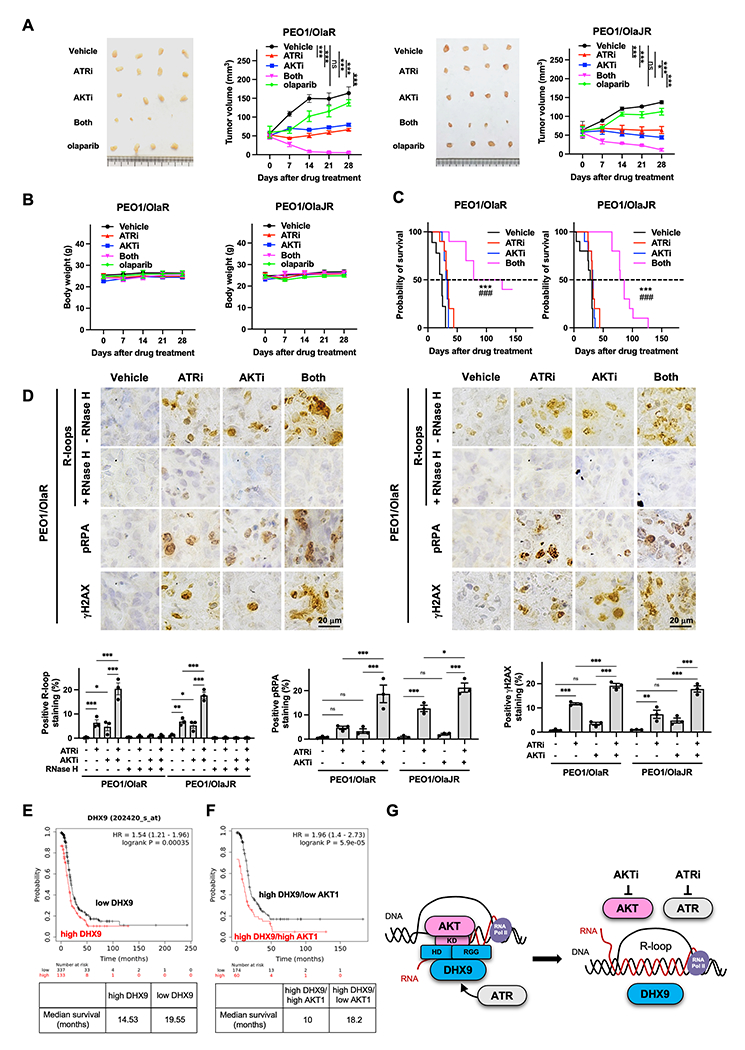
PARP inhibitor (PARPi)-resistant BRCA-mutant (BRCAm) high-grade serous ovarian cancer (HGSOC) represents a new clinical challenge with unmet therapeutic needs. Here, we performed a quantitative high-throughput drug combination screen that identified the combination of an ATR inhibitor (ATRi) and an AKT inhibitor (AKTi) as an effective treatment strategy for both PARPi-sensitive and PARPi-resistant BRCAm HGSOC. The ATRi and AKTi combination induced DNA damage and R loop-mediated replication stress (RS). Mechanistically, the kinase domain of AKT1 directly interacted with DHX9 and facilitated recruitment of DHX9 to R loops. AKTi increased ATRi-induced R loop-mediated RS by mitigating recruitment of DHX9 to R loops. Moreover, DHX9 was upregulated in tumors from patients with PARPi-resistant BRCAm HGSOC, and high coexpression of DHX9 and AKT1 correlated with worse survival. Together, this study reveals an interaction between AKT1 and DHX9 that facilitates R loop resolution and identifies combining ATRi and AKTi as a rational treatment strategy for BRCAm HGSOC irrespective of PARPi resistance status.

Significance: Inhibition of the AKT and ATR pathways cooperatively induces R loop-associated replication stress in high-grade serous ovarian cancer, providing rationale to support the clinical development of AKT and ATR inhibitor combinations. See related commentary by Ramanarayanan and Oberdoerffer, p. 793.


Conflict of interest statement

Conflict of interest: All authors declare no competing interests.

Figures

Figure 1.
Figure 1.. PI3K/AKT pathway inhibitors acting synergistically with an ATRi in PARPi-resistant BRCA2m HGSOC cells.
A, Hierarchal view of 6 × 6 initial drug combination screening in PARPi-resistant (PEO1/OlaR and PEO1/OlaJR) BRCA2m HGSOC cells. Drugs that were found to be synergistic with ATRi ceralasertib (ExcessHSA < −20) were ranked using the average ExcessHSA values; more negative ExcessHSA values indicate greater potency. Purple rectangles on the right highlight the agents from key mechanistic classes, including inhibitors targeting cell cycle checkpoint, PI3K/AKT pathway, topoisomerase I/II, tubulin polymerization, and PARP. B, 10 × 10 matrix screening of PI3K/AKT pathway inhibitors and ATRi ceralasertib in PARPi-sensitive (PEO1) and PARPi-resistant (PEO1/OlaR and PEO1/OlaJR) BRCA2m HGSOC cells. Purple rectangles on the right highlight drugs targeting PI3K isoform, AKT, and mTOR. * Indicates the synergy seen in all cell lines. C, Cell growth was assessed using XTT assays (n = 4). Cells were treated with ATRi ceralasertib and/or AKTi capivasertib at indicated doses for 5 days. Combination index (CI) values <1 indicate synergism. D, Long-term survival was evaluated by colony-forming assays (n = 3). Cells were treated with ATRi (0.5 μM) and/or AKTi (5 μM) and grown for 12 days. E-G, Cells were treated with ATRi (1 μM) and AKTi (10 μM) for 48 hours. E, Cell apoptosis effect was assessed by immunoblotting of cleaved PARP (c-PARP). GAPDH was used as a loading control. Densitometric values of c-PARP relative to GAPDH are shown. F-G, DNA damage was examined by immunofluorescence staining for γH2AX foci (n = 3) (F) and alkaline comet assay (n = 3) (G). F, Representative images of γH2AX foci (pink) and nuclei (DAPI, blue) (left). The percentage of cells with > 5 γH2AX foci representing cells with DNA damage is plotted (right). G, Representative images of comet assays are shown (left). The tail moment, including the product of the tail length and the fraction of total DNA, is plotted (right). Data from C, D, F, G were analyzed using one-way ANOVA test and shown as mean ± SEM. *, P < 0.05; **, P < 0.01; ***, P < 0.001; ns, not significant.
Figure 2.
Figure 2.. AKTi enhances ATRi-induced DNA damage and R-loop accumulation.
A, Immunofluorescence staining of γH2AX (pink; DNA damage marker) and pRPA (green; stalled replication fork marker) were performed to examine replication stress (n = 3). Cells were treated with ATRi ceralasertib (1 μM) and AKTi capivasertib (10 μM) for 48 hours. Representative images are shown (left). The percentage of double-positive cells, indicative of replication stress, is plotted (right). B, DNA fiber assays were performed to assess replication fork dynamics (n = 3). The schematics (left, top) and representative fibers (left, bottom) are shown. Average replication fork speeds in each group are shown (right). C, DRIP was conducted using the S9.6 monoclonal antibody in PARPi-resistant cells treated with ATRi and/or AKTi. RNase H treatment was used as a negative control. The qPCR analysis of R-loop positive foci of CALM3 and RPL13A genes and R-loop negative SNRPN gene (n = 3) was plotted using the percentage of input. D, Alkaline comet assay (n = 3) in cells treatment with ATRi ceralasertib (1 μM) and/or AKTi capivasertib (10 μM) in the presence of 20 μM pan-caspase inhibitor Z-VAD-FMK for 72 hours with GFP or GFP-RNase H1 overexpression. Representative immunofluorescence images of the comet tail are shown (left). The tail moment is plotted (right). E, Effect of AKT1 overexpression or knockdown on R-loop formation (n = 3). Cells were transfected with siAKT1 (25 nM) or HA-tagged AKT1 (2 mg) for 72 hours. The overexpression or knockdown efficiency of AKT1 was assessed by immunoblotting and GAPDH was used as a loading control. Densitometric values of AKT1 relative to GAPDH are shown (left). Dot-blot analysis of R-loops using S9.6 antibody in genomic DNA from transfected cells (right). Ratios relative to control group are shown. Bottom panels show the same analysis using genomic DNA after RNase H1 treatment were used as negative control. Data were analyzed using one-way ANOVA test and shown as mean ± SEM. *, P < 0.05; **, P < 0.01; ***, P < 0.001; ns, not significant.
Figure 3.
Figure 3.. R-loop resolution genes are upregulated in PARPi-resistant BRCAm HGSOC patients.
A, Scheme for generating the list of R-loop regulators identified by published proteomic studies. B, mRNA expression levels of R-loop resolution genes in PARPi-sensitive (PEO1, UWB1.289) and PARPi-resistant HGSOC cell lines (PEO1/OlaR, PEO1/OlaJR, UWB/OlaR) were analyzed by qPCR (n = 3). C, Venn diagram showing the overlap of upregulated R-loop regulators in PARPi-resistant BRCAm HGSOC cells. Data were analyzed using one-way ANOVA test and shown as mean ± SEM. *, P < 0.05; **, P < 0.01; ***, P < 0.001.
Figure 4.
Figure 4.. AKTi augments ATRi-induced R-loop accumulation by decreasing DHX9 recruitment to R-loops.
A-B, PARPi-resistant PEO1/OlaR cells were transfected with (+) or without (−) RNase H1. A, PLA was conducted to detect the interactions between R-loops and DHX9 in cells treated with ATRi ceralasertib (1 μM) and/or AKTi capivasertib (10 μM) for 48 hours (n = 3). Representative immunofluorescence images of DHX9-R-loops PLA foci (red) and DAPI (blue) in cells pretreated with RNase III/T1 treatment are shown (left). Number of PLA nuclear foci was plotted (right top). Representative immunofluorescence images of DHX9 or S9.6 antibody only PLA are shown (right bottom). B, Representative immunofluorescence images of DHX9-R-loops PLA foci (red) and DAPI (blue) in cells transfected with siRNAs against AKT1 or scramble control for 48 hours and RNase III/T1 pretreatment (left). Number of PLA nuclear foci was counted and plotted (right) (n = 3). Data were analyzed using one-way ANOVA test and shown as mean ± SEM. *, P < 0.05; **, P < 0.01; ***, P < 0.001; ns, not significant.
Figure 5.
Figure 5.. Endogenous AKT1 physically interacts with DHX9.
A, Co-IP was performed to study the interaction between endogenous DHX9 and AKT1 in PARPi-resistant BRCA2m HGSOC cells (n = 3). Bound AKT1 or DHX9 proteins were analyzed by immunoblotting. B, PLA was conducted to detect the interactions between R-loops and AKT1 under replication stress (n = 3). Representative immunofluorescence images of AKT1-R-loops PLA foci (red) and DAPI (blue) in cells treated with (+) or without (−) 4 mM HU treatment for 2 hours (toxic replication stress condition) with (+) or without (−) RNase H treatment are shown (left). Number of PLA nuclear foci was plotted (bottom). Data are shown as mean ± SEM. **, P < 0.01. C-D, AKT1 couples with DHX9 to resolve R-loops in PARPi-resistant BRCA2m HGSOC cells (n = 3). Representative images of AKT1 (red), and DHX9 (blue) and RNase H1 (green) in PEO1/OlaR cells (C) without (−) or (D) with (+) 4 mM HU treatment for 2 hours (toxic replication stress condition) captured from live cell imaging. In the same time frame (20 minutes), AKT1 showed up immediately when R-loops were displayed and cleared R-loops with DHX9 within 20 minutes (C, white dotted circle, captured from Supplementary Movie S1), while AKT1 and DHX9 and RNase H1 formed significantly larger foci in the nucleus of PARPi-resistant cells with HU treatment (D, white dotted circles, captured from Supplementary Movie S2). E, DHX9 ChIP in PARPi-resistant cells transfected siRNAs against AKT1 (siAKT1) or scramble control (siControl). ChIP-qPCR analysis of DHX9 recruitment to different R-loop-prone genomic regions of β actin was conducted. Data are presented as % input fold change compared to siControl group (n = 3). Data were analyzed using one-way ANOVA test and shown as mean ± SEM. *, P < 0.05; ***, P < 0.001.
Figure 6.
Figure 6.. AKT1 resolves R-loop formation by directly interacting with DHX9 via its kinase domain.
A-B, Schematic representations of AKT1, DHX9 and their serial-deletion mutants (top). Co-IP was performed to study the interaction between DHX9 and AKT1 (bottom). PARPi-resistant HGSOC cells were transfected with (A) HA-tagged full-length or deletion mutants of AKT1 or (B) GFP-tagged full-length or deletion mutants of DHX9. Cell lysates were collected for performing a co-IP assay (n = 3). Bound AKT1 or DHX9 proteins were analyzed by immunoblotting. The full-length or deletion mutants of AKT1 and DHX9 were detected (indicated as *). C, Dot-blot analysis of R-loops. Genomic DNAs were collected from PARPi-resistant cells transfected with siDHX9 and/or GFP-AKT1 (AKT1) for 72 hours. Ratios relative to control group are shown. Bottom panels show the same analysis using genomic DNAs after RNase H1 treatment as control. D, PARPi-resistant HGSOC cells were transfected with siRNAs against DHX9 or scramble controls for 48 hours and then treated with AKTi for another 48 hours. Cell growth was measured by XTT assay (n = 5). Data were analyzed using one-way ANOVA test and shown as mean ± SEM. **, P < 0.01; ***, P < 0.001.
Figure 7.
Figure 7.. ATRi and AKTi combination reduces tumor growth and prolongs survival, and high co-expression of DHX9 and AKT1 is associated with poor survival in HGSOC patients.
A-B, Tumor growth was measured using subcutaneous xenograft models (n = 4/group). Mice received vehicle, 130 mg/kg capivasertib, 50 mg/kg ceralasertib or 100 mg/kg olaparib. For combination, mice received 130 mg/kg capivasertib with or without 50 mg/kg ceralasertib. The tumor volume (A) and body weight (B) are plotted. Data were analyzed using one-way ANOVA test and shown as mean ± SEM. *, P < 0.05; **, P < 0.01; ***, P < 0.001; ns, not significant. C, Overall survival was studied using intraperitoneal injection models. Mice received vehicle, 130 mg/kg capivasertib and/or 50 mg/kg ceralasertib. Survival is shown by Kaplan–Meier curve using the Mantel-Cox log-rank test. Data are shown as mean ± SEM. *, ATRi versus both; #, AKTi versus both; ***, ###, P < 0.001. D, Representative IHC images of R-loops, pRPA, and γH2AX (upper). The percentage of IHC positive staining area of nuclear R-loops, pRPA, and γH2AX are plotted (n = 3, bottom). Data were analyzed using one-way ANOVA test and shown as mean ± SEM. *, P < 0.05; **, P < 0.01; ***, P < 0.001; ns, not significant. E-F, Prognostic value of DHX9 and AKT1 was obtained from Kaplan–Meier plotter (http://kmplot.com/analysis/) [ovarian cancer] database. E, HGSOC tumors with high (n = 337) and low DHX9 levels (n = 133) were divided using auto-select best cutoff on the website. F, HGSOC with high DHX9 levels were further divided into high- versus low-expression groups based on the median expression of AKT1 using multiple genes analysis. The progression-free survival of patients with HGSOC was analyzed by Kaplan–Meier plotter website, and the hazard ratios with 95% confidence intervals and log-rank P values were calculated. G, Proposed model of AKT1-dependent DHX9 function on R-loop resolution. While ATR is an important regulator of DNA replication and R-loop resolution, AKT1 also plays an essential role in R-loop resolution by directly recruiting DHX9 to R-loops through AKT1 kinase domain’s interaction with DHX9 helicase domain and RGG box. Hence, combined inhibition of AKT and ATR creates lethal replication stress by inducing aberrant R-loops in PARPi-resistant HGSOC.

Comment in

References

    1. Sung H, Ferlay J, Siegel RL, Laversanne M, Soerjomataram I, Jemal A, Bray F. Global Cancer Statistics 2020: GLOBOCAN Estimates of Incidence and Mortality Worldwide for 36 Cancers in 185 Countries. CA Cancer J Clin 2021;71:209–49 - PubMed
    1. Armstrong DK, Alvarez RD, Backes FJ, Bakkum-Gamez JN, Barroilhet L, Behbakht K, et al. NCCN Guidelines(R) Insights: Ovarian Cancer, Version 3.2022. J Natl Compr Canc Netw 2022;20:972–80 - PubMed
    1. Gralewska P, Gajek A, Marczak A, Rogalska A. Participation of the ATR/CHK1 pathway in replicative stress targeted therapy of high-grade ovarian cancer. J Hematol Oncol 2020;13:39. - PMC - PubMed
    1. Dias MP, Moser SC, Ganesan S, Jonkers J. Understanding and overcoming resistance to PARP inhibitors in cancer therapy. Nat Rev Clin Oncol 2021;18:773–91 - PubMed
    1. Gupta N, Huang T, Horibata S, Lee J. Cell cycle checkpoints and beyond: Exploiting the ATR/CHK1/WEE1 pathway for the treatment of PARP inhibitor–resistant cancer. Pharmacol Res 2022;178:106162. - PMC - PubMed

Publication types

MeSH terms