. 2024 Jan 18;187(2):446-463.e16.
doi: 10.1016/j.cell.2023.12.013.

Glioblastoma evolution and heterogeneity from a 3D whole-tumor perspective

Affiliations

Glioblastoma evolution and heterogeneity from a 3D whole-tumor perspective

Radhika Mathur et al. Cell. .

Abstract

Treatment failure for the lethal brain tumor glioblastoma (GBM) is attributed to intratumoral heterogeneity and tumor evolution. We utilized 3D neuronavigation during surgical resection to acquire samples representing the whole tumor mapped by 3D spatial coordinates. Integrative tissue and single-cell analysis revealed sources of genomic, epigenomic, and microenvironmental intratumoral heterogeneity and their spatial patterning. By distinguishing tumor-wide molecular features from those with regional specificity, we inferred GBM evolutionary trajectories from neurodevelopmental lineage origins and initiating events such as chromothripsis to emergence of genetic subclones and spatially restricted activation of differential tumor and microenvironmental programs in the core, periphery, and contrast-enhancing regions. Our work depicts GBM evolution and heterogeneity from a 3D whole-tumor perspective, highlights potential therapeutic targets that might circumvent heterogeneity-related failures, and establishes an interactive platform enabling 360° visualization and analysis of 3D spatial patterns for user-selected genes, programs, and other features across whole GBM tumors.

Keywords: brain tumors; chromatin accessibility; chromatin interactions; epigenomics; genomics; glioblastoma; intratumoral heterogeneity; microenvironment; spatial analysis; tumor evolution.


Conflict of interest statement

Declaration of interests The authors declare no competing interests.

Figures

Figure 1:
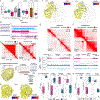
Figure 1:. 3D spatial sampling reveals patterns of GBM infiltration and clonal expansion
A) 3D model shows sample locations in context of the whole-tumor (yellow) and contrast-enhancing lesion (green). The number of samples with high-quality whole-exome sequencing (WES), RNA-Seq, Hi-C, and tissue and/or single-nucleus (sn-) ATAC-Seq datasets is shown. B) Purity (ψ) of samples located within (n=78) or outside (n=18) contrast-enhancing (CE) tumor regions, colored by patient. C) Calculation of relative distance from centroid (d) using measurements of minimum sample distance to tumor centroid (dC) and periphery (dp) (left) and association with purity (ψ) (right, legend as in 1B). D) 3D models showing low-purity samples P521_5, (ψ=0.03), P521_6 (ψ=0.06), and P457_7 (ψ=0.03). E) Schematic illustrating inference of evolutionary trajectories by whole-tumor sampling. F) Phylogenetic tree and 3D model for P530 show that samples 1–9 (subclone-A) are located in the temporal region and samples 10–19 (subclone-B) in the frontal region. Samples marked * have purity <0.5. G) Phylogenetic tree and 3D model for P529 show that samples 3, 4, 6, 8 (subclone-A) and samples 1, 2, 5, 7, 9, and 10 (subclone-B) are spatially intermixed. H) Distances between sample pairs (mm) from the same or different genetic subclone for P529 and P530.
Figure 2:
Figure 2:. Oncogene amplification and tumor suppressor deletion on the whole-tumor scale.
A) WES-derived copy number (CN) for all amplifications detected across patients. Red dotted line indicates CN=2 (diploid). Samples marked * have purity <0.5. B) ATAC-Seq and Hi-C-derived copy number variant (CNV) tracks in a patient without MDM4 amplification (P519) and two patients with tumor-wide MDM4 amplification (P498 and P521). The P519 ATAC-Seq track with 10X magnification is also shown. C) Hi-C maps comparing samples with (P529_1, upper-right) and without (P529_6, lower-left) EGFR amplification. Map with normalized signal also shown. D) 3D model showing tumor-wide NFASC::OPTC fusion transcript in P498. RNA-Seq track shows increased expression of NFASC and OPTC exons included in the fusion. E) 3D models showing EGFR versus PDGFRA amplification in P521. F) 3D model showing loss of PTEN in temporal region of P530. G) Hi-C map at PTEN locus comparing representative samples from P530 frontal (P530_18, upper right) and temporal (P530_2, lower left) regions. CNV, ATAC-Seq, and Hi-C loop tracks are shown below. H) ATAC signal at PTEN promoter and expression of PTEN, FAM35A, and RNLS in samples from the temporal versus frontal region. Statistical significance evaluated by T-tests. I) 3D model shows loss of CDKN2A in all P530 samples except P530_10 (ψ=0.49). J) Same as (G) for CDKN2A locus. K) Same as (H) for MTAP promoter and MTAP and KLHL9 expression.
Figure 3:
Figure 3:. Structural variants massively disrupt the genome and epigenome at multiple stages of GBM evolution.
A) Hi-C maps show chromothripsis on chr9 in P524_9 (upper right, ψ=0.89), but not in low-purity sample P524_1 (lower left, ψ=0.04). RT-PCR and Sanger sequencing validate presence of MLLT3::SLC24A2 and TESK::TRMT10B fusion transcripts in all samples except P524_1 (NTC=no template control). B) Reconstruction of Hi-C maps at MLLT3::SLC24A2 fusion junction reveals aberrant interactions across deletion breakpoints. C) Hi-C maps show chromothripsis on chr13 (left) and chr19 (right) in P529_1 and P529_6. Fusion transcripts RB1::LINC004411 and TTYH1::FOSB (bottom band) are present in all P529 samples. D) Hi-C maps show chr9 inversion in P529_6 (arrow), but not in P529_1. TSC1-CDKN2B-AS1 fusion transcript is present only in samples 3, 4, 6, 8 (upper band). E) Reconstruction of Hi-C maps at both ends of chr9 inversion. F) Inter-chromosomal Hi-C maps for P529_6 versus P529_1. The chr1:3 translocation creating the EPS15::CRYBG3 fusion is present in both samples while the chr3:6 translocation creating the LACE1::TIGIT fusion is present only in P529_6. G) Mutation-based phylogenetic tree for P529 (Fig 1G) labeled with additional tumor-wide and subclonal genomic alterations. H) BCR::NTRK2 fusion transcript detected in all P503 samples except those with low purity (P503_1 ψ=0.00, P503_2 ψ=0.03). I) EGFR-SEPT14 fusion transcript is detected only in two samples from P498. J) MHC-I presentation predictions by MHCflurry and HLAthena for fusion-derived peptides in P529. Candidates passing both algorithms are highlighted for RT-PCR validated fusions.
Figure 4:
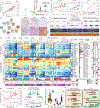
Figure 4:. Transcriptomic heterogeneity in 3D spatially-defined GBM microenvironments.
A) 3D models show samples colored by subtype with highest average expression. Heatmap shows average expression for all subtypes with annotations for sample purity (ψ) and relative distance from centroid (d). B) Purity (ψ, above) and relative distance from centroid (d, bottom) for samples classified by subtype. C) Heatmap shows average expression of genes in each RNA module (R_) across samples annotated by purity (ψ), relative distance from centroid (d), and subtype. Variance across samples is shown for each module with annotations for number of constituent genes, top result from enrichment analysis, and correlations with sample purity (Rψ) and relative distance from centroid (Rd). D) Average expression of R_brown (oligodendrocyte), R_plum (astrocyte), and R_orangered3 (neuron) modules across samples colored by subtype (legend as in 4C). E) Average expression of R_lightcoral versus relative sample distance from centroid (d), colored by subtype. F) Representative images of tumor targets from P521_2 and P529_9 with immunostaining for T cells (CD3, red), microglia/macrophages (Iba1, green), and a marker of immunosuppressive alternatively activated microglia/macrophages (CD163, white). Nuclei are stained with DAPI (blue) and bar denotes 50 um. G) Average expression of R_midnightblue, R_plum2, R_plum3, and R_darkred across samples colored by subtype. H) 3D model for P530 shows average expression of R_plum2 across samples. I) Average expression of R_darkred in samples from contrast-enhancing (CE) and non-CE regions, colored by subtype. J) Summary figure showing AP-1-driven mesenchymal differentiation programs active in tumor cells, microglia, and stromal cells.
Figure 5:
Figure 5:. Neurodevelopmental programs reflect GBM lineage origins and contribute to heterogeneity.
A) Average expression of R_turquoise versus sample purity (ψ) colored by patient. Venn diagram shows overlap of R_turquoise constituent genes with the IPC.div2 signature; top-ranked genes within overlap are shown. B) Schematic illustrating differentiation of radial glia (RG) and outer radial glia (oRG) through intermediate progenitor cells (IPCs) to oligodendrocyte precursor cells (OPCs) or neurons. PTPRZ1 is expressed through oRG differentiation to OPCs. C) Average expression of R_brown2, R_maroon, and R_ivory by sample purity (ψ) colored by patient. Linear model shown separately for P475 (brown) and remaining 9 patients (grey). D) Drivers of neuronal fate specification identified by STRING network analysis of R_ivory constituent genes. E) Immunohistochemical staining for TTF-1 and PTPRZ1 protein in representative tumor tissue sections from two patients with IDH-WT GBM with primitive neuronal component (P475 and P565) and one without (P530). Bar denotes 30μm. F) Schematic showing derivation and annotation of RNA (R_), Linkage (L_), and ATAC (A_) modules from transcriptomic and chromatin landscape datasets. G) Heatmap showing average ATAC-Seq signal for ATAC (A_) and linkage (L_) modules across samples annotated by purity (ψ), relative distance from centroid (d), and subtype. Variance across samples is shown for all modules annotated by number of constituent peaks, top result from motif analysis, and correlations with sample purity (Rψ) and relative distance from centroid (Rd). H) Average ATAC signal for L_navajowhite1 by sample purity (ψ) colored by patient. Linear model shown separately for P475 (brown) and remaining patients (grey). I) Transcription factor footprinting identifies NEUROD1 binding sites within A_darkseagreen3 peaks at the NEUROD1 promoter and an intronic NEUROD1 enhancer. Merged ATAC-Seq track for P500 samples is shown. J) NEUROD1 gene expression for samples from all patients including P565. K) Summary of distinct mechanisms of NEUROD1 activation in GBM from the common lineage origin (P500) versus GBM with primitive neuronal component (P475 and P565).
Figure 6:
Figure 6:. Intratumoral heterogeneity of GBM chromatin landscapes from 3D-spatial to single-cell resolution
A) Number of cells profiled by snATAC with UMAP projections, colored by sample. B) Same as (A) colored by neoplastic status. C) Cells with highest read-in-peak scores for modules associated with microglia (A_magenta4, A_skyblue4, L_plum2), neurons (A_thistle1; A_honeydew, L_mediumpurple1), or oligodendrocytes (A_lavenderblush2; L_coral, A_coral). D) Read-in-peak scores in cell types from normal adult brain. E) EGFR versus PDGFRA-amplified cells from P521. Proportion of EGFR v. PDGFRA amplified neoplastic cells also shown for individual samples. F) Read-in-peak scores for A_plum3, A_yellowgreen, and A_coral in EGFR-amplified versus PDGFRA-amplified neoplastic cells from P521. Legend as in (E). G) Summary figure showing NFIA/SOX9-mediated activation of the astrocytic program and SOX10-mediated activation of the OPC program in EGFR versus PDGFRA-amplified cells from P521. H) Average ATAC signal of L_salmon4 versus EGFR copy number, colored by patient. I) Read-in-peak scores for L_salmon4 in neoplastic cells with and without EGFR amplification from P521 and P529. J) Hi-C-derived A/B tracks showing ELOVL2 and NOVA1 in open ‘A’ chromatin compartments only in EGFR-amplified samples P524_9 and P529_1. K) Read-in-peak scores for L_orangered3 in P519 and P529.
Figure 7:
Figure 7:. GBM heterogeneity and evolution redefined in 3D whole-tumor space.
A) GBM chromatin and transcriptomic programs in 3D whole-tumor space. Correlations with sample purity (Rψ) and relative sample distance from centroid (Rd) are shown for individual constituent peaks of chromatin programs (left) and individual constituent genes of transcriptomic programs (right). B) GBM chromatin programs at single-cell resolution. Cells are colored by chromatin program as in (A) for the module with most reads-in-peaks. C) Summary table showing modular activation of GBM chromatin and gene expression programs in individual patients and tumor regions.

Comment in

References

    1. Black JRM, and McGranahan N (2021). Genetic and non-genetic clonal diversity in cancer evolution. Nat. Rev. Cancer, 1–14. 10.1038/s41568-021-00336-2. - DOI - PubMed
    1. Nicholson JG, and Fine HA (2021). Diffuse Glioma Heterogeneity and Its Therapeutic Implications. Cancer Discov. 11, 575–590. 10.1158/2159-8290.CD-20-1474. - DOI - PubMed
    1. Marusyk A, Janiszewska M, and Polyak K (2020). Intratumor Heterogeneity: The Rosetta Stone of Therapy Resistance. Cancer Cell 37, 471–484. 10.1016/j.ccell.2020.03.007. - DOI - PMC - PubMed
    1. Brennan CW, Verhaak RGW, McKenna A, Campos B, Noushmehr H, Salama SR, Zheng S, Chakravarty D, Sanborn JZ, Berman SH, et al. (2013). The Somatic Genomic Landscape of Glioblastoma. Cell 155, 462–477. 10.1016/j.cell.2013.09.034. - DOI - PMC - PubMed
    1. Ceccarelli M, Barthel FP, Malta TM, Sabedot TS, Salama SR, Murray BA, Morozova O, Newton Y, Radenbaugh A, Pagnotta SM, et al. (2016). Molecular Profiling Reveals Biologically Discrete Subsets and Pathways of Progression in Diffuse Glioma. Cell 164, 550–563. 10.1016/j.cell.2015.12.028. - DOI - PMC - PubMed

Publication types