. 2024 Feb 20;5(2):101386.
doi: 10.1016/j.xcrm.2023.101386. Epub 2024 Jan 18.

Inhibition of CSF-1R and IL-6R prevents conversion of cDC2s into immune incompetent tumor-induced DC3s boosting DC-driven therapy potential

Affiliations

Inhibition of CSF-1R and IL-6R prevents conversion of cDC2s into immune incompetent tumor-induced DC3s boosting DC-driven therapy potential

Anouk M D Becker et al. Cell Rep Med. .

Abstract

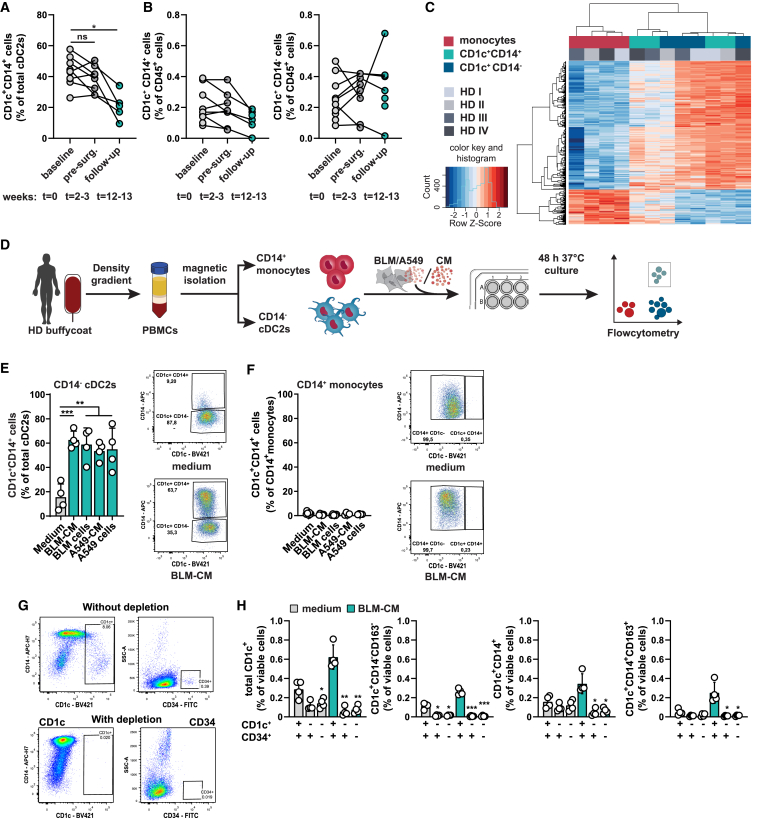
The human dendritic cell (DC) family has recently been expanded by CD1c+CD14+CD163+ DCs, introduced as DC3s. DC3s are found in tumors and peripheral blood of cancer patients. Here, we report elevated frequencies of CD14+ cDC2s, which restore to normal frequencies after tumor resection, in non-small cell lung cancer patients. These CD14+ cDC2s phenotypically resemble DC3s and exhibit increased PD-L1, MERTK, IL-10, and IDO expression, consistent with inferior T cell activation ability compared with CD14- cDC2s. In melanoma patients undergoing CD1c+ DC vaccinations, increased CD1c+CD14+ DC frequencies correlate with reduced survival. We demonstrate conversion of CD5+/-CD1c+CD14- cDC2s to CD14+ cDC2s by tumor-associated factors, whereas monocytes failed to express CD1c under similar conditions. Targeted proteomics identified IL-6 and M-CSF as dominant drivers, and we show that IL-6R and CSF1R inhibition prevents tumor-induced CD14+ cDC2s. Together, this indicates cDC2s as direct pre-cursors of DC3-like CD1c+CD14+ DCs and provides insights into the importance and modulation of CD14+ DC3s in anti-tumor immune responses.

Keywords: DC3s; cDC2s; conventional DCs; development; immunotherapy; lung cancer; melanoma; monocytes.


Conflict of interest statement

Declaration of interests The authors declare no competing interests.

Figures

None
Graphical abstract
Figure 1
Figure 1
Peripheral blood of lung cancer patients shows increased frequencies of CD1c+CD14+ cells with reduced CD4 T cell activation capability (A) Ratio of CD14+ and CD14 cells within CD1c+ cells in peripheral blood of healthy donors (HDs) (n = 6), non-small cell lung cancer (NSCLC) patients (n = 7), and melanoma (MEL) patients (n = 7). Each symbol represents a biological replicate (mean ± SD; one-way ANOVA and Tukey’s multiple comparisons test). (B) Schematic of the assays for (C–F). (C) Phenotypic hallmarks of freshly isolated CD1c+CD14+ (Log2 fold change [FC] vs. CD1c+CD14 cells, mean ± SD, paired t test). Each plot is accompanied by a representative histogram. (D) Summarizing illustration of phenotypic hallmarks. (E) Allogeneic CD4 and CD8 T cell proliferation after 5-day co-culture with immature CD1c+CD14 or CD1c+CD14+ cells (mean ± SD, paired t test). Biological replicates were n = 6 for NSCLC patients, n = 5 for HDs, each one consisting of technical duplicates. (F) MERTK expression differences between NSCLC patients and HDs accompanied by representative histograms (mean ± SD, two-way ANOVA, Sidak’s multiple comparison test). For (C) and (F), n = 4 biological replicates for HDs and n = 6 for NSCLC patients. gMFI, geometric mean fluorescent intensity ∗p < 0.05, ∗∗p < 0.01. See also Figure S1.
Figure 2
Figure 2
CD1c+CD14+ cells produce high amounts of pro-inflammatory cytokines, but weak tumor antigen-specific CD8 T cell responses (A) CD1c+CD14 and CD1c+CD14+ cells from HDs (n = 5) and NSCLC patients (n = 6) were FACS sorted and cultured overnight with or without poly(I:C) (20 μg/mL) and R848 (4 μg/mL). Cytokine quantification in supernatants was performed using the LEGENDplex Human Inflammation panel. (B) Heatmap displaying Z scores calculated on log-transformed data of the average cytokine concentrations for all conditions (B, left) and separately for unstimulated and stimulated conditions (B, right), with n = 5 biological replicates for HDs and n = 6 for NSCLC patients. See also Table S3. (C and D) (C) Representative dot plots and PD-1 histogram showing gating strategy to analyze the activation of CD8 T cells (D) transfected with NY-ESO1-specific TCR, by autologous FACS-sorted CD1c+CD14 and CD1c+CD14+ cells from HLA-A∗02:01+ HDs that were pre-treated with irrelevant (Irr.) peptide, PepTivator NY-ESO1 (mainly 15-mer peptide mix), or NY-ESO1p157-165 peptide. (E) Cytokines secreted in culture media after 24 h of co-culture. (F) Gating strategy, CD4 T cell proliferation, and frequency of regulatory CD4 T cells of CD4 T cells transfected with NY-ESO1-specific TCR, activated by autologous FACS-sorted CD1c+CD14 and CD1c+CD14+ cells from HLA-DRB1∗04:01+ HDs (n = 4) that were pre-treated with irrelevant (Irr.) peptide, PepTivator NY-ESO1 (mainly 15-mer peptide mix), or NY-ESO1p117-143 peptide. (G) Cytokines secreted in culture medium after 24 h of co-culture. (D–G) Symbols depict individual donors, with n = 4 biological replicates for all experiments, each the mean of technical triplicates (mean ± SD, repeated measures [RM] one-way ANOVA with Sidak’s multiple comparisons test) ∗p < 0.05 See also Figure S2.
Figure 3
Figure 3
cDC2s, but not monocytes, transdifferentiate into CD1c+CD14+ cells in response to tumor cues (A and B) Frequency of CD1c+CD14+ cells expressed as fraction of total cDC2s (A) and total CD45+ cells (B) in peripheral blood of NSCLC patients over the course of treatment in the DONAN trial. Baseline, prior to Durvalumab (anti-PD-L1) treatment (t = 0); pre-surg., after two courses of Durvalumab before surgery for NSCLC tumor resection (t = week 2–3) and follow-up 10 weeks after surgery (t = week 12–13). Each symbol represents a patient, lines connect different time points from the same patient (mixed effects analysis, Dunnett’s multiple comparisons test), with n = 10, 8, and 7 biological replicates for the different time points, respectively. (C) Heatmap displaying DEGs between CD1c+CD14 cells vs. CD14+ monocytes and CD1c+CD14+ cells vs. CD14+ monocytes, as analyzed by RNA Affymetrix Array Eurofins. Number of probes used for hierarchical clustering in heatmap is 387, n = 4 biological replicates. (D–F) (D) Schematics of the assays for (E and F) in which the induction of CD1c+CD14+ cells is analyzed after a 2-day co-culture of CD14 cDC2s (E) or CD14+ monocytes (F) from HDs with medium, melanoma BLM conditioned medium (CM), BLM cells, lung cancer A549-CM, or A549 cells. Each symbol represents an individual cDC2 (E) or monocyte (F) donor, performed for n = 4 biological replicates (mean ± SD; one-way ANOVA and Dunnett’s multiple comparisons test). (G and H) (G) Representative flow cytometry dot plots before and after depletion of CD1c and CD34 from PBMCs of HDs, which were subsequently cultured for 2 days in medium or 50% BLM-CM (H). Each symbol represents a biological replicate (n = 4) (mean ± SD), asterisks depict significance vs. medium or BLM-CM (one-way RM ANOVA with Dunnett’s multiple comparisons test). ∗p < 0.05, ∗∗p < 0.01, ∗∗∗p < 0.001. See also Figure S3.
Figure 4
Figure 4
Tumor-associated proteins M-CSF and IL-6 drive transdifferentiation toward CD14+ cDC2s (A) Screening of 24 h serum-free CM of several cancer cell lines for their ability to induce CD14+ cDC2s from HD, each symbol depicts a biological replicate (mean ± SD, n = 6) (mixed effects analysis, Dunnett’s multiple comparisons test). (B) Volcano plot displaying the log2 fold change against –log 10 statistical p value for 92 proteins from the OLINK Immuno-Oncology Panel, with n = 3 (BLM, A375, A549) over n = 4 (FM3, MEWO, Mel624, Mel603) different cell lines. (C) Effect of 2-day culture treatment with recombinant human cytokines on CD14+ cDC2 induction compared with medium. Each symbol represents a biological replicate (mean ± SD), asterisks show significant results compared with medium (mixed effects analysis, Fisher’s LSD). (D and E) Heatmaps showing scaled NPX values of all proteins differentially expressed between BLM/A375/A549-CM (n = 3) and the CM of control cancer cell lines (n = 4) in all individual CM is depicted in (D) and for melanoma (MEL) and healthy donor (HD) serum (without row clustering) in (E), with each heatmap cell showing a biological replicate (n = 4 for MEL, n = 6 for HD). (F) Induction of CD14+ cDC2s in the absence or presence of 1 μM STAT3 inhibitor (STAT3i) Stattic after a 2-day culture period with 50% BLM-CM, 25 ng/mL IL-6 and/or 25 ng/mL M-CSF. Each symbol represents an individual donor, with n = 4 biological replicates (mean ± SD, one-way RM ANOVA with Dunnett’s multiple comparisons test between untreated and STAT3i per condition). ∗p < 0.05, ∗∗p < 0.01, ∗∗∗p < 0.001, ∗∗∗∗p < 0.0001. See also Figures S4A–S4C.
Figure 5
Figure 5
Healthy cDC2s have phenotypic plasticity and once matured do not convert to CD14+ cDC2s (A and B) Frequencies of CD14+ cDC2s after culturing CD14 cDC2s 2 days in the presence or absence of 20 ng/mL TNF-α and/or IL-1β (A) or 800 U/mL GM-CSF or TLR ligands poly(I:C) (20 μg/mL) and R848 (4 μg/mL) (B), with and without BLM-CM. (C) Frequencies of CD14 (left) and CD14+ (right) cDC2s after CD14 cDC2 isolation (D0) and after culturing with and without maturation stimuli, prior to BLM-CM. (D and E) Schematic of the assay and graph showing percentages of CD14+ cDC2s normalized to D0 after culturing CD14+ cDC2s from HDs (D) and normalized to D1 after inducing CD14+ cDC2s with BLM-CM (E), both with 10 ng/mL TNF-α and/or IL-1β. (A–E) Each symbol represents a biological replicate (mean ± SD). Asterisks depict significance compared with D0 (A–D) or D1 (E) (RM one-way ANOVA, Dunnett’s multiple comparisons test). ∗p < 0.05, ∗∗p < 0.01, ∗∗∗p < 0.001. See also Figures S4D and S4E.
Figure 6
Figure 6
Modulation of cDC2s with anti-IL-6R and CSF1Ri prevents CD14+ cDC2s and enhances T cell activation (A–C) (A) Schematic of the assays. Effect on CD14+ cDC2 frequencies after 2 days cultured with 1 ng/mL IL-6 and 10 μg/mL tocilizumab (αIL-6R) (B, left), 10 ng/mL M-CSF and 100 nM sunitinib (CSF1Ri) or 10 μg/mL αM-CSF antibody (B, right), or BLM-CM and both drugs (C). (D) Capacity of cDC2s, cultured for 2 days with or without BLM-CM and αIL-6R + CSF1Ri to induce allogeneic CD4 and CD8 T cell proliferation after a 4-day co-culture. (E) HLA-DR expression on cDC2s on day 2 prior to addition of T cells. (B–E) Each symbol represents a biological replicate (mean ± SD). RM one-way ANOVA, Dunnett’s multiple comparisons test, vs. IL-6 (B), M-CSF (B), or the BLM-CM condition (C–E). ∗p < 0.05, ∗∗p < 0.01, ∗∗∗p < 0.001, gMFI, geometric mean fluorescent intensity. See also Figure S5.

References

    1. Villani A.C., Satija R., Reynolds G., Sarkizova S., Shekhar K., Fletcher J., Griesbeck M., Butler A., Zheng S., Lazo S., et al. Single-cell RNA-seq reveals new types of human blood dendritic cells, monocytes, and progenitors. Science. 2017;356 - PMC - PubMed
    1. Ginhoux F., Guilliams M., Merad M. Expanding dendritic cell nomenclature in the single-cell era. Nat. Rev. Immunol. 2022;22:67–68. - PubMed
    1. Guilliams M., Ginhoux F., Jakubzick C., Naik S.H., Onai N., Schraml B.U., Segura E., Tussiwand R., Yona S. Dendritic cells, monocytes and macrophages: a unified nomenclature based on ontogeny. Nat. Rev. Immunol. 2014;14:571–578. - PMC - PubMed
    1. Dutertre C.A., Becht E., Irac S.E., Khalilnezhad A., Narang V., Khalilnezhad S., Ng P.Y., van den Hoogen L.L., Leong J.Y., Lee B., et al. Single-Cell Analysis of Human Mononuclear Phagocytes Reveals Subset-Defining Markers and Identifies Circulating Inflammatory Dendritic Cells. Immunity. 2019;51:573–589.e8. - PubMed
    1. Kvedaraite E., Ginhoux F. Human dendritic cells in cancer. Sci. Immunol. 2022;7 - PubMed

Publication types

MeSH terms

Substances

Associated data