. 2024 Mar 11;42(3):396-412.e5.
doi: 10.1016/j.ccell.2023.12.021. Epub 2024 Jan 18.

Cancer-associated fibroblast phenotypes are associated with patient outcome in non-small cell lung cancer

Affiliations

Cancer-associated fibroblast phenotypes are associated with patient outcome in non-small cell lung cancer

Lena Cords et al. Cancer Cell. .

Abstract

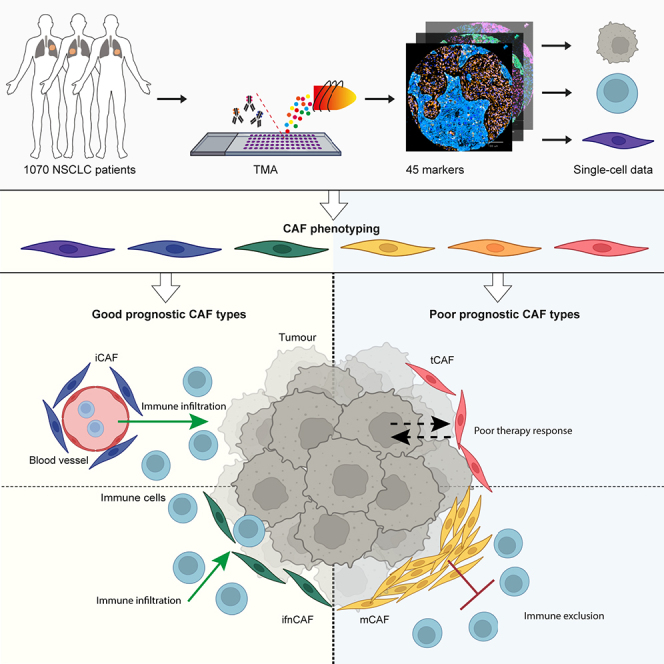
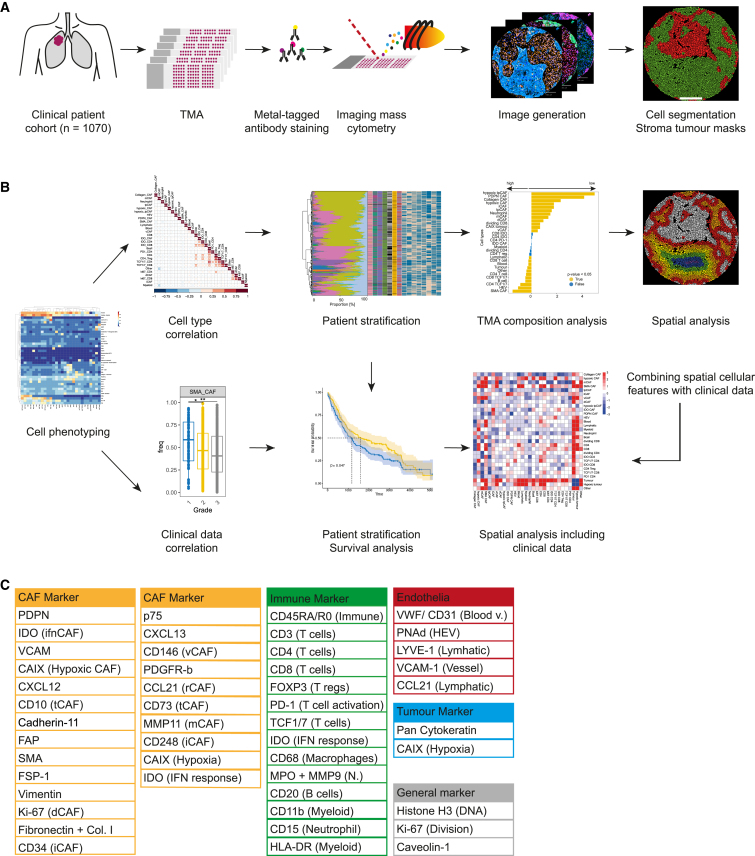
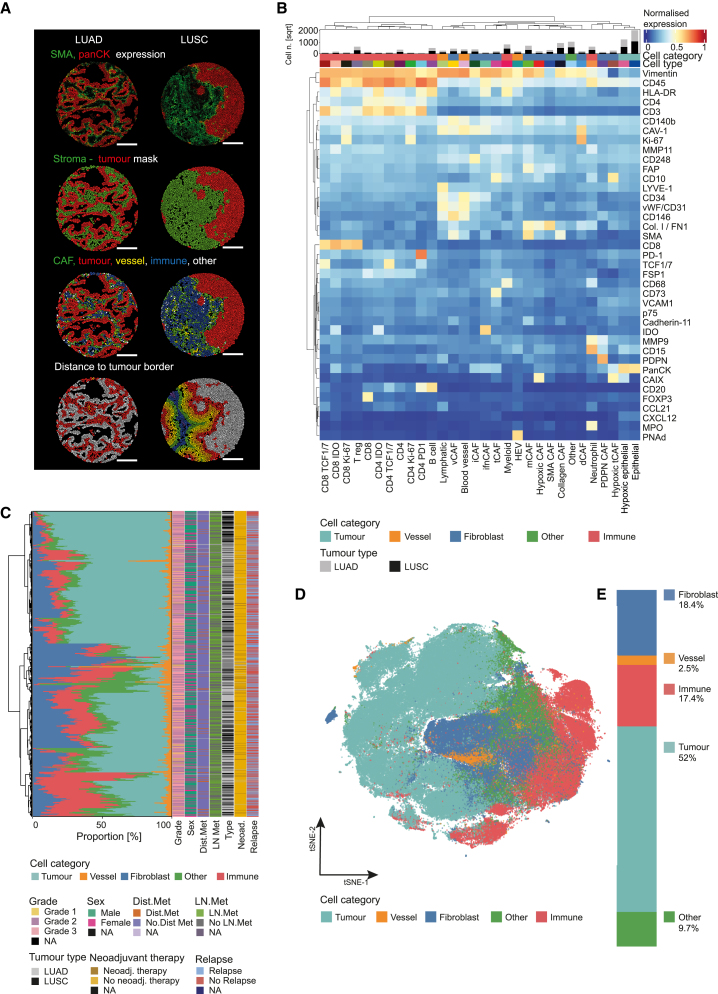
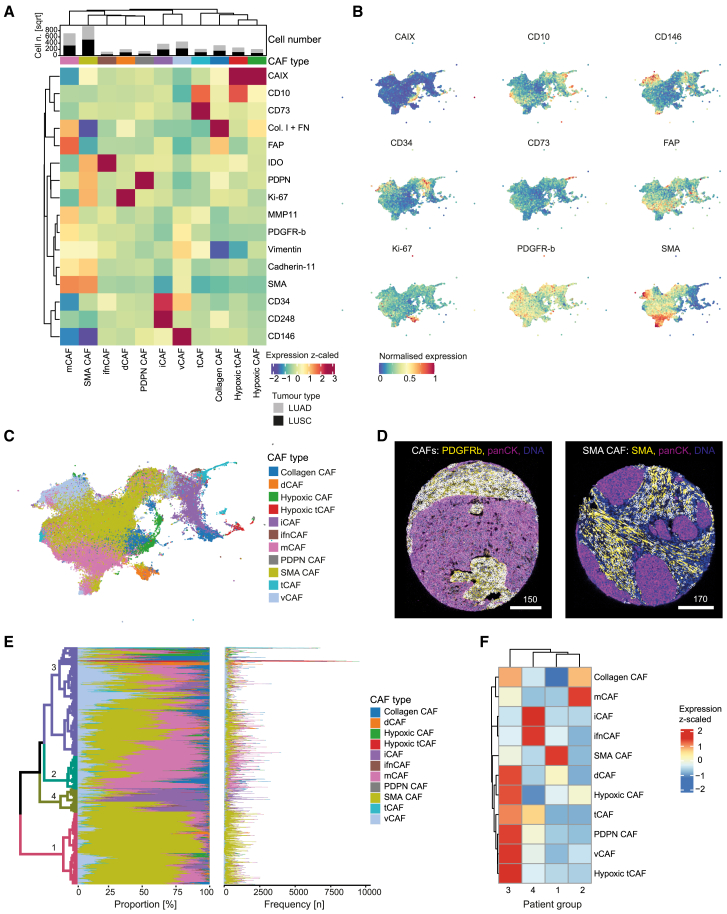
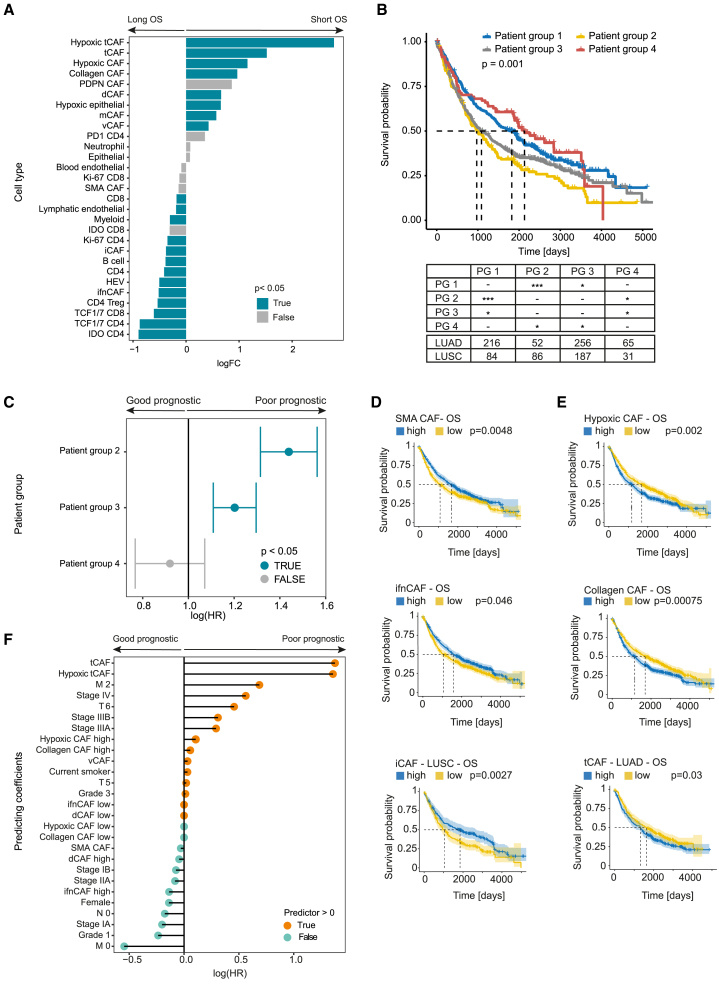
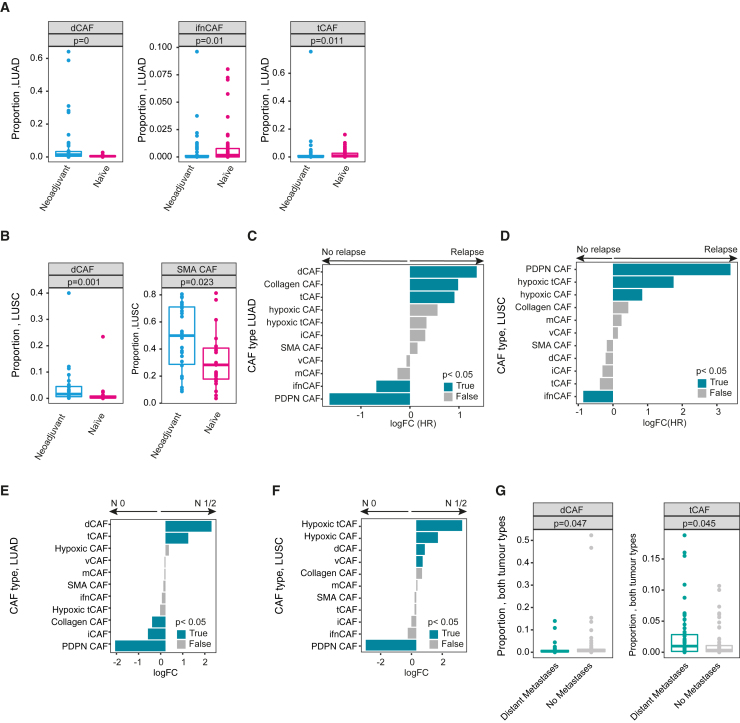
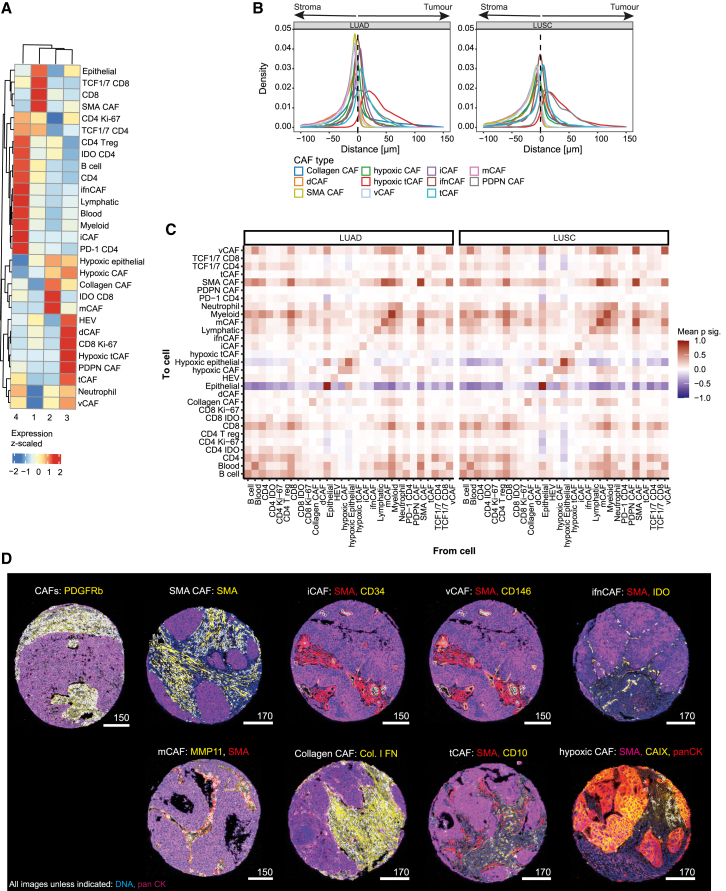
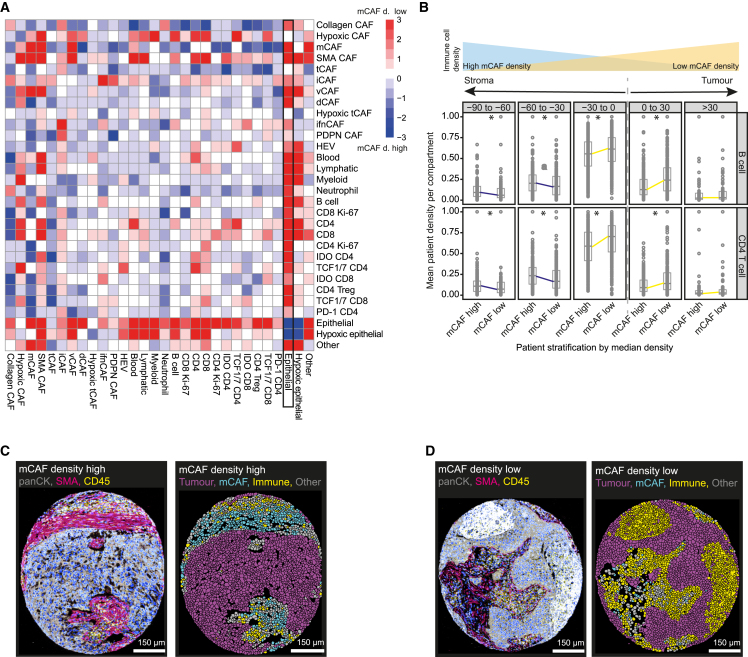
Despite advances in treatment, lung cancer survival rates remain low. A better understanding of the cellular heterogeneity and interplay of cancer-associated fibroblasts (CAFs) within the tumor microenvironment will support the development of personalized therapies. We report a spatially resolved single-cell imaging mass cytometry (IMC) analysis of CAFs in a non-small cell lung cancer cohort of 1,070 patients. We identify four prognostic patient groups based on 11 CAF phenotypes with distinct spatial distributions and show that CAFs are independent prognostic factors for patient survival. The presence of tumor-like CAFs is strongly correlated with poor prognosis. In contrast, inflammatory CAFs and interferon-response CAFs are associated with inflamed tumor microenvironments and higher patient survival. High density of matrix CAFs is correlated with low immune infiltration and is negatively correlated with patient survival. In summary, our data identify phenotypic and spatial features of CAFs that are associated with patient outcome in NSCLC.

Keywords: Cancer-associated fibroblasts; Imaging mass cytometry; Non-small cell lung cancer; Single cell; Spatial analysis.


Conflict of interest statement

Declaration of interests B.B. has co-founded Navignostics, a spin-off company of the University of Zurich, and is one of its shareholders and a board member.

Figures

None
Graphical abstract
Figure 1
Figure 1
Overview of experimental and analytical set-up (A) Experimental set-up. NSCLC samples (2070 cores, 1,070 patients) and controls were stained with metal-tagged antibodies and imaged using IMC. Cell and tumor-stroma masks were generated. (B) Analytical setup. Single-cell data were used to identify cell phenotypes, and to evaluate correlations between cell types and clinical data. CAF based patient stratifications were used for survival and TMA composition analyses. Finally, spatial properties of CAFs and immune cell types were analyzed and integrated with clinical data. (C) Markers in the antibody panel.
Figure 2
Figure 2
Cell phenotypes and distribution in NSCLC (A) Exemplary LUAD (left) and LUSC cores (right) after cell segmentation based on panCK as a tumor marker and SMA as a stromal marker. Top to bottom, cells colored by average expression of SMA and panCK; cell assignment based on the generated tumor-stroma masks; cell category assignment; and the binned distance of all non-tumor cells to the nearest tumor-stroma border (30 μm bins [red, orange, yellow, green, blue, purple] from tumor-stroma interface; gray: tumor). (B) Heatmap of marker expression (normalized from 0 to 1) for all cell phenotypes (labeled cell types). The bar chart above the heatmap shows the number of cells (square root for visualization) of each cell phenotype per tumor type. (C) Mean proportions of the indicated cell categories per patient, annotated for clinical features. Dist. Met.: distant metastasis; LN met.: lymph node metastasis; Neoad.: neoadjuvant therapy. (D) tSNE of a subset of 1,000 cells per image colored by cell category. (E) Proportions of cell categories for all cells measured. For D, E, colors as in B.
Figure 3
Figure 3
CAF phenotypes in NSCLC (A) Heatmap of mean marker expression (z-scaled from −2 to 3) for all CAF phenotypes identified after FLOWSOM clustering. The bar chart above the heatmap shows the number (square root for visualization) of CAFs per tumor type for each cluster. (B) UMAP of a random subset (n = 200,000 cells) of CAFs showing the mean intensity per cell (scaled from 0 to 1) for the indicated markers. (C) UMAP of a random subset (n = 200,000 cells) of CAFs colored by subtype. (D) Images showing all CAFs (left) and SMA CAFs (right); CAFs are shown with white masks overlaid on the indicated markers. (E) Mean proportions (left plot) and absolute numbers (right plot) of each CAF type per patient are shown. Color bar (right) indicates CAF types. The hierarchical clustering tree is colored (different color scale from CAF types) by four meta-clustered patient groups (1, 2, 3, 4). (F) Heatmap (z-scaled expression) showing enrichment of each CAF type per patient group as defined in E.
Figure 4
Figure 4
Association of CAF types with clinical parameters (A) Differential abundance testing of all cell types between patient groups defined by long (left) and short (right) overall survival, split by median. p Values < 0.05 are shown in blue, p values > 0.05 in grey. (B) Kaplan-Meier overall survival curves for patient groups (PG) defined by CAF composition (PG 1–4). The table shows patient numbers according to tumor type and p values for comparison between groups (p < 0.05, ∗∗∗p < 0.001). (C) CoxPH-model for patient groups, corrected for tumor type and grade. Patient group 1 serves as a reference. p Values < 0.05 are shown in blue, p values > 0.05 in grey. (D and E) Kaplan-Meier (plots for overall survival comparing patients stratified as high and low based on the median proportion of indicated CAF types. Good prognosis CAFs are in D, poor prognosis CAFs in E. All comparisons with significant differences (log rank testing p < 0.05) are shown. (F) Lasso-regressed CoxPH model including mean CAF type proportions per patient, patient stratification into high and low for each CAF type (by median proportion), and all clinical data.
Figure 5
Figure 5
CAF types are associated with chemoresistance and metastasis (A and B) Boxplots showing the average patient proportions for the indicated CAF types comparing patients that received neoadjuvant therapy versus a matched treatment-naïve cohort for LUAD (A) and LUSC (B). Exact p values are indicated. (C and D) Differential abundance testing of all CAF types comparing patients receiving adjuvant chemotherapy who did or did not relapse, in LUAD (C) and LUSC (D). p Values < 0.05 are shown in blue, p values > 0.05 in grey. (E and F) Differential abundance testing of all CAF types comparing patients with (N1/2) and without (N0) lymph node at diagnosis, in LUAD (E) and in LUSC (F). p Values < 0.05 are shown in blue, p values > 0.05 in grey. (G) Boxplot showing the average proportions per patient of the indicated CAF types in matched patient groups with and without distant metastases at diagnosis. Exact p values are indicated.
Figure 6
Figure 6
The spatial relationship of CAFs with the tumor microenvironment (A) Heatmap showing enrichment or depletion of cell types between patient groups defined by CAF composition (1, 2, 3, and 4). (B) Density curves showing the distance per cell of the indicated CAF types to the closest tumor-stroma border for LUAD (left) and LUSC (right). (C) Neighborhood analysis heatmap showing nearest 15 neighbors of each cell within a radius of 20 μm (to cell, Y axis; from cell, X axis). Plotted are mean significances over all images, split by LUAD (left) and LUSC (right). Positive/negative (red/blue) mean scores indicate higher/lower cellular interactions compared to a random null-distribution. (D) Images with mask overlays (white) of SMA CAFs (SMA+), mCAFs (MMP11+), collagen CAFs (Collagen I/Fibronectin+), vCAFs (CD146+), iCAFs (CD34+), tCAFs (CD10+), hypoxic CAFs (CAIX+). The general stroma marker SMA is in red in all cases except for images showing SMA CAFs and hypoxic CAFs. Pan cytokeratin is in magenta in all cases except for the image showing hypoxic CAFs (lower right), all CAFs are panCK; DNA is in blue. Scalebars are in μm.
Figure 7
Figure 7
High mCAF density blocks out immune cells (A) SpicyR analysis of cell pairs in patients stratified by median mCAF density. Positive scores (red) indicate higher cellular interactions between cell pairs in patients with low mCAF density, negative scores (blue) indicate higher cellular interactions in patient with high mCAF density; white indicates no difference. (B) Proportions of B cells (upper) and CD4+ T cells (lower) in patients stratified by mCAF density, within bins of 30 μm from the tumor-stroma border (∗p values < 0.05). (C and D) Images showing the indicated markers for a mCAF density high image (C) and a mCAF density low image (D), together with the corresponding masks colored by tumor cells (magenta), immune cells (yellow) and mCAFs (cyan). Scale bar, 150 μm.

References

    1. Sung H., Ferlay J., Siegel R.L., Laversanne M., Soerjomataram I., Jemal A., Bray F. Global cancer statistics 2020: GLOBOCAN estimates of incidence and mortality worldwide for 36 cancers in 185 countries. CA. Cancer J. Clin. 2021;71:209–249. - PubMed
    1. Schabath M.B., Cote M.L. Cancer progress and priorities: Lung cancer. Cancer Epidemiol. Biomarkers Prev. 2019;28:1563–1579. - PMC - PubMed
    1. Pikor L.A., Ramnarine V.R., Lam S., Lam W.L. Genetic alterations defining NSCLC subtypes and their therapeutic implications. Lung Cancer. 2013;82:179–189. - PubMed
    1. Garon E.B., Hellmann M.D., Rizvi N.A., Carcereny E., Leighl N.B., Ahn M.J., Eder J.P., Balmanoukian A.S., Aggarwal C., Horn L., et al. Five-year overall survival for patients with advanced non‒small-cell lung cancer treated with pembrolizumab: results from the phase I KEYNOTE-001 study. J. Clin. Oncol. 2019;37:2518–2527. - PMC - PubMed
    1. Robert C. A decade of immune-checkpoint inhibitors in cancer therapy. Nat. Commun. 2020;11:3801. - PMC - PubMed