. 2024 May 3;147(5):1899-1913.
doi: 10.1093/brain/awae018.

Elevated cholesterol in ATAD3 mutants is a compensatory mechanism that leads to membrane cholesterol aggregation

Affiliations

Elevated cholesterol in ATAD3 mutants is a compensatory mechanism that leads to membrane cholesterol aggregation

Mikel Muñoz-Oreja et al. Brain. .

Abstract

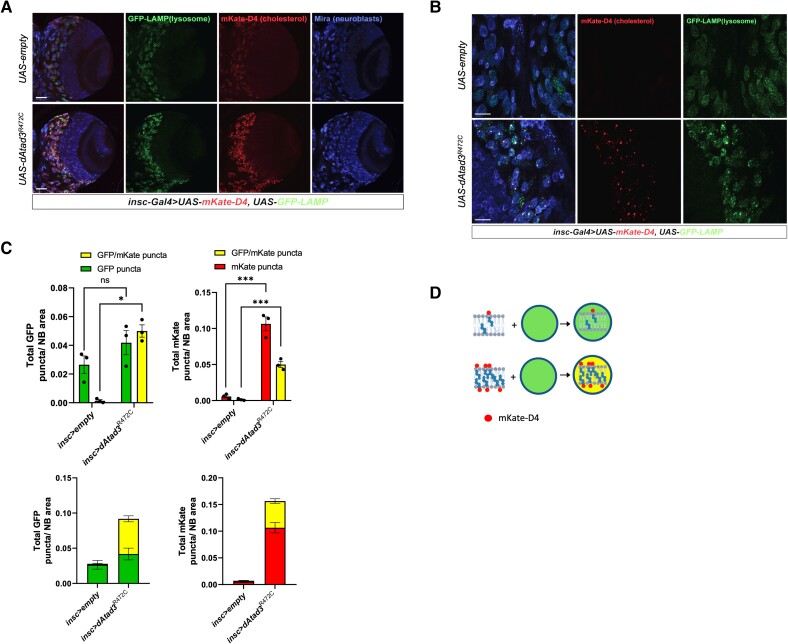
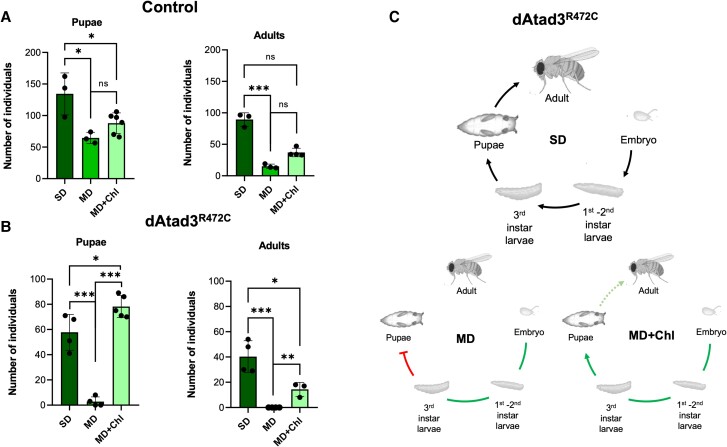
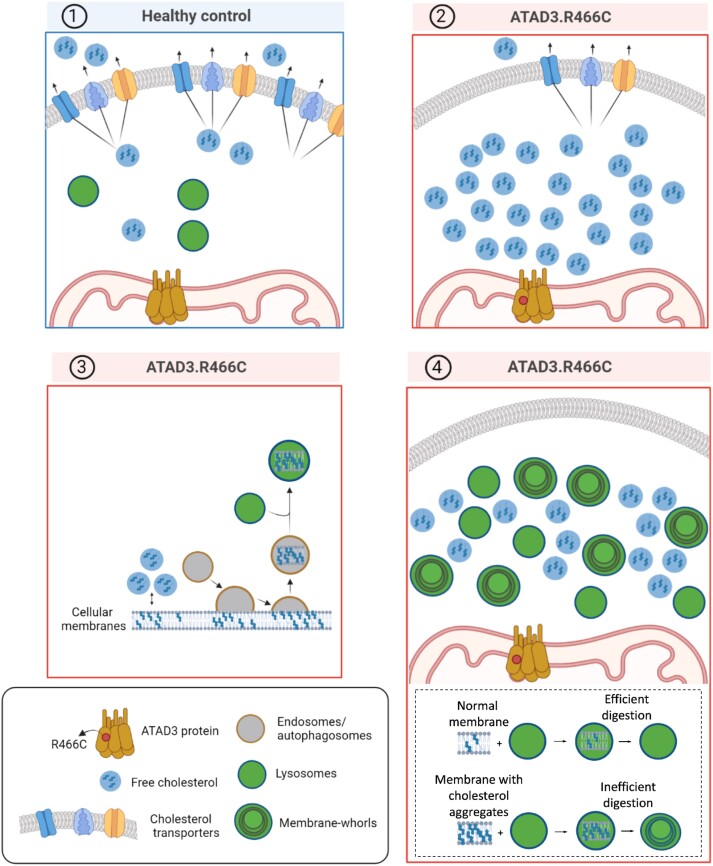
Aberrant cholesterol metabolism causes neurological disease and neurodegeneration, and mitochondria have been linked to perturbed cholesterol homeostasis via the study of pathological mutations in the ATAD3 gene cluster. However, whether the cholesterol changes were compensatory or contributory to the disorder was unclear, and the effects on cell membranes and the wider cell were also unknown. Using patient-derived cells, we show that cholesterol perturbation is a conserved feature of pathological ATAD3 variants that is accompanied by an expanded lysosome population containing membrane whorls characteristic of lysosomal storage diseases. Lysosomes are also more numerous in Drosophila neural progenitor cells expressing mutant Atad3, which exhibit abundant membrane-bound cholesterol aggregates, many of which co-localize with lysosomes. By subjecting the Drosophila Atad3 mutant to nutrient restriction and cholesterol supplementation, we show that the mutant displays heightened cholesterol dependence. Collectively, these findings suggest that elevated cholesterol enhances tolerance to pathological ATAD3 variants; however, this comes at the cost of inducing cholesterol aggregation in membranes, which lysosomal clearance only partly mitigates.

Keywords: AAA+ ATPase; ATAD3; cholesterol disorders; lysosomal storage disorders; lysosomes; mitochondrial disease.


Conflict of interest statement

The authors report no competing interests.

Figures

Figure 1
Figure 1
Identification of a family with DOA+ associated with a dominant point mutation in ATAD3A. (A) Pedigree of the family in which affected members carry ATAD3A c.1396C>T, p.R466C (NM_001170535.2) on one allele. (B) Amino acid sequence alignment between parts of ATAD3A isoforms 1 and 2 affected by the ATAD3A/C gene fusion and the arginine finger point mutation. The A/C fusion protein differs at 29 amino acid positions (highlighted in yellow). The individuals with the R466C point mutation have an ATAD3 sequence identical in length to ATAD3A isoform 2 and it only differs in the ATP-binding residue in position 466, which it shares with the fusion protein A-C (in red font). Underlined are the residues of the conserved protein kinase domain that form the ATPase region [p.Ile348–p.Asp474; PFam PF00004]. Marked in a green box is the Walker B ATP binding motif. Residue numbering from [Q9NVI7-2/NM_001170535.2]. (C) SDS-PAGE (8% gel) of whole cell protein from controls (Ctrl), ATAD3 R466C and ATAD3A/C mutant cell lines, immunolabelled with an ATAD3 N-terminal antibody. DOA+ = dominant optic atrophy ‘plus’.
Figure 2
Figure 2
ATAD3 mutant fibroblasts display increased unesterified cholesterol, decreased cholesterol export capacity and elevated neutral lipids. (A) Representative images of Filipin III stained ATAD3 mutants and control (Ctrl) fibroblasts, treated with and without the cholesterol trafficking inhibitor U18666A (U18). Quantification of Filipin signal (measured as raw integrated density per total area of the cell), where each point represents a cell and each colour a different cell line/condition [>100 cells per line, independent experiments (represented by black squares) are n = 5, except Ctrls+U18 where n = 3]. Scale bar = 30 µm. Differences between groups were analysed by unpaired, two-tailed Mann-Whitney U-test (Ctrls versus ATAD3 A/C, ***P < 10−7; Ctrls versus ATAD3.R466C, ***P < 10−7; Ctrls versus Ctrls+U18, ***P = 10−10). (B) Abundance of cholesterol efflux proteins (ABCA1, ABCG1 and SR-BI) in ATAD3.R466C and ATAD3 A/C mutants versus controls estimated via immunoblotting of proteins separated by SDS-PAGE. Quantification of the three factors (circles = ABCA1; squares = ABCG1; triangles = SR-BI) relative to controls. Each dot represents an independent experiment and different colours denote each of the cell lines (n = 3–5 independent experiments). Differences between groups were analysed by unpaired, two-tailed Student’s t-test (Ctrls versus ATAD3 A/C, ***P = 2.34 × 10⁻⁷; Ctrls versus ATAD3 R466C, ***P = 6.15 × 10⁻⁷). (C) Interpretation of A and B to illustrate the increase in free cholesterol and decrease in the abundance of cholesterol efflux plasma membrane proteins. (D) Representative images of control and ATAD3 mutant fibroblasts grown in standard medium (without oleate) and incubated with BODIPYTM 493/503 to stain accumulated neutral lipids (green) and SYTOXTM Deep Red to mark the nuclei (converted to blue). Chart of BodipyTM 493/503 signal (measured as raw integrated density per total area of the cell) from controls and ATAD3 mutant fibroblasts (>100 cells per line, n = 3 independent experiments). As in A, each point represents a cell and each colour a different cell line/condition. Differences between groups were analysed by unpaired, two-tailed Student’s t-test (Ctrls versus ATAD3 A/C, ***P < 10−7; Ctrls versus ATAD3 R466C, ***P < 10−7).
Figure 3
Figure 3
ATAD3 dysfunction increases lysosome numbers maintaining autophagic flux. (A) ATAD3 A/C, deletion (Δ) and R466C cells were treated with and without chloroquine (CLQ), to block autophagy, in parallel with control cells (Ctrl). Lipidated LC3 (LC3II) was detected by immunoblotting after fractionating whole cell lysates via SDS-PAGE. (B) Top: ATAD3A mutant and control fibroblasts stained with an antibody against lysosome-associated membrane protein 1 (LAMP1, green) with DAPI (blue) stained nuclei. Bottom: Chart of LAMP1 signal (measured as raw integrated density per cell) from controls and ATAD3 mutant fibroblasts (>100 cells per line, n = 3 independent experiments). Scale bar = 30 µm. Differences between groups were analysed by unpaired, two-tailed Student’s t-test (Controls versus ATAD3 A/C, ***P < 10−7) and unpaired, two-tailed Mann-Whitney U-test (Controls versus ATAD3 R466C, ***P < 10−7). Cartoon illustrates the increase in the lysosomal pool. (C) ATAD3 mutant and control fibroblasts stained with an indicator of acidified lysosomes, Lysotracker Red. (D) Left: Transmission electron micrographs of ATAD3 mutant and control fibroblasts showing cytoplasmic content at different magnifications. Note the many structures with membrane whorls that are characteristic of lysosomal storage diseases, some of which are arrowed. Right: The chart indicates as dots the number of lysosomes with membrane -whorls in an area of 13.554 µm2 in micrographs of ×2500 magnification. Differences between groups were analysed by unpaired, two-tailed Student’s t-test (Controls versus ATAD3 A/C, ***P = 5 × 10⁻⁹) and unpaired, two-tailed Mann-Whitney U-test (Controls versus ATAD3 R466C, ***P = 7.4 × 10⁻⁷). The accompanying cartoon illustrates the accumulation of lysosomes with membrane-whorls in the ATAD3 mutant cells.
Figure 4
Figure 4
Drosophila, dAtad3R472C is highly deleterious and increases membrane-bound cholesterol. dAtad3R472C was expressed in Drosophila using the UAS-Gal4 system. (A) UAS-dAtad3R472C expressed under different Gal4 drivers led to lethality, except with GMR-Gal4 (late onset eye and neuronal driver), insc-Gal4 (neuroblast driver) and ey-Gal4 (eye discs) drivers, similar to that produced when expressing dAtad3 RNAi (UAS-dAtad3RNAi). (B) Light microscope images of the abnormal eye phenotypes of flies expressing dAtad3R472C under the ey-Gal4 driver seen in ∼33% of the viable progeny, compared to the normal eyes of flies expressing no transgene (UAS-empty), or wild-type transgenic Atad3 (UAS-dAtad3WT). (C) Confocal micrographs of Drosophila larvae brain lobes carrying insc-Gal4 and UAS-mKate-D4 together with UAS-empty [control (i) or UAS-dAtad3R472C (ii)]. Neuroblasts are labelled Miranda (blue) and ganglion mother cells (GMCs) by Prospero (green). mKate-D4 (red) is a membrane-bound cholesterol reporter. Scale bar = 50 µm. The cartoon represents the cholesterol distribution in membranes and its predicted accumulation and aggregation based on C(ii).
Figure 5
Figure 5
ATAD3A mutant neuroblasts show increased membrane-associated cholesterol together with increased lysosome content. (A and B) Confocal micrographs of Drosophila larval brain lobes carrying insc-Gal4 (neuroblast driver), UAS-GFP-LAMP and UAS-mKate-D4 together with UAS-empty (control), or UAS-dAtad3R472C at magnifications of ×20 (scale bar = 50 µm) and ×63 (scale bar = 20 µm), respectively. Neuroblasts are labelled Miranda (blue), GFP-LAMP (green) marks lysosomes, while mKate-D4 (red) marks cholesterol-containing membranes. (C) Top left: Quantification of GFP-LAMP puncta without (green) and with mKate-D4 (yellow) per neuroblast (NB) area, for UAS-empty (control) and dAtad3R472C expressed under neuroblast driver insc-Gal4. Differences between groups were analysed by unpaired, two-tailed Student’s t-test. Green fluorescent protein (GFP) dAtad3 versus GFP empty non-significant, P = 0.2149; GFP/mKate empty versus GFP/mKate dAtad3, *P = 0.0353. Below the total number of lysosomes in a single column (green + yellow) for UAS-empty (control) and dAtad3R472C. Top right: Quantification of mKate-D4 puncta without (red) and with GFP-LAMP (yellow) per neuroblast (NB) area, for UAS-empty (control) and dAtad3R472C expressed under neuroblast driver insc-Gal4. Differences between groups were analysed by unpaired, two-tailed Student’s t-test: mKate empty versus mKate dAtad3, ***P = 0.0005; GFP/mKate empty versus GFP/mKate dAtad3, ***P = 0.0004. (D) Schematic representation of the data: cholesterol in membranes is labelled red by mKate-D4, while GFP-LAMP stains lysosomes green; hence, mKate-D4 foci and lysosomes that co-localize appear yellow.
Figure 6
Figure 6
Cholesterol supplementation disproportionally benefits Atad3 mutant flies. Flies were maintained on a standard diet (SD) or a modified diet (MD) with or without cholesterol (Chl). (A) Each point indicates the number of control pupae and adults from crosses of flies that carry the UAS construct without a transgene (UAS-empty) and the ey-Gal4 driver. Pupae: differences between groups were analysed by unpaired, two-tailed Student’s t-test (SD versus MD, *P = 0.025; SD versus MD+Chl, *P = 0.022; MD versus MD+Chl, non-significant P = 0.058). Adults: Differences between groups were analysed by unpaired, two-tailed Student’s t-test (SD versus MD, ***P = 0.0003) and unpaired, two-tailed Mann-Whitney U-test (SD versus MD+Chl, non-significant P = 0.057; MD versus MD+Chl, non-significant P = 0.0571). (B) Number of pupae and adults from crosses of flies that carry the UAS-dAtad3R472C transgene (dAtad3R472C) and the ey-Gal4 driver. Pupae: Differences between groups were analysed by unpaired, two-tailed Student’s t-test (SD versus MD, ***P = 0.0003; SD versus MD+Chl, *P = 0.032; MD versus MD+Chl, ***P = 9.38 × 10⁻⁷). Adults: differences between groups were analysed by unpaired, two-tailed Student’s t-test (SD versus MD, ***P = 0.0007; SD versus MD+Chl, *P = 0.022; MD versus MD+Chl, **P = 0.003). n = 3 or 4 independent experiments. Data are presented as the mean ± standard deviation. (C) Top: The complete life cycle of the fly. Bottom: The major developmental stages that are impeded by Atad3R472C raised on the modified diet (MD) and that are mitigated by cholesterol supplementation.
Figure 7
Figure 7
Consequence of elevated cholesterol in ATAD3 disease. (1) Healthy control cell with normal cholesterol and lysosome levels (blue panel). In contrast, ATAD3 mutant cells (red panels) require more cholesterol than normal and the free cholesterol pool can be increased by reducing the number of cholesterol transporters (2), or remodelling cholesterol biosynthesis. The abundant free cholesterol leads to cholesterol aggregation in membranes and activation of the endolysosomal pathway to remove the aberrant membranes (3); however, cholesterol-engorged membranes are difficult to digest leading to many lysosomes with membrane whorls that are characteristic of lysosomal storage diseases (4).

References

    1. Pfrieger FW. The Niemann-Pick type diseases—A synopsis of inborn errors in sphingolipid and cholesterol metabolism. Prog Lipid Res. 2023;90:101225. - PubMed
    1. Jeong W, Lee H, Cho S, Seo J. ApoE4-Induced cholesterol dysregulation and its brain cell type-specific implications in the pathogenesis of Alzheimer’s disease. Mol Cells. 2019;42:739–746. - PMC - PubMed
    1. Luo J, Yang H, Song BL. Mechanisms and regulation of cholesterol homeostasis. Nat Rev Mol Cell Biol. 2020;21:225–245. - PubMed
    1. Shamitko-Klingensmith N, Molchanoff KM, Burke KA, Magnone GJ, Legleiter J. Mapping the mechanical properties of cholesterol-containing supported lipid bilayers with nanoscale spatial resolution. Langmuir. 2012;28:13411–13422. - PubMed
    1. Borochov H, Abbott RE, Schachter D, Shinitzky M. Modulation of erythrocyte membrane proteins by membrane cholesterol and lipid fluidity. Biochemistry. 1979;18:251–255. - PubMed

Publication types

MeSH terms