. 2024 Jan 19;15(1):606.
doi: 10.1038/s41467-023-43003-w.

DNMT3A clonal hematopoiesis-driver mutations induce cardiac fibrosis by paracrine activation of fibroblasts

Affiliations

DNMT3A clonal hematopoiesis-driver mutations induce cardiac fibrosis by paracrine activation of fibroblasts

Mariana Shumliakivska et al. Nat Commun. .

Abstract

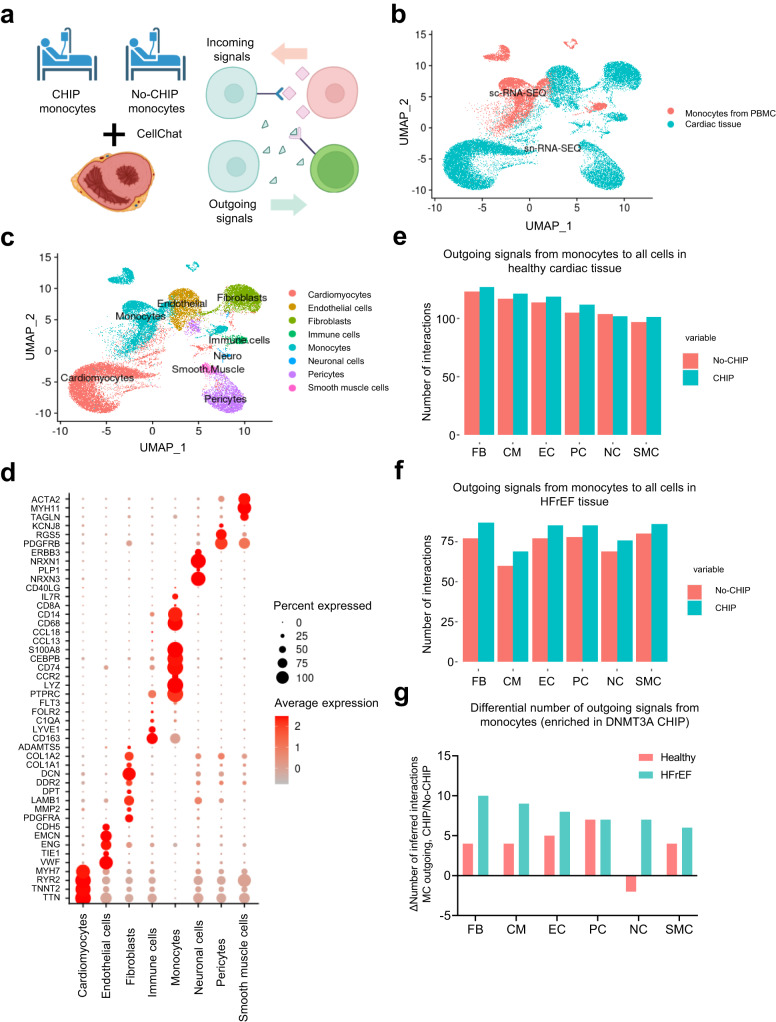
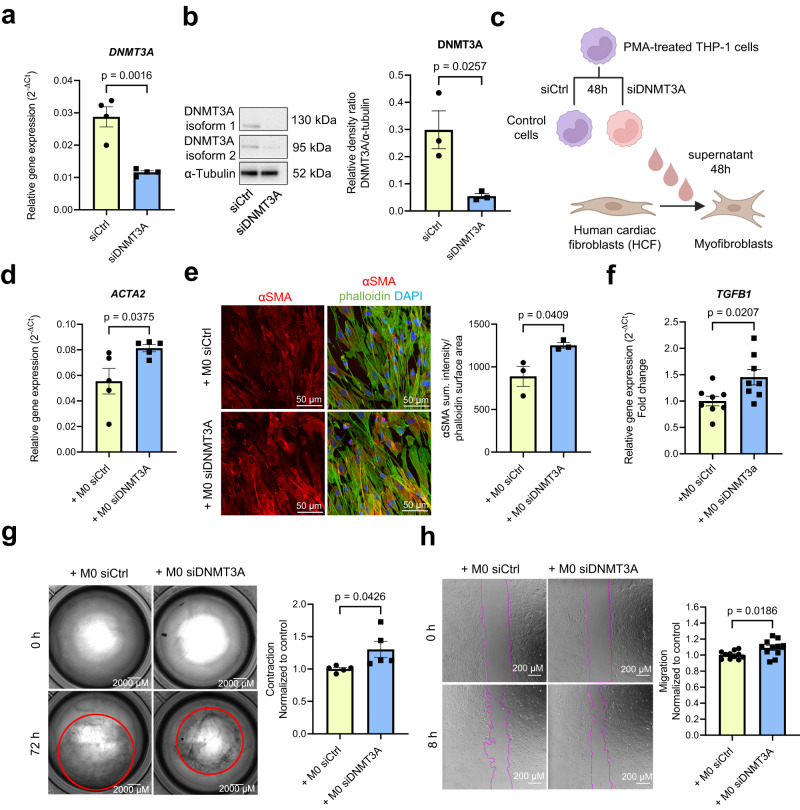
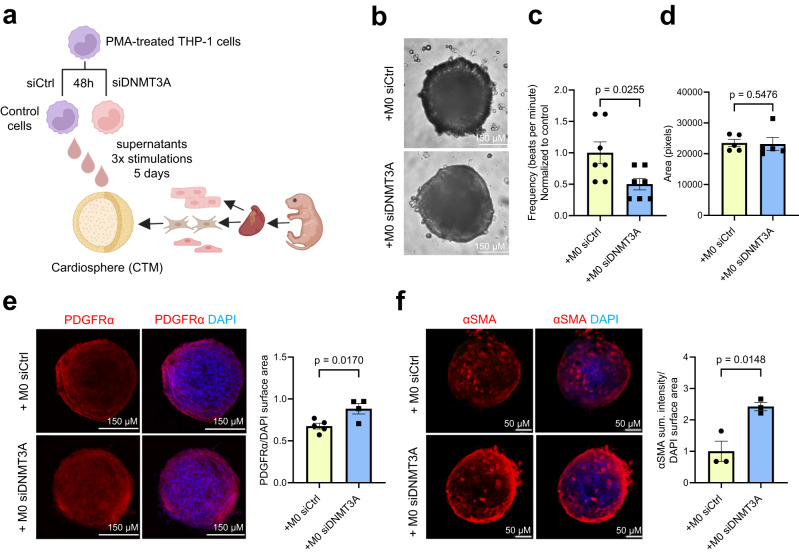
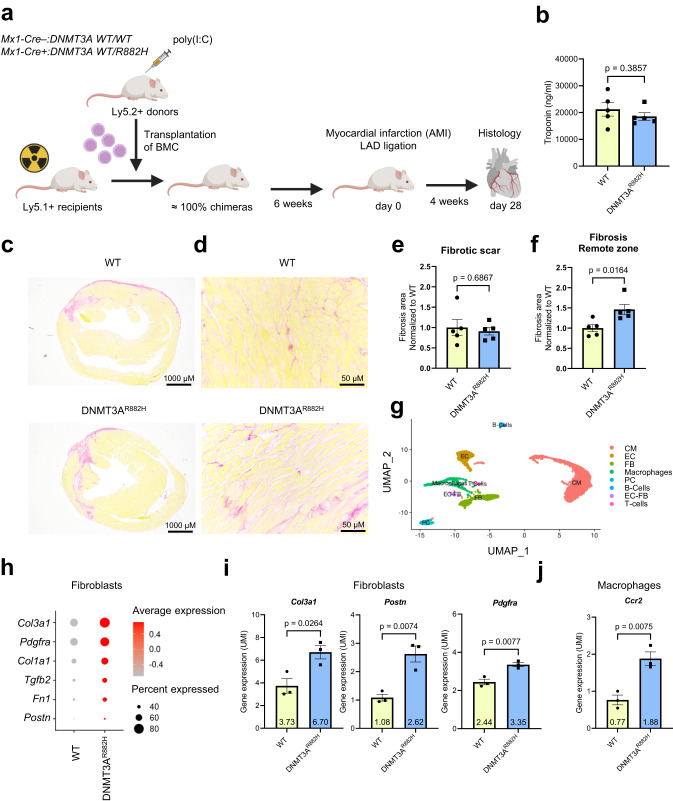
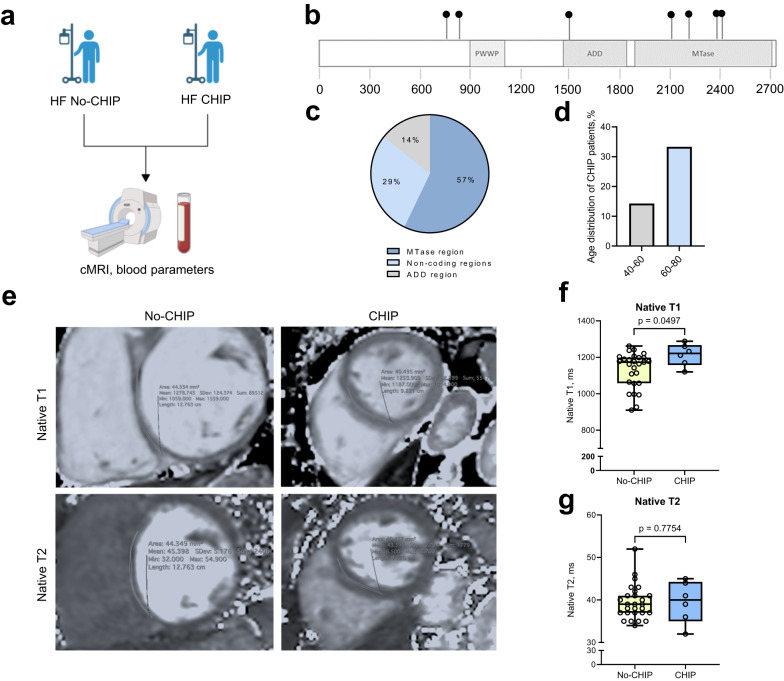
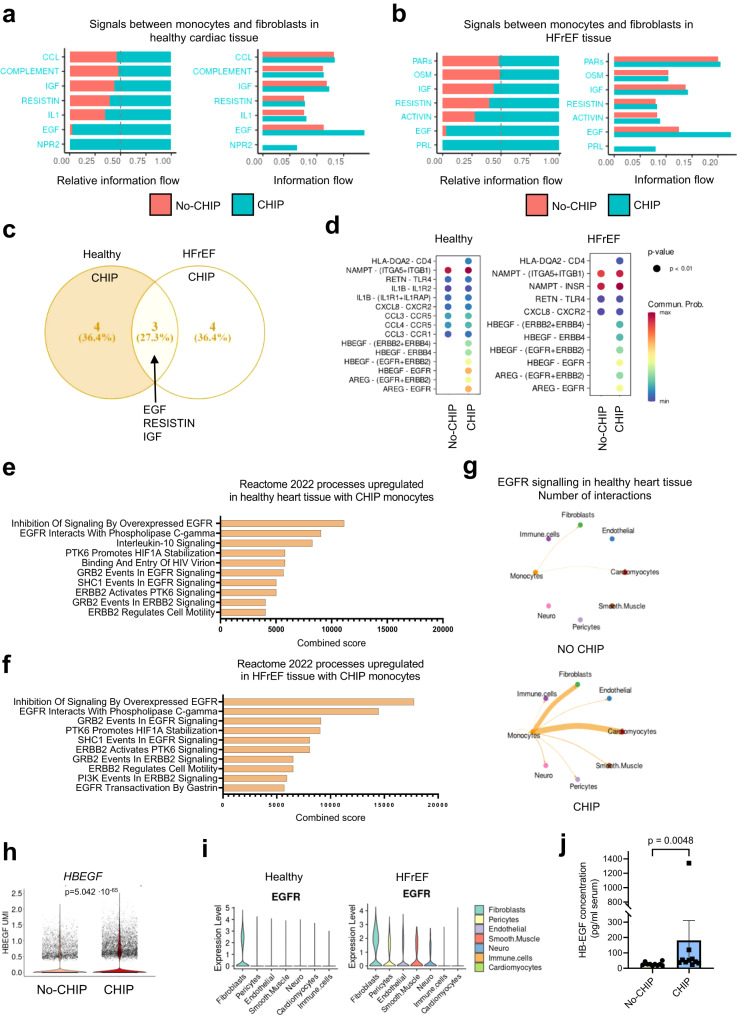
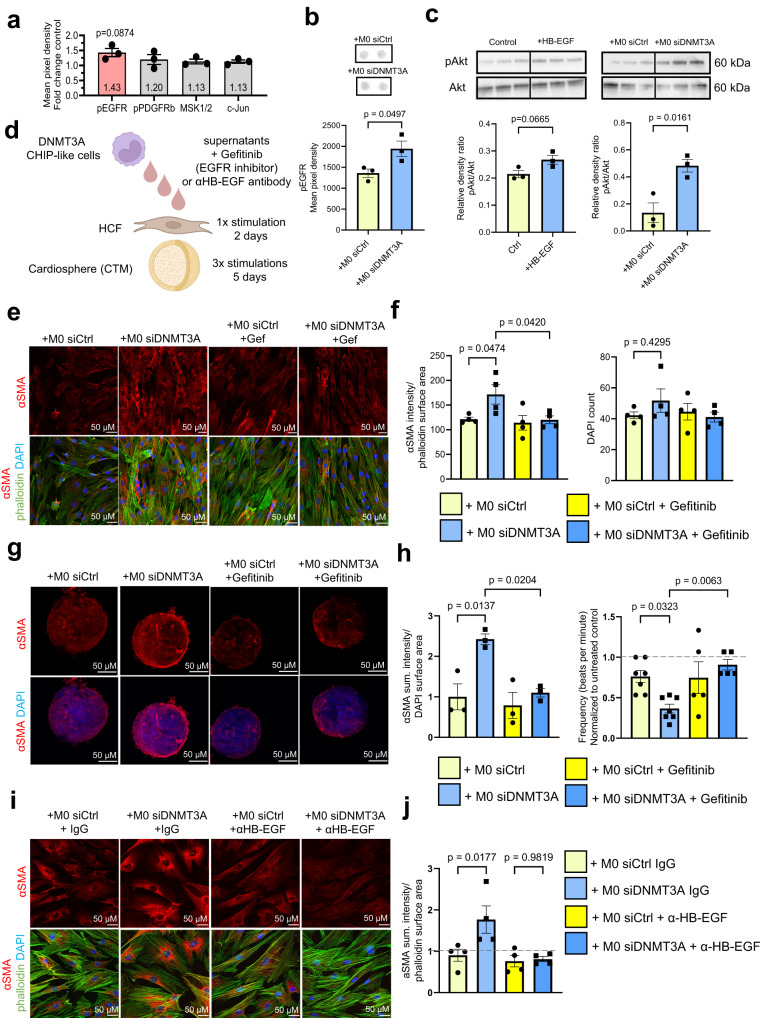
Hematopoietic mutations in epigenetic regulators like DNA methyltransferase 3 alpha (DNMT3A), play a pivotal role in driving clonal hematopoiesis of indeterminate potential (CHIP), and are associated with unfavorable outcomes in patients suffering from heart failure (HF). However, the precise interactions between CHIP-mutated cells and other cardiac cell types remain unknown. Here, we identify fibroblasts as potential partners in interactions with CHIP-mutated monocytes. We used combined transcriptomic data derived from peripheral blood mononuclear cells of HF patients, both with and without CHIP, and cardiac tissue. We demonstrate that inactivation of DNMT3A in macrophages intensifies interactions with cardiac fibroblasts and increases cardiac fibrosis. DNMT3A inactivation amplifies the release of heparin-binding epidermal growth factor-like growth factor, thereby facilitating activation of cardiac fibroblasts. These findings identify a potential pathway of DNMT3A CHIP-driver mutations to the initiation and progression of HF and may also provide a compelling basis for the development of innovative anti-fibrotic strategies.


Conflict of interest statement

A. Den. is a co-founder and shareholder of InVitroSys GmbH. A.M.Z. is unpaid consultant for TenSixteen Bio. All other authors have no patents or other financial conflicts, but they are supported by grants from the DFG, ERC and DZHK.

Figures

Fig. 1
Fig. 1. DNMT3A CHIP monocytes interact with cardiac fibroblasts in healthy and diseased heart.
a Schematic representation of the experimental design. Bioinformatic analysis combining monocytes derived from scRNA-seq dataset of PBMC from DNMT3A CHIP and No-CHIP patients, snRNA-seq dataset of cardiac tissue from the septum of control hearts (n = 14 biologically independent samples) and snRNA-seq dataset of cardiac tissue from patients with heart failure with reduced ejection fraction (HFrEF) (n = 3 biologically independent samples) b Uniform manifold approximation and projection (UMAP) plots after integration of monocytes from PBMC and cardiac data sets. The source of data in the integrated object is color coded. c Representation of the different cell type clusters identified after integration d Dot plot of representative marker gene expression in each cell type cluster e Analysis of the integrated objects for cellular interactions by CellChat. Total number of outgoing paracrine signals from monocytes to all cells of the healthy heart is shown. f Analysis of the integrated objects for cellular interactions by CellChat. Total number of outgoing paracrine signals from monocytes to all cells of the HFrEF tissue. g Differential number of outgoing signals enriched in DNMT3A CHIP-carrier monocytes to the individual clusters of cardiac cells of healthy and HFrEF tissues as indicated. FB Fibroblasts. CM Cardiomyocytes. EC Endothelial cells. PC Pericytes. NC Neurons. SMC Smooth muscle cells. Source data are provided as a Source Data file.
Fig. 2
Fig. 2. DNMT3A-silenced monocytes activate cardiac fibroblasts in a paracrine manner.
a DNMT3A mRNA expression in PMA-activated THP-1 cells after siRNA silencing of DNMT3A normalized to RPLP0 mRNA expression (n = 4 biologically independent samples). Source data are provided as a Source Data file. b DNMT3A protein expression (isoform 1 (DNMT3A1) and 2 (DNMT3A2)) in PMA-activated THP-1 cells after siRNA silencing of DNMT3A (n = 3 biologically independent samples). Representative Western blots are shown on the left. Source data are provided as a Source Data file. c Schematic representation of the indirect co-culture experiment. d Relative ACTA2 gene expression normalized to RPLP0 mRNA expression in human cardiac fibroblasts (HCF) after incubation with supernatants from PMA-activated THP-1 cells for 48 h after siRNA silencing of DNMT3A relative or negative control (n = 5 biologically independent samples). Source data are provided as a Source Data file. e Immunofluorescence analysis of αSMA protein expression in stimulated HCF (n = 3 biologically independent experiments). Representative examples are shown left. Source data are provided as a Source Data file. f Relative TGFB1 mRNA expression normalized to RPLP0 mRNA expression analyzed by qPCR in stimulated HCF (n = 8 biologically independent samples). Source data are provided as a Source Data file. g Collagen gel contraction analysis in stimulated HCF (n = 5 biologically independent experiments) after treatment with supernatants. Source data are provided as a Source Data file. h Migration assay of stimulated HCF (n = 11 biologically independent experiments) after treatment with supernatants. Source data are provided as a Source Data file. Data are shown as mean ± SEM (a, b, dh). Normal distribution was assessed using the Shapiro–Wilk test (a, b, dh). Statistical analysis was performed using unpaired, two-sided Student’s t tests (a,b, dh). t  =  5.471, 6 degrees of freedom (a); t  =  3.464, 4 degrees of freedom (b); t  =  2.490, 8 degrees of freedom (d); t  =  2.977, 4 degrees of freedom (e); t  =  2.607, 14 degrees of freedom (f); t  =  2.408, 8 degrees of freedom (g); t  =  2.562, 20 degrees of freedom (h).
Fig. 3
Fig. 3. DNMT3A-silenced monocytes reduce contractility and lead to fibrosis in cardiospheres.
a Schematic representation of the experimental design b Representative brightfield images of cardiospheres upon indirect co-culture (5 days, 3 stimulations) c Beating frequency of cardiospheres stimulated with THP-1 supernatants (n = 7 biologically independent samples). Source data are provided as a Source Data file. d Cardiospheres area upon stimulation with THP-1 supernatants (n = 5 biologically independent samples). Source data are provided as a Source Data file. e Immunofluorescence analysis of PDGFRα protein expression in stimulated cardiospheres (n = 4–5 biologically independent samples). Source data are provided as a Source Data file. f Immunofluorescence analysis of αSMA protein expression in stimulated cardiospheres (n = 3 biologically independent samples). Source data are provided as a Source Data file. Data are shown as mean ± SEM. cf Normal distribution was assessed using the Shapiro–Wilk test. cf Statistical analysis was performed using unpaired, two-sided Student’s t tests (c, ef). t  =  2.550, 12 degrees of freedom (c); t  =  3.464, 4 degrees of freedom (e); t  =  3.113, 7 degrees of freedom (e); t  =  2.977, 4 degrees of freedom (f); t  =  4.105, 4 degrees of freedom. Statistical analysis was performed using two-tailed Mann–Whitney test (d).
Fig. 4
Fig. 4. DNMT3A CHIP promotes diffuse cardiac fibrosis in mice with DNMT3AR882H bone marrow cells.
a Schematic illustration of the experimental design of the in vivo study. b ELISA-based quantification of cardiac troponin in serum of wild-type mice transplanted with wild-type bone marrow cells (WT) and wild-type mice transplanted with DNMT3AR882H bone marrow cells (DNMT3AR882H) (n = 5 biologically independent samples). Source data are provided as a Source Data file. c, d Picrosirius red staining of murine cardiac cross sections. c Infarct fibrotic scar in WT and DNMT3AR882H mice. d Remote zone in WT and DNMT3AR882H mice. e Quantification of the fibrotic score for the scar and (f) for the remote zone (n = 5 biologically independent samples). Source data are provided as a Source Data file. g Representative uniform manifold approximation and projection (UMAP) plots of scRNA-seq sequenced WT and DNMT3AR882H murine hearts after AMI (day 75) showing different cell clusters identified after annotation. CM Cardiomyocytes; EC Endothelial cells; FB Fibroblasts; PC Pericytes (n = 3 biologically independent samples). h Dot plot depicting expression of fibrosis-related genes in the cardiac fibroblast cluster in the sequenced WT and DNMT3AR882H murine hearts after AMI (n = 3 biologically independent samples). i Mean expression of Col3a1, Postn, Pdgfra in WT and DNMT3AR882H murine hearts after AMI (n = 3 biologically independent samples). Source data are provided as a Source Data file. j Mean expression of Ccr2 in WT and DNMT3AR882H murine hearts after AMI (n = 3 biologically independent samples). Source data are provided as a Source Data file. Data are shown as mean ± SEM. b, e, f, i, j Normal distribution was assessed using the Shapiro–Wilk test. b, e, f, i, j. Statistical analysis was performed using unpaired, two-sided Student’s t tests. (b, e, f, i, j. t  =  0.917, 8 degrees of freedom (b); t  =  0.418, 8 degrees of freedom (e); t  =  3.027, 8 degrees of freedom (f); t  =  3.434, 4 degrees of freedom; t  =  5.024, 4 degrees of freedom; t = 4.966, 4 degrees of freedom (i); t = 5.003, 4 degrees of freedom (j).
Fig. 5
Fig. 5. DNMT3A CHIP promotes diffuse cardiac fibrosis in DNMT3A CHIP patients.
a Schematic illustration of the design of the patient study. b Distribution of 7 detected mutations of 6 CHIP patients on the DNMT3A gene; PWWP - Pro-Trp-Trp-Pro motif domains, ADD - ATRX-DNMT3-DNMT3L domain and MTase—methyltransferase domain. c Distribution of the CHIP mutations according to the DNMT3A domains. Source data are provided as a Source Data file. d Age distribution of DNMT3A CHIP patients. Source data are provided as a Source Data file. e Representative cMRI sequences of native T1 and T2 relaxation times (ms) in HF patients with DNMT3A CHIP and No-CHIP. f Quantification of native T1 and (g) T2 relaxation times (ms) in HF patients with DNMT3A CHIP and No-CHIP (n = 27 for No-CHIP and n = 6 for CHIP). Source data are provided as a Source Data file. Data are shown as a box plot with median in the center and 25th and 75th percentiles as bounds of boxes, with whiskers indicating maximal and minimal values. f, g Normal distribution was assessed using the Shapiro–Wilk test. f, g Statistical analysis was performed using two-tailed Mann–Whitney test (f, g).
Fig. 6
Fig. 6. EGF signaling contributes to CHIP monocyte-mediated cardiac fibroblast activation.
a CellChat ligand receptor prediction showing signaling pathways mediating relative information flow (left) and total information flow (right) of DNMT3A CHIP patient-derived monocytes with fibroblasts of healthy cardiac tissue. b CellChat ligand receptor prediction showing signaling pathways mediating relative information flow (left) and total information flow (right) of DNMT3A CHIP patient-derived monocytes with fibroblasts of HFrEF cardiac tissue. c Venn diagram depicting common upregulated signaling pathways in monocytes of DNMT3A CHIP carriers with healthy and HFrEF fibroblasts. d Bubble plots representing upregulated ligand-receptor pairs in DNMT3A CHIP monocytes-to-fibroblasts signaling in healthy (left) and HFrEF (right) myocardium. Color encodes communication probability, min. logFC for the interaction depicted is 0.1 and detection in minimum 10% of the cells. e, f Gene ontology analysis of differentially expressed genes (logFC for the interaction is 0.1 and detection in minimum 10% of the cells, p-value < 0.05) using the Enrichr database. Representation of the ten most significant functional categories in healthy (e) and HFrEF (f) interactions represented by Enrichr combined score that considers P value and Z score. g Circular plots depicting EGFR signaling from No-CHIP and CHIP monocytes in healthy heart tissue. h Violin plot depicting HBEGF gene expression from scRNA-seq data of monocytes from HF patients with DNMT3A CHIP and No-CHIP. i Violin plots showing EGFR gene expression in cardiac cell types from snRNA-seq data of cardiac tissue from the septum of 14 control hearts (left) and 3 HFrEF hearts (right). Violin plots represent log2-transformed and normalized UMI counts. Adjusted p values are based on Bonferroni correction. j ELISA-based quantification of HB-EGF in serum of HF patients with DNMT3A CHIP and No-CHIP (n = 10 biologically independent samples for both groups). Source data are provided as a Source Data file. Data are shown as mean ± SEM or box plots with min-max values whiskers. Data are shown as mean ± SEM. j. Normal distribution was assessed using the Shapiro–Wilk test. j. Statistical analysis was performed using two-tailed Mann–Whitney test (j).
Fig. 7
Fig. 7. CHIP monocyte-derived HB-EGF induces cardiac fibroblasts activation.
a Relative DNMT3A expression and (b) HBEGF expression in DNMT3A-deficient PMA-activated THP-1 cells normalized to RPLP0 mRNA expression analyzed by qPCR (n = 12 biologically independent samples). Source data are provided as a Source Data file. c Relative DNMT3A and HB-EGF protein expression in DNMT3A silenced PMA-activated THP-1 cells (n = 4 biologically independent experiments). Source data are provided as a Source Data file. d Immunofluorescence analysis of αSMA protein expression in HB-EGF (100 ng/ml, 48 h) stimulated iHCF (n = 3 biologically independent experiments). Source data are provided as a Source Data file. e Immunofluorescence analysis images of phospho-histone H3 protein expression in HB-EGF stimulated HCF (n = 4 biologically independent experiments). Source data are provided as a Source Data file. f Beating frequency of cardiospheres stimulated with HB-EGF (100 ng/ml, 5 days) (n = 4 for controls and n = 6 for HB-EGF, biologically independent experiments). Source data are provided as a Source Data file. g Cardiospheres area upon stimulation with HB-EGF (n = 4 for controls and n = 5 for HB-EGF, biologically independent experiments). Source data are provided as a Source Data file. h Immunofluorescence analysis of PDGFRα protein expression in HB-EGF stimulated cardiospheres (n = 4 biologically independent experiments). Source data are provided as a Source Data file. i Immunofluorescence analysis of Col1a1 protein expression in HB-EGF stimulated cardiospheres (n = 4 biologically independent experiments). Source data are provided as a Source Data file. Data are shown as mean ± SEM ai Normal distribution was assessed using the Shapiro–Wilk test. ai Statistical analysis was performed using unpaired, two-sided Student’s t tests (ae, gi). t  =  7.758, 22 degrees of freedom (a); t = 2.087, 22 degrees of freedom (b); t = 13.16, 6 degrees of freedom; t = 3.887, 6 degrees of freedom (c); t = 4.464, 4 degrees of freedom (d); t = 2.713, 6 degrees of freedom (e); t = 1.004, 7 degrees of freedom (g); t = 4.333, 4 degrees of freedom (h); t = 6.004, 4 degrees of freedom (i). Statistical analysis was performed using two-tailed Mann–Whitney test (f).
Fig. 8
Fig. 8. Inhibition of HB-EGF-EGFR signaling reduces CHIP monocyte-mediated cardiac fibroblast activation.
a Analysis of phosphorylation of receptors and kinases in iHCF after incubation with supernatant from DNMT3A-silenced THP-1-derived cells for 30 min (n = 3 biologically independent experiments). Source data are provided as a Source Data file. b Quantification of EGFR phosphorylation (n = 3 biologically independent experiments) in iHCF after incubation with supernatant from DNMT3A-silenced THP-1-derived cells for 30 min. Source data are provided as a Source Data file. c Western blot for phospho-Akt (pAkt) and total Akt in iHCF stimulated with HB-EGF or with DNMT3A silenced monocytes (n = 3 biologically independent experiments). Source data are provided as a Source Data file. d Schematic representation of the experimental design used in (eh). e Immunofluorescence analysis of HCF stimulated with DNMT3A silenced monocyte supernatants with or without gefitinib (5 μM) (n = 4 biologically independent experiments). f αSMA protein expression and cell numbers were determined by αSMA and DAPI staining in experiments shown in (e) (n = 4 biologically independent experiments). Source data are provided as a Source Data file. g Immunofluorescence analysis of cardiospheres stimulated with supernatant from DNMT3A silenced THP-1-cells with or without gefitinib (5 μM) (n = 3 biologically independent experiments). h αSMA protein expression and beating frequency of cardiospheres stimulated with supernatant from DNMT3A silenced THP-1-cells with or without gefitinib (n = 3 for αSMA protein expression in biologically independent experiments, beating frequency in n = 7 for both groups without gefitinib and n = 5 for both groups with gefitinib in biologically independent experiments) in experiments shown in (g). Source data are provided as a Source Data file. i Immunofluorescence analysis of HCF stimulated with supernatants from DNMT3A-silenced THP-1-cells with or without HB-EGF neutralizing antibody (50 μg/ml, 48 h) (n = 4 biologically independent experiments). j αSMA protein expression in experiments shown in (i) (n = 4 biologically independent experiments). Source data are provided as a Source Data file. Data are shown as mean ± SEM. ac, f, h, j Normal distribution was assessed using the Shapiro–Wilk test. a-c, f, h, j Statistical analysis was performed using unpaired, two-sided Student’s t tests (b, c). t = 2.783, 4 degrees of freedom (b); t = 2.503, 4 degrees of freedom; t = 4.004, 4 degrees of freedom (c). Statistical analysis was performed using ordinary one-way ANOVA with Dunnett’s correction for pairwise comparisons for data with a Gaussian distribution (f); ordinary one-way ANOVA with post hoc Tukey tests for data with a Gaussian distribution (panel left) and a non-parametric Kruskal-Wallis test with Dunn’s multiple comparisons test for data without a Gaussian distribution (panel right) (h); ordinary one-way ANOVA with Šídák’s multiple comparisons test for data with a Gaussian distribution (j).

References

    1. Steensma DP, et al. Clonal hematopoiesis of indeterminate potential and its distinction from myelodysplastic syndromes. Blood. 2015;126:9–16. doi: 10.1182/blood-2015-03-631747. - DOI - PMC - PubMed
    1. Evans MA, Walsh K. Clonal hematopoiesis, somatic mosaicism, and age-associated disease. Physiol. Rev. 2023;103:649–716. doi: 10.1152/physrev.00004.2022. - DOI - PMC - PubMed
    1. Jaiswal S, et al. Age-related clonal hematopoiesis associated with adverse outcomes. N. Engl. J. Med. 2014;371:2488–2498. doi: 10.1056/NEJMoa1408617. - DOI - PMC - PubMed
    1. Jaiswal S, et al. Clonal hematopoiesis and risk of atherosclerotic cardiovascular disease. N. Engl. J. Med. 2017;377:111–121. doi: 10.1056/NEJMoa1701719. - DOI - PMC - PubMed
    1. Heimlich JB, Bick AG. Somatic mutations in cardiovascular disease. Circ. Res. 2022;130:149–161. doi: 10.1161/CIRCRESAHA.121.319809. - DOI - PMC - PubMed

Substances