. 2024 Jan 19;15(1):615.
doi: 10.1038/s41467-024-44873-4.

Bispecific BCMA/CD24 CAR-T cells control multiple myeloma growth

Affiliations

Bispecific BCMA/CD24 CAR-T cells control multiple myeloma growth

Fumou Sun et al. Nat Commun. .

Abstract

Anti-multiple myeloma B cell maturation antigen (BCMA)-specific chimeric antigen receptor (CAR) T-cell therapies represent a promising treatment strategy with high response rates in myeloma. However, durable cures following anti-BCMA CAR-T cell treatment of myeloma are rare. One potential reason is that a small subset of minimal residual myeloma cells seeds relapse. Residual myeloma cells following BCMA-CAR-T-mediated treatment show less-differentiated features and express stem-like genes, including CD24. CD24-positive myeloma cells represent a large fraction of residual myeloma cells after BCMA-CAR-T therapy. In this work, we develop CD24-CAR-T cells and test their ability to eliminate myeloma cells. We find that CD24-CAR-T cells block the CD24-Siglec-10 pathway, thereby enhancing macrophage phagocytic clearance of myeloma cells. Additionally, CD24-CAR-T cells polarize macrophages to a M1-like phenotype. A dual-targeted BCMA-CD24-CAR-T exhibits improved efficacy compared to monospecific BCMA-CAR-T-cell therapy. This work presents an immunotherapeutic approach that targets myeloma cells and promotes tumor cell clearance by macrophages.


Conflict of interest statement

F.S. and F.Z. are inventors on the patent application “Bispecific BCMA-CD24-CAR-T design”, describing the therapeutic use of BCMA-CD24-CAR-T cells for the treatment of multiple myeloma. The patent number is pending. The other authors declare no competing interests.

Figures
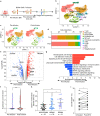
Fig. 1
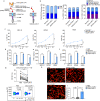
Fig. 1. Proportion of CD24-positive cells is increased in MM after treatment.
a Schematic approach for myeloma patients’ bone marrow single-cell RNA sequencing analysis. b UMAP plot of whole bone marrow mononuclear cells (BMMCs). Whole BMMCs were divided into 11 subclusters: T cell, Monocyte, Plasma/MM, B cell, Erythroid cell, Immature Neutrophils, Myeloid dendritic cell (mDC), Plasmacytoid dendritic cell (pDC), Hematopoietic progenitor cell (HPC) and Megakaryocyte. c UMAP plot of BMMCs derived from Pre-infusion (n = 5) and Post-infusion Day 28 (n = 6). d Bar-views showed the proportion of various cell types in BMMCs of Pre-infusion (n = 5) and Post-infusion Day 28 (n = 6). e Volcano plot of the top differentially expressed genes (DEGs) in residual MM cells. f The violin plot of CD24 expression in each pre-infusion MM and post-infusion D28 MM cells (n = 5 independent patient samples with 13,108 Plasma/MM cells in pre-infusion group; n = 6 independent patient samples with 460 Plasma/MM cells in post-infusion group). g Pathway analysis of the top DEGs in residual MM cells. h The percentage of CD24+ monoclonal plasma cells were compared in samples from patients with monoclonal gammopathy of undetermined significance/smoldering MM (MGUS/SMM) (n = 35), patients with newly diagnosed MM (NDMM) (n = 39), and patients after treatment with relapsed/refractory MM (RRMM) (n = 21). The mean percentage of CD24+/CD138+/CD38+/CD45- plasma cells was increased after treatment. One-way ANOVA was used. Data are presented as mean values ± SD. i Flow cytometry analysis of patient samples and the association between drug response and CD24 expression in MM cells (n = 15). The frequency of the subpopulation of CD138+CD24+ cells increase in 12 of 15 primary myeloma samples post-bortezomib (BTZ) treatment. Paired t test was used. All tests are two-sided. P < 0.05, ∗∗∗P < 0.001. Raw data are provided in the Source Data file. Exact P values for each comparison shown in (f) and (hi) can be found in Supplementary Data 1.
Fig. 2
Fig. 2. CD24-CAR-T cells target MM cells and promote macrophage phagocytic clearance in vitro.
a CD24-CAR-T and MOCK-CAR-T constructs. CD24-CAR vector was constructed by CD24-specific single-chain variable fragments (scFvs), a safety switch (RQR8), and a 4-1BB co-activation domain with CD3ζ. The MOCK-CAR vector contains a safety switch and a 4-1BB co-activation domain with CD3ζ. b The phenotype of CAR-T cells, including the ratio of CD4 and CD8 phenotypes and the ratio of different memory phenotypes (n = 3 independent experiments). Stem cell memory (CD45RO-/CD62L+), central memory (CD45RO+/CD62L+), effector memory (CD45RO+/CD62L), effector cells (CD45RO/CD62L). c CD24-CAR-T cells cytolytic activity in vitro. CAR-T or T cells were added to MM1.S, OMP2, and H929 cell lines at the effector/target (E/T) ratio from 1:5 to 5:1. After 24 h of coculture, cytolytic activity was measured (n = 3 independent experiments). d The expression of T cell activation marker CD69 (n = 3 independent experiments). Data are presented as mean values ± SD. e Interleukin (IL)-2 concentrations on supernatants (n = 3 independent experiments). f Interferon (IFN)-γ concentrations on supernatants (n = 3 independent experiments). g MM patient samples with CD24-CAR-T cells or PBS treatment for 24 h (n = 16). The percentage of the subpopulation of CD138+ cells decreased in 16 of 16 primary myeloma samples post-CD24-CART treatment. A representative example of flow cytometry analysis. h Representative fluorescent images of phagocytic clearance. Phagocytosis was performed by coculture of OPM2 cells that expressed GFP (green), DiD-stained macrophages (red), and CAR-T cells at a ratio of 2:1:1. After a 4-h coculture, suspended cells were washed and detected (n = 3 independent experiments). The experiment was repeated twice with the same results. i Bar plot showing the percentage of phagocytosis detected by flow cytometry analysis (n = 3 independent experiments). Data are presented as mean values ± SD in (bf) and (i). One-way ANOVA was used in (cf), (i) and paired t-test was used in (g). All tests are two-sided. ∗∗P < 0.01, ∗∗∗P < 0.001, ns = P  > 0.05. Raw data are provided in the Source Data file. Exact P values for each comparison shown in (c, d) and (f, g) can be found in Supplementary Data 1.
Fig. 3
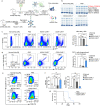
Fig. 3. CD24-CAR-T cells target MM cells and promote macrophage phagocytic clearance in vivo.
a Schematic approach for 5TGM1 mouse model. C57BL/KaLwRij mice were intravenously injected with either PBS or 5TGM1-GFP-DiD cells. After 7 days after injection of 5TGM1 cells, mice were treated with either PBS, MOCK-CAR-T cells, or CD24-CAR-T cells. On day 21 after 5TGM1-cell inoculation, mice were killed. Serum electrophoresis (SPE) was performed. Bone marrow mononuclear cells (BMMCs) were isolated. Dormant (GFP+DiDHi) and activated (GFP+DiDNeg) cells were detected by flow cytometry. BM microenvironmental cells were sorted out for single-cell RNA sequencing (scRNA-seq) (n = 5 mice per group). b SPE of 5TGM1 models. The M-spike is indicated in red (n = 5 per group). The gel has been cut from the outside; no samples/bands were removed. The experiment was repeated twice with the same results. c Representative GFP+ gating strategy to identify MM cell populations in 5TGM1 BM samples. Bar plot showing the percentage of MM cells (GFP+ cells) in 5TGM1 BM samples (n = 3 per group). d Representative F4/80+CD11b+ gating strategy to identify the population of MM cells phagocytosed by macrophages. Bar plot showing the percentage of GFP+ cells phagocytosed by macrophages (n = 3 per group). e Representative CD206+ and CD86+ gating strategy to identify M2-like-phenotype and M1-like-phenotype cell populations in 5TGM1 BM samples (n = 3 per group). f Bar plot showing the percentage of M1-like-phenotype and M2-like-phenotype macrophages after treatment (n = 3 per group). g Kaplan-Meier survival analysis of CAR-T treatment in 5TGM1 models (n = 5 per group). Data are presented as mean values ± SD in (c, d) and (f). One-way ANOVA was used for statistical analysis. P < 0.05, ∗∗P < 0.01, ∗∗∗P < 0.001, ns = P > 0.05. Raw data are provided in the Source Data file. Exact P values for each comparison shown in (cf), (g), and (i) can be found in Supplementary Data 1.
Fig. 4
Fig. 4. scRNA-seq revealed tumor microenvironment modification after CD24-CAR-T cells treatment.
a UMAP plot of BMMCs derived from healthy mice (n = 3 mice per group), MM-bearing mice treated with PBS (n = 3 mice per group), MOCK-CAR-T (n = 3 mice per group) or CD24 CAR-T (n = 3 mice per group). Whole BMMCs were divided into 16 subclusters (Neutrophils-I, Neutrophils-II, Myelocytes-I, Myelocytes-II, Myeloblasts, Monoblasts-I, Monoblasts-II, Basophils, dendritic cells [DCs], Monocytes, Macrophages, Natural killer/ T cells [NK/T], Pro-B, Pre-B-I, Pre-B-II, Erythroblasts). b Bar-views showed the proportion of various cell types in BMMCs of healthy and MM-bearing mice treated with PBS, MOCK-CAR-T, or CD24-CAR-T cells (n = 3 mice per group). c Bar-views showed the proportion of macrophages in whole BMMCs (n = 3 mice per group). (d) UMAP plot of macrophages subcluster. Macrophages were divided into five subclusters. e Bar-views showed the proportion of cells in subclusters of macrophages of healthy and MM-bearing mice treated with PBS, MOCK-CAR-T, or CD24-CAR-T cells (n = 3 mice per group). f KEGG pathway analysis of dramatically changed subcluster 0 of macrophages. g KEGG pathway analysis of dramatically changed subcluster 4 of macrophages. Data are presented as mean values ± SD in (b, c) and (e). One-way ANOVA was used for statistical analysis. P < 0.05, ∗∗P < 0.01, ∗∗∗P < 0.001, ns = P > 0.05. Raw data are provided in the Source Data file. Exact P values for each comparison shown in (b, c) and (e) can be found in Supplementary Data 1.
Fig. 5
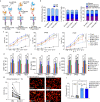
Fig. 5. Bispecific CAR-T cells had increased cell killing and macrophage phagocytic clearance in vitro.
a Dual BCMA-CD24-CAR (Bi-CAR), Tandem CD24-BCMA-CAR (Tan1-CAR), and Tandem BCMA-CD24-CAR (Tan2-CAR) constructs. The dual BCMA-CD24-CAR vector with two complete CAR units: BCMA-CAR and CD24-CAR. P2A was inserted between these 2 CAR vectors. Two tandem CAR vectors were constructed by CD24-scFv and BCMA-scFv, and two scFvs were linked with a (G4S)4 linker. The safety switch RQR8 was integrated into the hinge regions. b The phenotype of CAR-T cells, including the ratio of CD4 and CD8 phenotypes and the ratio of different memory phenotypes (n = 3 independent experiments). c Bispecific CAR-T cells cytolytic activity in vitro. CAR-T or T cells were added at the effector/target (E/T) ratio from 1:5 to 5:1. After 24 h of coculture, cytolytic activity was measured (n = 3 independent experiments). d The expression of T cell activation marker CD69 (n = 3 independent experiments). e IFN-γ concentrations on supernatants (n = 3 independent experiments). f IL-2 concentrations on supernatants (n = 3 independent experiments). g Patient samples with Bi-CAR-T cells or PBS treatment for 24 h (n = 16). The percentage of the subpopulation of CD138+ cells decreased in 16 of 16 primary myeloma samples post-CART treatment. h Phagocytosis was performed by coculture of OPM2 cells that expressed GFP (green), DiD-stained macrophages (red), and CAR-T cells at a ratio of 2:1:1. After a 4-h coculture, suspended cells were washed and detected. Fluorescent images of phagocytic clearance (n = 3 independent experiments). The experiment was repeated twice with the same results. i Bar plot showing the percentage of phagocytosis detected by flow cytometry analysis (n = 3 independent experiments). Data are presented as mean values ± SD in (bf) and (i). One-way ANOVA was used in (c), (d), (e), (f), (i) and paired t-test was used in (g). All tests are two-sided. P < 0.05, ∗∗P < 0.01, ∗∗∗P < 0.001, ns = P > 0.05. Raw data are provided in the Source Data file. Exact P values for each comparison shown in (c, d) and (f, g) can be found in Supplementary Data 1.
Fig. 6
Fig. 6. Bispecific CAR-T cells eliminate MM cells in vivo.
a Schematic of the experimental setup. NSG mice were administered 1.5 × 106 MM1.S or OPM2 cells by intravenous injection. On day 7 after MM-cell injection, 1.5 × 106 CAR-T cells were administered. Mice were weighed and monitored for signs of distress every 3 days. Myeloma progression was monitored every 7 days until the mice developed hind-limb paralysis (n = 5 mice per group). b Bioluminescence images of MM1.S MM-bearing mice treated with CAR-T cells or PBS (n = 5 mice per group). c Quantitative analysis of bioluminescence signals of (b). Data are presented as mean values ± SD. d Kaplan-Meier survival analysis of the experiment shown in (b). e Representative bioluminescence images of OPM2 MM-bearing mice treated with CAR-T cells or PBS (n = 5 mice per group). f Quantitative analysis of bioluminescence signals of (e). Data are presented as mean values ± SD. g Kaplan-Meier survival analysis of the experiment shown in (e). One-way ANOVA was used for statistical analysis. ∗∗P < 0.01, ∗∗∗P < 0.001, ns = P > 0.05. Raw data are provided in the Source Data file. Exact P values for each comparison shown in (c, d) and (f, g) can be found in Supplementary Data 1.
Fig. 7
Fig. 7. Schematic representation of the roles of the BCMA-CD24-CAR-T cells in MM microenvironment.
MM cells expressing CD24 exhibit features of minimal residual disease. In MM microenvironment, CD24 is an important checkpoint molecule for controlling the innate immune response. When CD24 on tumor cells combines with Siglec-10 on macrophages, it causes immune receptor tyrosine inhibitory motif (ITIM) region to be phosphorylated, thus blocking Toll-like receptor-mediated inflammation and activating a series of intracellular signal pathways to achieve effective immunosuppression, promoting tumor immune escape and inhibiting cytoskeletal rearrangement, which blocks the macrophage phagocytic clearance. Additionally, MM cells produce chemokines, such as CXCR4 and CXCL12 that promote macrophage migration to the tumor niche and polarize macrophages toward an M2-like phenotype. We developed BCMA-CD24 CAR-T cells that were activated in vitro and in vivo against both bulk MM cells and minimal residual MM cells. Meanwhile, BCMA-CD24 CAR-T cells could block the CD24-Siglec-10 pathway and promote macrophage phagocytic clearance. Inhibition of the CD24-Siglec-10 pathway also leads to the activation of inflammatory signaling and antitumoral signaling. The IFN-γ and TNFα released by activated BCMA-CD24 CAR-T cells can also promote macrophages polarized to M1-like macrophage phenotype and reverse the immunosuppression caused by excessive M2-like macrophage phenotype in the MM microenvironment.

References

    1. Parikh RH, Lonial S. Chimeric antigen receptor T-cell therapy in multiple myeloma: a comprehensive review of current data and implications for clinical practice. CA Cancer J. Clin. 2023;73:275–285. doi: 10.3322/caac.21771. - DOI - PubMed
    1. Kastritis E, Terpos E, Dimopoulos MA. How I treat relapsed multiple myeloma. Blood. 2022;139:2904–2917. doi: 10.1182/blood.2020008734. - DOI - PubMed
    1. Minnie SA, Hill GR. Immunotherapy of multiple myeloma. J. Clin. Investig. 2020;130:1565–1575. doi: 10.1172/JCI129205. - DOI - PMC - PubMed
    1. Rasche L, Wasch R, Munder M, Goldschmidt H, Raab MS. Novel immunotherapies in multiple myeloma - chances and challenges. Haematologica. 2021;106:2555–2565. doi: 10.3324/haematol.2020.266858. - DOI - PMC - PubMed
    1. Raje N, et al. Anti-BCMA CAR T-cell therapy bb2121 in relapsed or refractory multiple myeloma. N. Engl. J. Med. 2019;380:1726–1737. doi: 10.1056/NEJMoa1817226. - DOI - PMC - PubMed