. 2024 Jan 19;15(1):619.
doi: 10.1038/s41467-024-44898-9.

Dual electrical stimulation at spinal-muscular interface reconstructs spinal sensorimotor circuits after spinal cord injury

Affiliations

Dual electrical stimulation at spinal-muscular interface reconstructs spinal sensorimotor circuits after spinal cord injury

Kai Zhou et al. Nat Commun. .

Abstract

The neural signals produced by varying electrical stimulation parameters lead to characteristic neural circuit responses. However, the characteristics of neural circuits reconstructed by electrical signals remain poorly understood, which greatly limits the application of such electrical neuromodulation techniques for the treatment of spinal cord injury. Here, we develop a dual electrical stimulation system that combines epidural electrical and muscle stimulation to mimic feedforward and feedback electrical signals in spinal sensorimotor circuits. We demonstrate that a stimulus frequency of 10-20 Hz under dual stimulation conditions is required for structural and functional reconstruction of spinal sensorimotor circuits, which not only activates genes associated with axonal regeneration of motoneurons, but also improves the excitability of spinal neurons. Overall, the results provide insights into neural signal decoding during spinal sensorimotor circuit reconstruction, suggesting that the combination of epidural electrical and muscle stimulation is a promising method for the treatment of spinal cord injury.


Conflict of interest statement

The authors declare no competing interests.

Figures
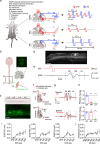
Fig. 1
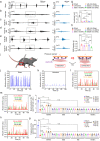
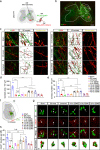
Fig. 1. Characteristics of the EEMS system at the interface of the spinal cord and muscle.
a Schematic showing the application of the EEMS system, which comprises EES and MS, to the sensorimotor circuit in SCI mice. The interval between spinal and muscular stimulation was set to 15 ms. The interval between the two EES pulses or two MS pulses depended on the stimulation frequency. b AAV2/2Retro-hSyn-EGFP-WPRE-pA was injected into the TA muscles of intact mice to label motoneurons. Scale bar, 100 μm. The experiment was repeated 3 times independently with similar results. c Spatial distribution of motoneurons innervating the TA muscles. Scale bar, 300 μm. The experiment was repeated 3 times independently with similar results. d Correct positioning of the electrode was confirmed by magnetic resonance imaging analysis at 4 weeks after SCI; the white arrow points to sites of contact of the electrode, and the dashed white lines indicate the SCI site. Scale bar, 2.5 mm. The experiment was repeated one time. e EES (red line) was administered, and SCEP (black line) was recorded with the TA muscles of intact mice. ER: early latency response, MR: medium latency response, LR: late latency response. f The schematic illustrates which neurons, fibers, and/or circuits may be inhibited as stimulation signals delivered to the muscles from the spinal cord during each experimental operation in anesthetized intact mice. g Representative SCEP recorded in the muscle with different mice during repeated EES (1 Hz) and after the administration of tetrodotoxin (TTX) or tizanidine. Each waveform represents the average of the responses to 50 EES. h Histograms for TTX (upper) and tizanidine (lower) conditions showing the relative change in the SCEPs as compared with baseline (n = 7 mice per group). i ERs, MRs, and LRs induced by EES (n = 8 mice per group). j Curve showing the electrical signal received in the spinal cord after MS (n = 5 mice per group). Schematics in ac, and f were created with BioRender.com. Data represent the mean ± SEM; Statistical analysis was performed using two-tailed unpaired t-test (h), ***p < 0.001.
Fig. 2
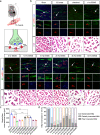
Fig. 2. SCEPs recorded in the TA muscle of SCI mice after EEMS.
a Experimental scheme. b SCEPs were recorded for mice in the sham, untrained, and ES groups 7 days and 29 days after electrode implantation. The waveform in the figure is the average of 50 SCEPs. ce Histogram reporting the amplitudes of ERs (c), MRs (d), and LRs (e) of SCEPs in the sham, untrained, 1- to 40-Hz EEMS, 1- to 40-Hz EES, 1- to 40-Hz MS, and 1- to 40-Hz EEShc groups 29 days after electrode implantation (n = 8 mice per group). Data represent the mean ± SEM; ns: no statistically significant difference, *p < 0.05, **p < 0.01, ***p < 0.001, one-way ANOVA followed by the Bonferroni post hoc test.
Fig. 3
Fig. 3. Evaluation of function of TA in SCI mice after EEMS, EES, MS, or EEShc.
af Left (black), the graphs show surface EMGs for the TA muscles in the sham (a), untrained (b), 10−20 Hz EES (c), 10−20 Hz MS (d), 10−20 Hz EEMS (e), and 10−20 Hz EEShc (f) groups over a period 5 s, selected from a 30-second recording. Right (blue), enlarged view of the EMGs burst in the dashed box on the left. Mice from the sham group exhibited five steps within 5 s, while both untrained and trained groups displayed three to four steps. g The maximum amplitude of surface EMG bursts continuously for 5 s in the sham, untrained, 10−20 Hz EES, 10−20 Hz MS, 10−20 Hz EEShc, and 10−20 Hz EEMS groups (n = 6 mice per group). h Average duration of a single TA burst in 5 s in the sham, untrained, 10−20 Hz EES, 10−20 Hz MS, 10−20 Hz EEShc, and 10−20 Hz EEMS groups (n = 6 mice per group). i Schematic diagram showing the experimental approach for measuring muscle strength. When the muscle was relaxed, the current through the sensor was denoted as I0; when the muscle contracted, the current through the sensor was I. Schematic was created with BioRender.com. j, k TA muscle contraction and its corresponding relative current in mice of the sham (j) and untrained (k) groups. ln TA muscle contraction curve for mice in the 10- to 20- HzEEMS (red), EES (green), MS (black), and EEShc (orange) groups. o, p The intensity (o) and frequency (p) of TA muscle contraction in mice in the sham, untrained, and 1- to 40-Hz EEMS, 1- to 40-Hz EES, 1- to 40-Hz MS, and 1- to 40-Hz EEShc groups (n = 6 mice per group). Data represent the mean ± SEM; ns: no statistically significant difference, *p < 0.05, **p < 0.01, ***p < 0.001, one-way ANOVA followed by the Bonferroni post hoc test.
Fig. 4
Fig. 4. Morphology and neural innervation of the TA muscles in SCI mice after EEMS.
a Schematic diagram of the NMJ. Bottom: green indicates motoneuron axons, blue indicates presynaptic vesicle proteins, and red indicates the acetylcholine receptor (AChR). Schematic was created with BioRender.com. b Top, antibodies against NF (green), α-BTX (red), and syn (blue) were used to label NMJs in the TA muscle from mice in the sham, ES onset, untrained, and 1- to 40-Hz EEMS groups. In each image, the white arrow indicates a single NMJ. Scale bar, 50 μm. Middle, higher-magnification images of the NMJ indicated by each white arrow. Scale bar, 20 μm. Bottom, hematoxylin and eosin (H&E) staining of the TA muscle from mice in the sham, ES onset, untrained, and 1- to 40-Hz EEMS groups. Scale bar, 50 μm. c Cross-sectional area of muscle fibers in the TA muscle from mice in the sham, ES onset, untrained, and 1- to 40-Hz EEMS groups (n = 5 mice per group). d Percentage of denervation, partial innervation, and complete innervation of the TA muscles from mice in the sham, ES onset, untrained, and 1- to 40-Hz EEMS groups (n = 5 mice per group). Data represent the mean ± SEM; ***p < 0.001, one-way ANOVA followed by the Bonferroni post hoc test (c).
Fig. 5
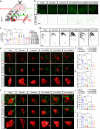
Fig. 5. Sensory-motor connectivity in SCI mice after EEMS.
a Diagram illustrating the tracing of PTs (1), interneurons (1), motoneurons (2), and DRG fibers (1 and 2) in Lbx1cre mice. Schematic was created with BioRender.com. b The PTs (green) in the spinal cord (upper images) were labeled in the sham, ES onset, untrained, and 10- to 20-Hz EEMS groups, and modelled in 3D (lower images). Scale bar, 50 μm. c Number of PTs in the sham, ES onset, untrained, and 1- to 40-Hz EEMS groups (n = 5 mice per group). d DRG fibers in the spinal cord were labeled in the sham, ES onset, untrained, and 10- to 20-Hz EEMS groups. Scale bar, 200 μm. The experiment was repeated 3 times independently with similar results. e Upper, colocalization of DRG fibers and interneurons in the sham, ES onset, untrained, and 10- to 20-Hz EEMS groups. Scale bar, 15 μm. Middle, 3D reconstruction of DRG fibers and interneurons. Scale bar, 15 μm. Lower, highly magnified images of interneurons. Gray region represents the region of connection between DRG fibers and interneurons. Scale bar, 10 μm. f, g Area (f) and number (g) of contacts of DRG fibers per 1000 μm2 of the interneuron surface area in the sham, ES onset, untrained, and 10- to 20-Hz EEMS groups (n = 6 mice per group). h Upper, colocalization of DRG fibers and motoneurons in the sham, ES onset, untrained, and 10- to 20-Hz EEMS groups. Scale bar, 15 μm. Middle, 3D reconstruction of DRG fibers and motoneurons. Scale bar, 15 μm. Lower, highly magnified image of motoneurons. Gray region represents the region of connection between DRG fibers and motoneurons. Scale bar, 10 μm. i, j Area (i) and number (j) of contacts of DRG fibers per 1000 μm2 of the motoneuron surface in the sham, ES onset, untrained, and 10- to 20-Hz EEMS groups (n = 6 mice per group). Data represent the mean ± SEM; ns: no statistically significant difference, **p < 0.01, ***p < 0.001, one-way ANOVA followed by the Bonferroni post hoc test.
Fig. 6
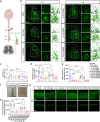
Fig. 6. Morphological characteristics of spinal motoneurons in SCI mice after EEMS.
a Experimental scheme for labeling motoneurons. Schematic was created with BioRender.com. b AAV2/2Retro-hSyn-EGFP-WPRE-pA was injected into the TA muscle to trace the retrograde projection spinal motoneurons. Left, spinal motoneurons in the sham, ES onset, untrained, and 10- to 20-Hz ES groups. Scale bar, 200 μm. Upper right, higher-magnification images and 3D model of the dendrites in the small boxed area. Scale bar, 50 μm. Lower right, partial images and 3D model of the motoneurons in the large boxed area. Scale bar, 100 μm. c Number of MNs per 100,000 μm2 of the coronal section of the spinal cord in the sham, ES onset, untrained, and 1- to 40-Hz ES groups (n = 6 mice per group). d, e Mean number of dendrite terminal points (d) and volume of dendrites (e) of motoneurons in the sham, ES onset, untrained, and 1- to 40-Hz EEMS groups (n = 6 mice per group). f Tissue clearing technique was performed on the lumbar spinal cord. Scale bar, 2 mm. g Upper, spatial distribution of motoneurons in the L2−L4 spinal cord in the sham, ES onset, untrained, and 10- to 20-Hz EEMS groups. Scale bar, 200 μm. Lower, 3D models of the motoneurons. Scale bar, 200 μm. h Average length of motoneuron dendrites in the L2−L4 spinal cord in the sham, ES onset, untrained, and 10- to 20-Hz EEMS groups (n = 6 mice per group). Data represent the mean ± SEM; ns: no statistically significant difference, *p < 0.05, **p < 0.01, ***p < 0.001, one-way ANOVA followed by the Bonferroni post hoc test.
Fig. 7
Fig. 7. Connection between spinal premotor interneurons and motoneurons in SCI mice after EEMS.
a Injection scheme to visualize the network of spinal interneurons innervating the TA muscle in ChATcre mice. b Interneurons (green) and motoneurons (red) are shown from an intact mouse. The spatial organization of Rexed’s laminae I−X is shown. Scale bar, 200 μm. The experiment was repeated 3 times independently with similar results. c Left, synaptic connections between interneurons and motoneurons in the sham, ES onset, untrained, and 10- to 20-Hz EEMS groups. Scale bar, 20 μm. Middle, a 3D model of the connections between interneurons and motoneurons. Scale bar, 20 μm. Right, higher-magnification images of the boxed area. Yellow regions (overlap of GFP and mCherry staining) indicate regions of connection between interneurons and motoneurons. Scale bar, 10 μm. d, e Contact area (d) and number (e) of interneurons per 1000 μm2 of the motoneuron surface in the sham, ES onset, untrained, and 1- to 40-Hz EEMS groups (n = 6 mice per group). f Diagram illustrating how motoneurons were traced. g CTB was injected into the TA muscle to retrogradely trace motoneurons (green). vGluT1 (red) labeled axonal terminals of glutamatergic neurons in the sham, ES onset, untrained, and 10- to 20-Hz EEMS groups. Scale bar, 50 μm. The motoneuron and vGluT1 terminal indicated by the white arrow in each image was subjected to 3D modeling. Scale bar, 10 μm. h Number of vGluT1 boutons in contact with each motoneuron (n = 5 mice per group). Schematics in a and f were created with BioRender.com. Data represent the mean ± SEM; ns: no statistically significant difference, ***p < 0.001, one-way ANOVA followed by the Bonferroni post hoc test.
Fig. 8
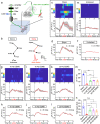
Fig. 8. Ca2+ signaling in lumbar motoneurons in SCI mice after EEMS.
a Schematic of the fiber photometry setup. Ca2+ transients were recorded from motoneurons of freely moving mice. DM, dichroic mirror; PMT, photomultiplier tube. Schematic was created with BioRender.com. b Raw traces of changes in GCaMP6 fluorescence that were related to flexion of the ankle joint of the hind limbs. ΔF/F represents the change in fluorescence from the mean level before the task. c, e, g, i, k Ca2+ signals associated with ankle flexion in a single mouse from the sham (c), untrained (e), 10-Hz EEMS (g), 15-Hz EEMS (i), and 20-Hz EEMS (k) groups. Upper, heatmap of Ca2+ signals aligned with the initiation of ankle flexion. Each row plots one flexion event, and a total of six flexion events are illustrated. The color scale at the left indicates ΔF/F. Lower, plot of the average Ca2+ transients. Thick lines indicate the mean, and shaded areas indicate SEM. The red line indicates the time of ankle flexion. d, f, h, j, l Mean Ca2+ transients associated with ankle flexion for the entire test group (n = 5 mice per group) for each condition: sham (d), untrained (f), 10-Hz EEMS (h), 15-Hz EEMS (j), and 20-Hz EEMS (l). m Average peak fluorescence for six ankle flexions (n = 5 mice per group). The curve represents the mean of 30 signals, and the shaded areas indicate SEM. n The AUC of the average fluorescence peak for six ankle flexions (n = 5 mice per group). Data represent the mean ± SEM; ns: no statistically significant difference, *p < 0.05, **p < 0.01, ***p < 0.001, one-way ANOVA followed by the Bonferroni post hoc test.
Fig. 9
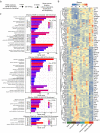
Fig. 9. Changes in mRNAs expressed in motoneurons in the spinal sensorimotor circuits of SCI mice after EEMS.
a Overview of RNA sequencing and analysis. b Heatmap showing the expression of selected differentially expressed genes (effective EEMS vs sham, effective EEMS vs untrained, effective EEMS vs EES, effective EEMS vs MS, and effective EEMS vs ineffective EEMS). c GO terms were generated for genes that were upregulated or downregulated in the effective EEMS groups relative to their levels in the untrained group, EES group, MS group, or ineffective EEMS (-log10FDR > 1.5). The term GO is mainly associated with Neuron axon development, Synaptic function, and Inflammation and apoptosis.
Fig. 10
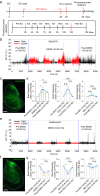
Fig. 10. The impact of various electrical stimulation systems on the neurotransmitter flow of Glu and GABA.
a Flowchart illustrating the experimental setup for electrical stimulation training and fluorescent probe detection. b Burst curve of Glu flow pre, during and post EEMS (10–20 Hz). c Fluorescence image of glutamatergic neurons labeled by iGluSnFR. Scale bar: 200 μm. The experiment was repeated 3 times independently with similar results. d Left: The relative change in the burst frequency of Glu flow during and post EEMS (10–20 Hz) was compared to that pre-EEMS (10–20 Hz) (n = 3 mice per group). Middle: The relative change in the burst frequency of Glu flow during and post EES (10–20 Hz) was compared to that pre-EES (10–20 Hz) (n = 3 mice per group). Right: The relative change in the burst frequency of Glu flow during and post MS (10–20 Hz) was compared to that pre-MS (10–20 Hz) (n = 3 mice per group). e Burst curve of GABA flow before, during and after EEMS (10–20 Hz). f Fluorescence image of GABAergic neurons labeled by iGABASnFR. Scale bar: 200 μm. The experiment was repeated 3 times independently with similar results. g Left: The relative change in the burst frequency of GABA flow during and post EEMS (10–20 Hz) was compared to that pre-EEMS (10–20 Hz) (n = 3 mice per group). Middle: The relative change in the burst frequency of GABA flow during and post EES (10–20 Hz) was compared to that pre-EES (10–20 Hz) (n = 3 mice per group). Right: The relative change in the burst frequency of GABA flow during and post MS (10–20 Hz) was compared to that pre-MS (10–20 Hz) (n = 3 mice per group). Data represent the mean ± SEM, ns: no statistically significant difference, *p < 0.05, **p < 0.01, statistical analysis was carried out with a two-tailed paired t-test (d and g).

Similar articles

Cited by

References

    1. Krook-Magnuson E, Gelinas JN, Soltesz I, Buzsáki G. Neuroelectronics and Biooptics: Closed-Loop Technologies in Neurological Disorders. JAMA Neurol. 2015;72:823–829. doi: 10.1001/jamaneurol.2015.0608. - DOI - PMC - PubMed
    1. Liu Y, et al. Morphing electronics enable neuromodulation in growing tissue. Nat. Biotechnol. 2020;38:1031–1036. doi: 10.1038/s41587-020-0495-2. - DOI - PMC - PubMed
    1. Gilron, R.E., et al. Long-term wireless streaming of neural recordings for circuit discovery and adaptive stimulation in individuals with Parkinson’s disease. Nat. Biotechnol. (2021). - PMC - PubMed
    1. Little S, et al. Adaptive deep brain stimulation in advanced Parkinson disease. Ann. Neurol. 2013;74:449–457. doi: 10.1002/ana.23951. - DOI - PMC - PubMed
    1. Shih CH, Lacagnina M, Leuer-Bisciotti K, Pröschel C. Astroglial-derived periostin promotes axonal regeneration after spinal cord injury. J. Neurosci. 2014;34:2438–2443. doi: 10.1523/JNEUROSCI.2947-13.2014. - DOI - PMC - PubMed