. 2024 Jan 19;7(1):111.
doi: 10.1038/s42003-023-05726-w.

Differences in regulation mechanisms of glutamine synthetases from methanogenic archaea unveiled by structural investigations

Affiliations

Differences in regulation mechanisms of glutamine synthetases from methanogenic archaea unveiled by structural investigations

Marie-Caroline Müller et al. Commun Biol. .

Abstract

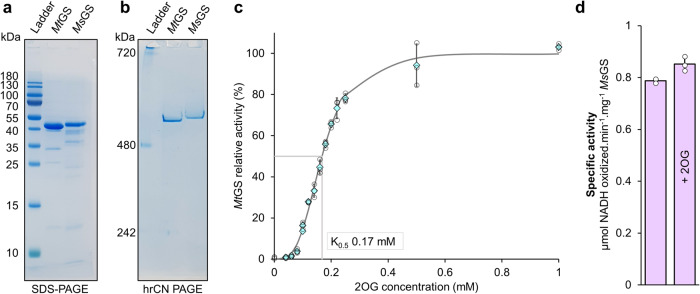
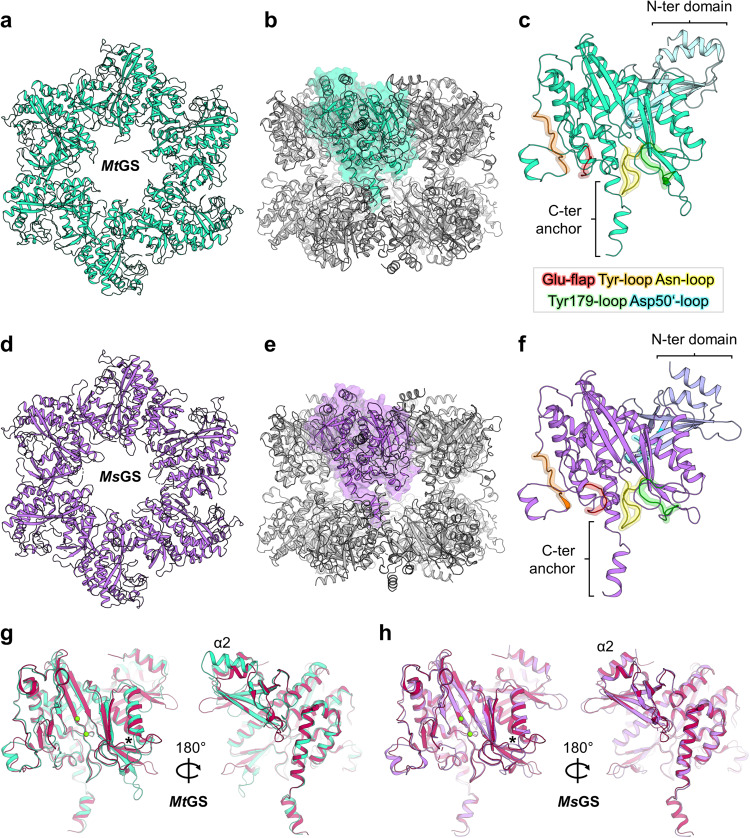
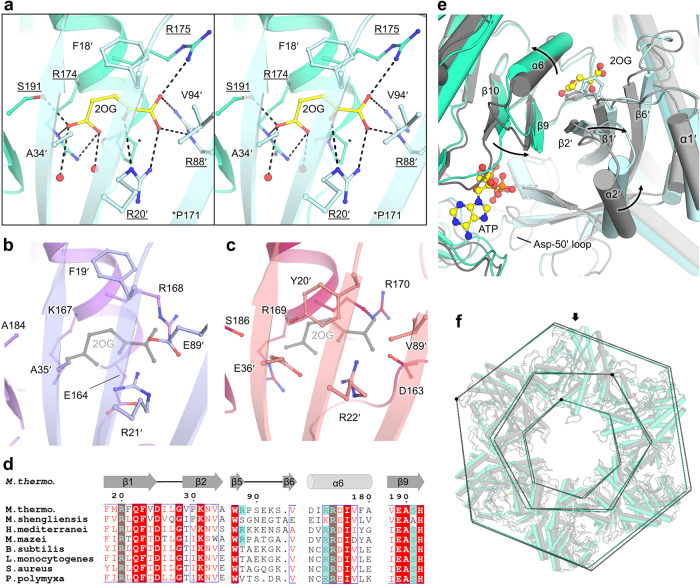
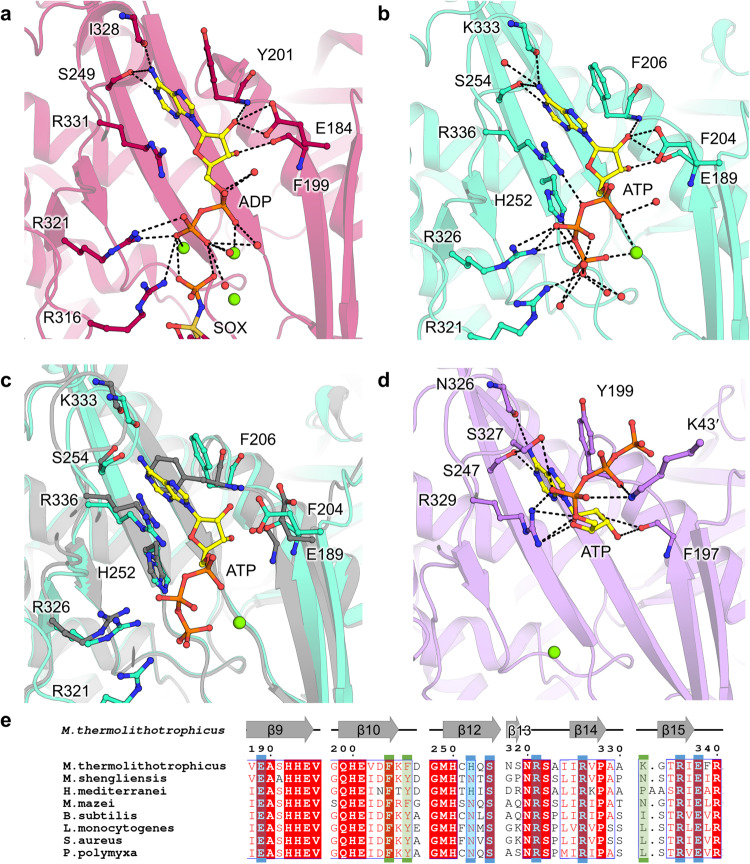
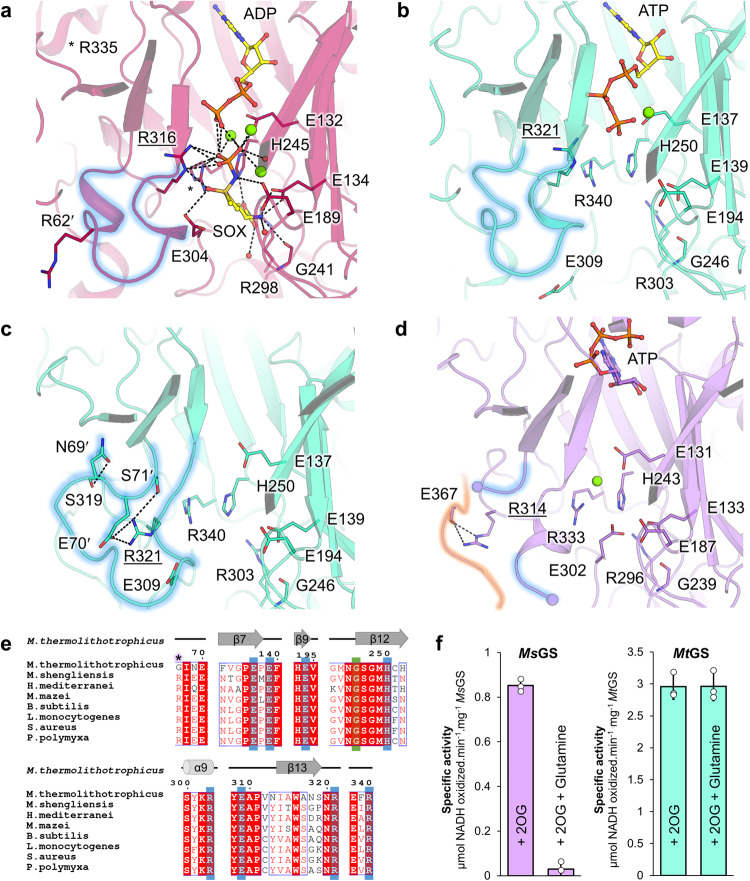
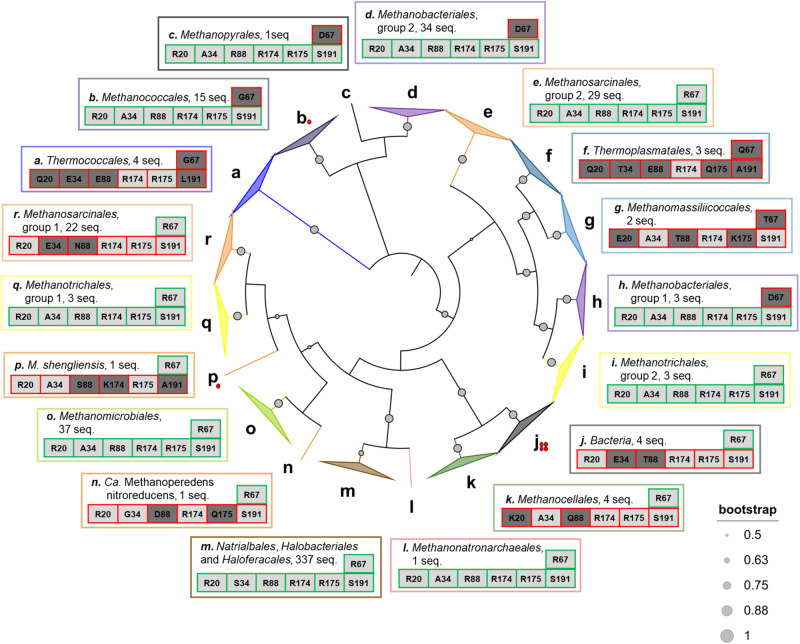
Glutamine synthetases (GS) catalyze the ATP-dependent ammonium assimilation, the initial step of nitrogen acquisition that must be under tight control to fit cellular needs. While their catalytic mechanisms and regulations are well-characterized in bacteria and eukaryotes, only limited knowledge exists in archaea. Here, we solved two archaeal GS structures and unveiled unexpected differences in their regulatory mechanisms. GS from Methanothermococcus thermolithotrophicus is inactive in its resting state and switched on by 2-oxoglutarate, a sensor of cellular nitrogen deficiency. The enzyme activation overlays remarkably well with the reported cellular concentration for 2-oxoglutarate. Its binding to an allosteric pocket reconfigures the active site through long-range conformational changes. The homolog from Methermicoccus shengliensis does not harbor the 2-oxoglutarate binding motif and, consequently, is 2-oxoglutarate insensitive. Instead, it is directly feedback-inhibited through glutamine recognition by the catalytic Asp50'-loop, a mechanism common to bacterial homologs, but absent in M. thermolithotrophicus due to residue substitution. Analyses of residue conservation in archaeal GS suggest that both regulations are widespread and not mutually exclusive. While the effectors and their binding sites are surprisingly different, the molecular mechanisms underlying their mode of action on GS activity operate on the same molecular determinants in the active site.


Conflict of interest statement

The authors declare no competing interests.

Figures

Fig. 1
Fig. 1. Purification and characterization of GS from methanogenic archaea.
a SDS-PAGE and (b) Native PAGE of 2 µg purified MtGS and MsGS. c Relative activity of MtGS at different 2OG concentrations. The presented fit (grey plain line) is extrapolated from the determined Michaelis-Menten parameters. d The specific activity of MsGS without or with 2 mM 2OG at 40 mM glutamate and 20 mM NH4Cl. For c and d data is represented as mean (by cyan diamonds on panel (c)) ± standard deviation (s.d.) and individual values are shown as white circles (n = 3).
Fig. 2
Fig. 2. Structural organization of archaeal GS.
All models are in the apo state and represented in cartoons. a Top view of one MtGS hexamer. b Side view of the MtGS dodecamer with one subunit shown in a transparent surface (cyan). c MtGS monomer with the main loops highlighted. The color coding of the loops is indicated in the box. The N- and C- terminal domains are colored light blue and cyan, respectively. d Top view of one MsGS hexamer. e The side view of the MsGS dodecamer with one subunit shown as a transparent surface (purple). f MsGS monomer with the main loops highlighted with the same color coding as in panel (c). The N- and C-terminal domains are colored lavender and purple, respectively. g Overlay of MtGS (cyan) and BsGS apo state (red, PDB 4LNN). h Overlay of MsGS (purple) and BsGS apo state (red). For panels (g, h) the star indicates the position of the loop deviating in both archaeal GS compared to BsGS. Mg atoms are displayed as green spheres.
Fig. 3
Fig. 3. 2OG binding site and structural rearrangement in MtGS.
a Close-up of the 2OG binding site in MtGS (cyan cartoon, the adjacent monomer in light blue) shown as a stereo view. 2OG and the residues in its vicinity are shown as balls and sticks with contacts in black dashes. b, c Same view as in (a) showing MsGS apo ((b) purple cartoon, with the adjacent subunit in light purple) and BsGS apo ((c) red cartoon, with the adjacent subunit in light red, PDB 4LNN). 2OG from MtGS (gray) was superposed to visualize the clash with E89’ for MsGS and E36’/Y20’ for BsGS. d Sequence alignment of different GSI-α in which 2OG-binding residues observed in MtGS are highlighted with a cyan box (see Fig. S11 for the entire alignment). e Structural rearrangements between the apo (gray cartoon) and 2OG/Mg2+/ATP bound state (cyan cartoon). The adjacent monomer is colored lighter. Phe18’ is shown as sticks. Arrows highlight the movements caused by 2OG binding. f MtGS apo (gray cartoon) superposed to MtGS-2OG/Mg2+/ATP (cyan cartoon). The superposition was done on one monomer (indicated by an arrow), and a dashed line was drawn on the Cα position of Val4, Gly198, and Asn267 to illustrate the overall movements. For all, oxygen, nitrogen, and phosphorus are colored in red, blue, and orange, respectively. Carbons are colored depending on the chain and in yellow for ligands.
Fig. 4
Fig. 4. ATP-binding site comparison between different GSI-α.
a ATP binding site in BsGS transition state (containing SOX/Mg2+/ADP, PDB 4LNI) and (b) MtGS-2OG/Mg2+/ATP. c Superposition of the C-terminal domain of MtGS apo (gray) on MtGS-2OG/Mg2+/ATP (cyan), with an overlay of the ATP-binding residues. d ATP binding site in MsGS-Mg2+/ATP. Models are represented in transparent cartoons with the ligands (yellow) and interacting residues shown as balls and sticks. Oxygen, nitrogen, sulfur, phosphorus, and magnesium are colored red, blue, dark yellow, orange, and green, respectively. Carbons are colored by chain and ATP carbons in yellow. Hydrogen bonds are visualized as black dashes. e Sequence alignment of the ATP binding residues. Residues coordinating the nucleotide via side chain and main chain hydrogen bonds are highlighted by a blue and green box, respectively (based on MtGS). MsGS K43’/S327 were omitted from the analysis due to the artefactual γ-phosphate position.
Fig. 5
Fig. 5. Glutamate-binding site comparison and glutamine feedback inhibition.
ad Glutamate binding site in a BsGS-SOX/Mg2+/ADP (red, 4LNI), (b) MtGS-2OG/Mg2+/ATP (cyan), (c) MtGS apo (cyan), and (d) MsGS-Mg2+/ATP (purple). Models are in cartoons with ligands and equivalent residues binding SOX as balls and sticks. Oxygen, nitrogen, sulfur, phosphorus, and magnesium are colored red, blue, dark yellow, orange, and green, respectively. Carbons are colored by chain and ATP carbons in yellow. Hydrogen bonds are visualized as black dashes. The Asp-50’ loop region is highlighted by a blue glow. For MsGS, the Tyr-loop is highlighted with an orange glow. An underlined label highlights the catalytic arginine (e.g., R321 in MtGS). e Alignment of the residues involved in glutamate binding (based on BsGS). Side chain and main chain interactions are highlighted by a blue and green box, respectively. A star highlights the arginine responsible for glutamine feedback inhibition in BsGS. f Specific activity in the absence and presence of glutamine in both archaeal GS. Data is represented as mean ± s.d and individual values are shown as white circles (n = 3).
Fig. 6
Fig. 6. Conservation of residues binding 2OG and glutamine in archaeal GS.
The presented phylogenic inner tree (maximum likelihood) was constructed with the 500 closest sequences to MtGS in the RefSeq database, restricted to the domain Archaea, as well as the sequences of the bacterial GSI-α from B. subtilis, S. aureus, L. monocytogenes and P. polymyxa. The tree was colored by orders (except for Bacteria), and gray dots with different radii represent the bootstrap support of each branch. Branches containing monophyletic groups are collapsed. Sequences forming monophyletic branches are gathered and labeled by a letter. The branch containing 337 sequences belonging to Natrialbales, Halobacteriales, and Haloferacales orders is condensed as no clear monophyletic groups could have been extracted. The outer panels display the most common residues at equivalent positions involved in 2OG (Arg20, Arg88, Arg174, Arg175, and Ser191, MtGS numbering, bottom line) and glutamine (position 67 in MtGS, upper line) binding. Panels are framed and labeled with the color and letter used in the inner tree. Ala34 in MtGS is not involved in 2OG coordination, but a substitution by a bulky residue (e.g. glutamate) would hinder its fixation. The residues are colored in light or dark gray depending on whether they allow metabolite binding or not, respectively. The residue distribution for each position in each group is presented in Fig. S19, and the sequences can be found in Supplementary Data 2. The GS that are predicted to be able or unable to bind 2OG and glutamine are framed in green and red, respectively. Red dots indicate the GSI-α structurally characterized previously or in the present work.

Similar articles

Cited by

References

    1. Cabello P, Roldán MD, Moreno-Vivián C. Nitrate reduction and the nitrogen cycle in archaea. Microbiology. 2004;150:3527–3546. doi: 10.1099/mic.0.27303-0. - DOI - PubMed
    1. Kuypers MMM, Marchant HK, Kartal B. The microbial nitrogen-cycling network. Nat. Rev. Microbiol. 2018;16:263–276. doi: 10.1038/nrmicro.2018.9. - DOI - PubMed
    1. Zhang X, Ward BB, Sigman DM. Global nitrogen cycle: critical enzymes, organisms, and processes for nitrogen budgets and dynamics. Chem. Rev. 2020;120:5308–5351. doi: 10.1021/acs.chemrev.9b00613. - DOI - PubMed
    1. Martinez-Espinosa RM. Microorganisms and their metabolic capabilities in the context of the biogeochemical nitrogen cycle at extreme environments. Int. J. Mol. Sci. 2020;21:4228. doi: 10.3390/ijms21124228. - DOI - PMC - PubMed
    1. Arcondéguy T, Jack R, Merrick M. PII signal transduction proteins, pivotal players in microbial nitrogen control. Microbiol. Mol. Biol. Rev. 2001;65:80–105. doi: 10.1128/MMBR.65.1.80-105.2001. - DOI - PMC - PubMed

Publication types

LinkOut - more resources