

Connectome dysfunction in patients at clinical high risk for psychosis and modulation by oxytocin
- PMID: 38243074
- PMCID: PMC11189815
- DOI: 10.1038/s41380-024-02406-x
Connectome dysfunction in patients at clinical high risk for psychosis and modulation by oxytocin
Abstract
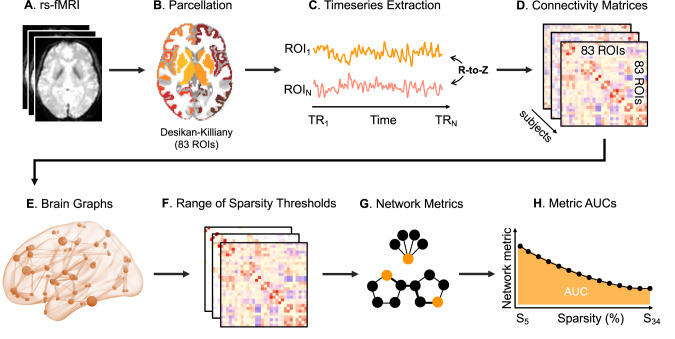
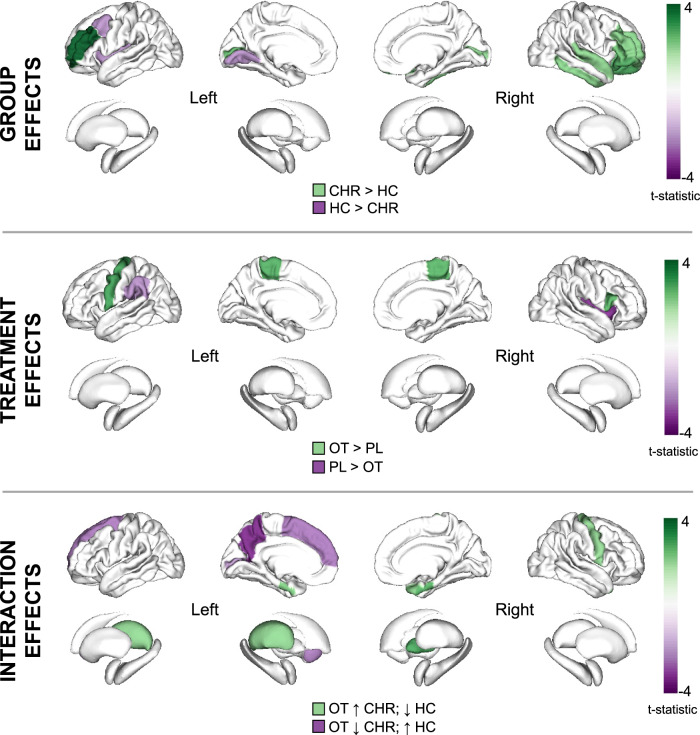
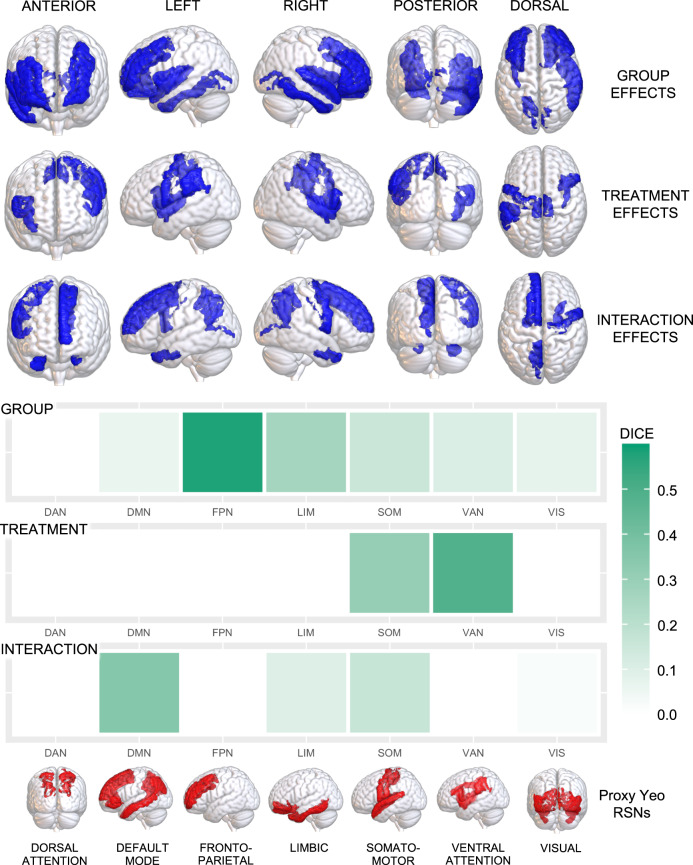
Abnormalities in functional brain networks (functional connectome) are increasingly implicated in people at Clinical High Risk for Psychosis (CHR-P). Intranasal oxytocin, a potential novel treatment for the CHR-P state, modulates network topology in healthy individuals. However, its connectomic effects in people at CHR-P remain unknown. Forty-seven men (30 CHR-P and 17 healthy controls) received acute challenges of both intranasal oxytocin 40 IU and placebo in two parallel randomised, double-blind, placebo-controlled cross-over studies which had similar but not identical designs. Multi-echo resting-state fMRI data was acquired at approximately 1 h post-dosing. Using a graph theoretical approach, the effects of group (CHR-P vs healthy control), treatment (oxytocin vs placebo) and respective interactions were tested on graph metrics describing the topology of the functional connectome. Group effects were observed in 12 regions (all pFDR < 0.05) most localised to the frontoparietal network. Treatment effects were found in 7 regions (all pFDR < 0.05) predominantly within the ventral attention network. Our major finding was that many effects of oxytocin on network topology differ across CHR-P and healthy individuals, with significant interaction effects observed in numerous subcortical regions strongly implicated in psychosis onset, such as the thalamus, pallidum and nucleus accumbens, and cortical regions which localised primarily to the default mode network (12 regions, all pFDR < 0.05). Collectively, our findings provide new insights on aberrant functional brain network organisation associated with psychosis risk and demonstrate, for the first time, that oxytocin modulates network topology in brain regions implicated in the pathophysiology of psychosis in a clinical status (CHR-P vs healthy control) specific manner.
© 2024. The Author(s).
Conflict of interest statement
PFP has received research funds or personal fees from Lundbeck, Angelini, Menarini, Sunovion, Boehringer Ingelheim and Proxymm Science outside of the current study. RAM has received honoraria for educational talks sponsored by Otsuka and Janssen. The authors have declared that there are no conflicts of interest in relation to the subject of this study.
Figures
Similar articles
-
Functional Connectivity in Antipsychotic-Treated and Antipsychotic-Naive Patients With First-Episode Psychosis and Low Risk of Self-harm or Aggression: A Secondary Analysis of a Randomized Clinical Trial.JAMA Psychiatry. 2021 Sep 1;78(9):994-1004. doi: 10.1001/jamapsychiatry.2021.1422. JAMA Psychiatry. 2021. PMID: 34160595 Free PMC article. Clinical Trial.
-
Functional brain networks in clinical high-risk for bipolar disorder and psychosis.Psychiatry Res. 2024 Dec;342:116251. doi: 10.1016/j.psychres.2024.116251. Epub 2024 Oct 28. Psychiatry Res. 2024. PMID: 39488942
-
Oxytocin modulates hippocampal perfusion in people at clinical high risk for psychosis.Neuropsychopharmacology. 2019 Jun;44(7):1300-1309. doi: 10.1038/s41386-018-0311-6. Epub 2019 Jan 9. Neuropsychopharmacology. 2019. PMID: 30626906 Free PMC article. Clinical Trial.
-
Graph theory approach for the structural-functional brain connectome of depression.Prog Neuropsychopharmacol Biol Psychiatry. 2021 Dec 20;111:110401. doi: 10.1016/j.pnpbp.2021.110401. Epub 2021 Jul 12. Prog Neuropsychopharmacol Biol Psychiatry. 2021. PMID: 34265367 Review.
-
Graph Theory and Modeling of Network Topology in Clinical Neurosurgery.Adv Exp Med Biol. 2024;1462:107-122. doi: 10.1007/978-3-031-64892-2_7. Adv Exp Med Biol. 2024. PMID: 39523262 Review.
Cited by
-
The pharmacodynamic modulation effect of oxytocin on resting state functional connectivity network topology.Front Pharmacol. 2025 Jan 6;15:1460513. doi: 10.3389/fphar.2024.1460513. eCollection 2024. Front Pharmacol. 2025. PMID: 39834799 Free PMC article.
-
Functional connectivity of subsystems of the default-mode network in patients with early psychotic symptoms.Neuroimage Rep. 2025 Mar 11;5(1):100248. doi: 10.1016/j.ynirp.2025.100248. eCollection 2025 Mar. Neuroimage Rep. 2025. PMID: 40567890 Free PMC article.
References
-
- Morgan SE, Young J, Patel AX, Whitaker KJ, Scarpazza C, van Amelsvoort T, et al. Functional magnetic resonance imaging connectivity accurately distinguishes cases with psychotic disorders from healthy controls, based on cortical features associated with brain network development. Biol Psychiatry. 2021;6:1125–34. - PubMed
Publication types
MeSH terms
Substances
Grants and funding
- Clinical Lectureship/DH | National Institute for Health Research (NIHR)
- Clinical Research Career Development Fellowship/Wellcome Trust (Wellcome)
- 22593/Brain and Behavior Research Foundation (Brain & Behavior Research Foundation)
- WT_/Wellcome Trust/United Kingdom
- ES/K009400/1/RCUK | Economic and Social Research Council (ESRC)
LinkOut - more resources
Full Text Sources
Medical
