. 2024 Feb;6(2):209-225.
doi: 10.1038/s42255-023-00956-y. Epub 2024 Jan 19.

An ETFDH-driven metabolon supports OXPHOS efficiency in skeletal muscle by regulating coenzyme Q homeostasis

Affiliations

An ETFDH-driven metabolon supports OXPHOS efficiency in skeletal muscle by regulating coenzyme Q homeostasis

Juan Cruz Herrero Martín et al. Nat Metab. 2024 Feb.

Abstract

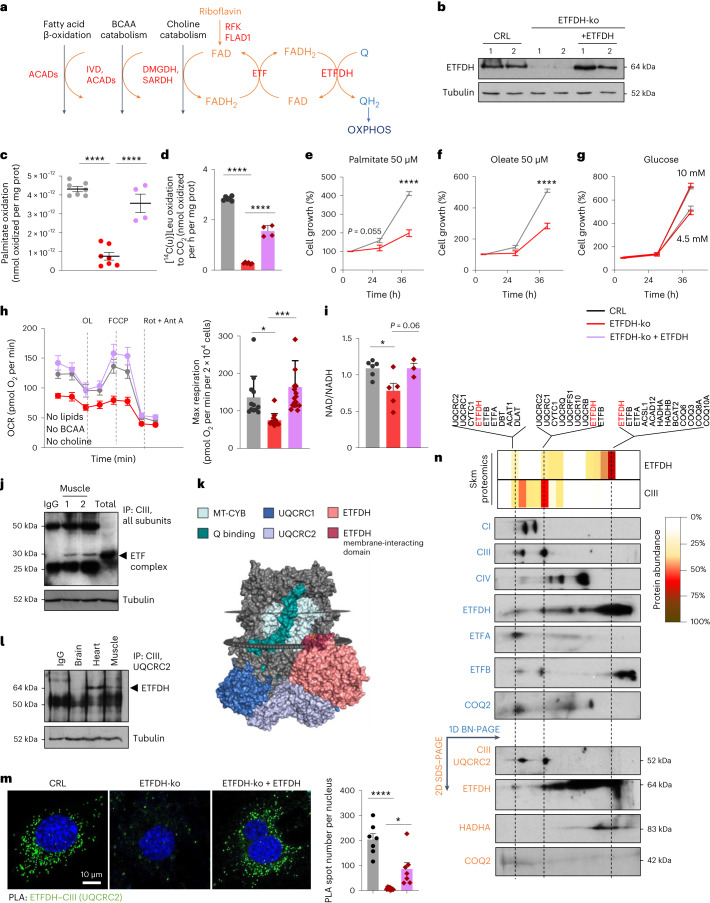
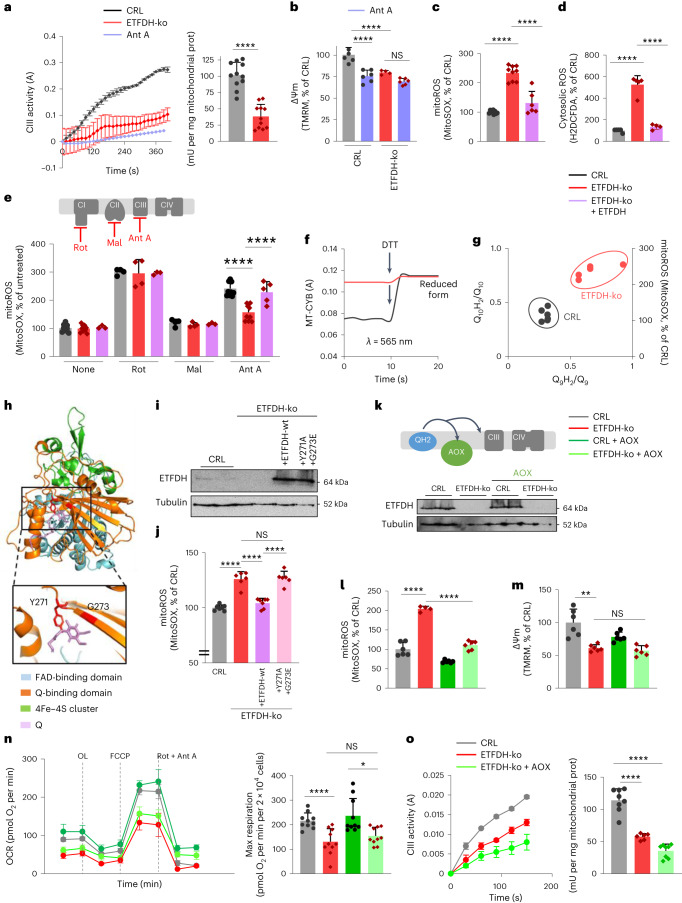
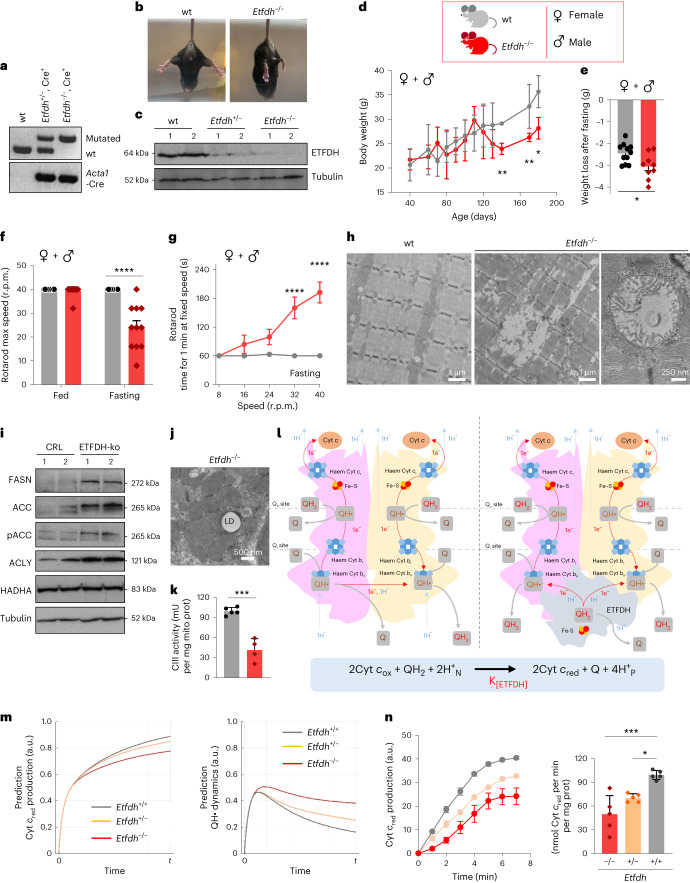
Coenzyme Q (Q) is a key lipid electron transporter, but several aspects of its biosynthesis and redox homeostasis remain undefined. Various flavoproteins reduce ubiquinone (oxidized form of Q) to ubiquinol (QH2); however, in eukaryotes, only oxidative phosphorylation (OXPHOS) complex III (CIII) oxidizes QH2 to Q. The mechanism of action of CIII is still debated. Herein, we show that the Q reductase electron-transfer flavoprotein dehydrogenase (ETFDH) is essential for CIII activity in skeletal muscle. We identify a complex (comprising ETFDH, CIII and the Q-biosynthesis regulator COQ2) that directs electrons from lipid substrates to the respiratory chain, thereby reducing electron leaks and reactive oxygen species production. This metabolon maintains total Q levels, minimizes QH2-reductive stress and improves OXPHOS efficiency. Muscle-specific Etfdh-/- mice develop myopathy due to CIII dysfunction, indicating that ETFDH is a required OXPHOS component and a potential therapeutic target for mitochondrial redox medicine.


Conflict of interest statement

The authors declare no competing interests.

Figures

Fig. 1
Fig. 1. ETFDH–CIII interaction is required for OXPHOS efficiency.
a, Scheme depicting how the iron–sulfur flavoprotein ETFDH canalizes electrons from FAO, BCAA catabolism and choline metabolism to OXPHOS. The FAD (orange) and Q (blue) redox reactions are illustrated, with the proteins of the ETFDH pathway highlighted in red. ACADs, acyl-CoA dehydrogenases; IVD, isovaleryl-CoA dehydrogenase; DMGDH, dimethylglycine dehydrogenase; SARDH, sarcosine dehydrogenase; RFK, riboflavin kinase; FLAD1, FAD synthetase 1. b, Representative western blot of ETFDH protein levels in CRL, ETFDH-ko and cDNA-rescued ETFDH-ko (+ETFDH) myoblasts. Two samples per condition. Tubulin is shown as a loading control. c, FAO fluxes in CRL, ETFDH-ko and cDNA-rescued ETFDH-ko myoblasts. n = 3. d, [14C(u)]leucine (Leu) oxidation to CO2 in myoblasts. n = 4 replicates per condition. eg, Cell growth in CRL and ETFDH-ko myoblasts cultured in substrate-free medium supplemented with palmitate (e), oleate (f) or glucose (g). n = 3, seven replicates per condition. h, Left, representative respiratory profile of CRL (grey trace), ETFDH-ko (red trace) and cDNA-rescued ETFDH-ko (lavender trace) myoblasts. Right, quantification histogram. n = 3. i, NAD/NADH levels in CRL, ETFDH-ko and cDNA-rescued ETFDH-ko myoblasts. n = 3. j, Immunocapture (IP) of all subunits of CIII blotted with anti-ETF antibody (ETFA) in Skm from mouse hindlimb. Tubulin is shown as a loading control. IgG, immunoglobulin G. k, PyMOL representation of a ClusPro docking study for CIII–ETFDH interaction. l, Immunocapture (IP) of UQCRC2 blotted with anti-ETFDH antibody in mouse brain, heart and Skm extracts. Tubulin is shown as a loading control. m, Left, representative images of PLA between CIII (UQCRC2) and ETFDH in CRL, ETFDH-ko and cDNA-rescued ETFDH-ko myoblasts. Right, quantification histogram. Seven images per condition, n = 3. n, Representative 1D BN-PAGE and 2D SDS–PAGE of mitochondrial membrane proteins from wt mice, followed by proteomics. Migration in 1D BN-PAGE of respiratory CI, CIII and CIV; ETF complex subunits ETFDH, ETFA and ETFB; and COQ2 (in blue) are shown. Migration in 2D SDS–PAGE of CIII, ETFDH, the FAO enzyme HADHA, and COQ2 (in orange) are shown. The upper image shows the proteomic analysis of 12 bands from 1D BN-PAGE. White to red scale indicates protein abundance within a band. ETFDH was found to comigrate with CIII in two bands. Results are shown as the mean ± s.e.m. of the indicated n. *, **, ***, ****P < 0.05, 0.01, 0.001 and 0.0001 when compared with CRL by one-way ANOVA with Tukey’s test (c, d, h, i, m) or two-way ANOVA with Šidák’s test (e, f, g). Source data
Fig. 2
Fig. 2. ETFDH participates in the Q cycle.
a, CIII enzymatic activity in isolated mitochondria from CRL and ETFDH-ko myocytes. The left panel shows absorbance (A) changes over time. In the right panel, CIII activity is presented as mU per mg of mitochondrial protein. n = 3. Ant A was used as a CIII inhibitor. b, ΔΨm in CRL and ETFDH-ko myocytes in the presence or absence of 1 µM Ant A. n = 3. ce, Mitochondrial (c, e) and cytosolic (d) ROS in CRL, ETFDH-ko and cDNA-rescued ETFDH-ko (+ETFDH) myoblasts in the presence or absence of Rot, Mal and Ant A. The upper scheme in e illustrates the site of action of each inhibitor. n = 3. mitoROS, mitochondrial ROS. f, Absorbance of Cyt b (λ = 565 ± 5 nm) before and after DTT administration in isolated mitochondria of CRL (black trace) and ETFDH-ko (red trace) myocytes. n = 3. g, Relation between Q10H2/Q10 ratio, Q9H2/Q9 ratio and mitochondrial ROS in CRL and ETFDH-ko myoblasts. n = 3. h, ETFDH structure highlighting two highly conserved amino acids in the Q-binding domain: Y271 and G273. i,j, Representative western blot analysis of ETFDH protein levels (i) and mitochondrial ROS (j) in CRL and ETFDH-ko myoblasts expressing native (ETFDH-wt) or mutated (ETFDH-Y271A,G273E) ETFDH protein. n = 3. k, Schematic of AOX functioning (top) and representative western blot of ETFDH expression (bottom) in CRL and ETFDH-ko cells expressing or not expressing AOX. lo, Mitochondrial ROS (l), ΔΨm (m), respiratory profile (n) and CIII activity (o) in CRL and ETFDH-ko cells expressing or not expressing AOX. n = 3. Results are shown as the mean ± s.e.m. of the indicated n. NS, not significant. *, **, ***, ****P < 0.05, 0.01, 0.001 and 0.0001 when compared with CRL by two-tailed Student’s t test (a), one-way ANOVA with Tukey’s test (c, d, j, lo), and two-way ANOVA with Šidák’s test (b) or Tukey’s test (e). Source data
Fig. 3
Fig. 3. Senescence, aberrant myogenesis and Q deficiency are associated with ETFDH deletion.
a,b, Lactate production (a) and energy map (b) in CRL and ETFDH-ko myoblasts. n = 4. c, PI staining of the cell cycle in CRL and ETFDH-ko myoblasts. n = 3 independent repeats. Cell percentages in the G1, S and G2/M phases are indicated. d, Representative western blot of proteins related to the cell cycle and senescence in two clones of CRL and ETFDH-ko myoblasts. β-Actin is shown as a loading control. e, RNA relative expression of cyclins, CDKs and other proteins related to the cell cycle in CRL and ETFDH-ko myoblasts. The upper scheme illustrates Skm cell-cycle regulators. n = 3. f, RNA relative expression of proteins related to myogenesis (MyoD, Myf5, MyoG, MyHC1 and MyHC7) in CRL and ETFDH-ko myoblasts and myocytes. n = 3. g, PI staining of the cell cycle in CRL and patient-derived fibroblasts. n = 4, three independent repeats. h, Relation between total Q10 and mitochondrial ROS in CRL and patient-derived fibroblasts. n = 4, three independent repeats. i, Representative immunocapture (IP) of COQ2 blotted with anti-ETFDH antibody in mouse Skm. Tubulin is shown as a loading control. j, Left, representative images of PLA between COQ2 and ETFDH in CRL and ETFDH-ko myoblasts. Right, quantification histogram. Five images per condition, n = 3. k, Mitochondrial ROS in the presence or absence of the COQ2 inhibitor 4-CBA in ETFDH-ko and double-knockout (COQ2-ko, ETFDH-ko) cells. n = 3. l, Left, representative respiratory profile of CRL (grey traces) and ETFDH-ko (red traces) myocytes treated or not with 0.5 mM 4-CBA. Glucose was used as a substrate. Right, histogram of the quantification of maximal respiration. n = 8 replicates per condition. Results are shown as the mean ± s.e.m. of the indicated n. *, **, ***, ****P < 0.05, 0.01, 0.001 and 0.0001 when compared with CRL by two-tailed Student’s t test (a, j), one-way ANOVA with Dunnett’s test (k) and two-way ANOVA with Šidák’s test (f, l). Source data
Fig. 4
Fig. 4. A conditional and Skm-specific Etfdh−/− mouse with inhibited CIII activity.
a, PCR analysis of the native and mutant Etfdh and Acta1-rtTA-Cre constructs in Skm from wt, heterozygous Etfdh+/− and homozygous Etfdh−/− mice. b, Representative images of wt (left) and Etfdh−/− (right) mice. c, Western blot analysis of ETFDH protein levels in Skm from wt, Etfdh+/− and Etfdh−/− mice. d,e, Body weight over time (d) and weight loss after fasting (150-day-old mice) (e) in wt and Etfdh−/− mice. n = 11 mice per genotype. f,g, Motor behaviour assays in male + female mice: rotarod maximum speed (f) and time for 1 min at a fixed number of rotations per minute (r.p.m.) (g) in fed and fasting 6-month-old wt and Etfdh−/− mice. n = 11 animals per genotype (six females and five males). Individual analysis for male and female mice are shown in Extended Data Fig. 8. h, TEM images of longitudinal soleus slices from wt and Etfdh−/− mice. Extended sarcomere disorganization and debris were observed following ETFDH deletion. Mitochondria appeared aberrant, empty and with cristae disorganization. Images are representative of n = 5 mice per genotype. Ten images per mouse. i, Representative western blot expression of Skm proteins from de novo lipogenesis in CRL and ETFDH-ko myoblasts. The expression of ATP citrate lyase (ACLY), acetyl-CoA carboxylase (ACC) and its phosphorylated form (pACC), and FA synthase (FASN) is shown. The expression of the hydroxyacyl-CoA dehydrogenase trifunctional multienzyme HADHA is also shown. Two samples per condition; each sample contains protein extracts from three mice. Tubulin is shown as a loading control. n = 6 mice per genotype. j, TEM images of longitudinal soleus slices from Etfdh−/− mice. Intrafibre lipid droplet (LD) surrounded by mitochondria in the subsarcolemma is shown. Image is representative of n = 5 mice per genotype. Ten images per mouse. k, CIII enzymatic activity in isolated Skm mitochondria from wt and Etfdh−/− mice. n = 3 mice per genotype. l, Current (left) and new version (right) of the Q cycle. The proposed new version involves ETFDH and is composed of two steps. Step 1: as in the current theory, a QH2 molecule in each monomer enters the cycle and is reduced to Q; one electron is donated to the high-potential chain in the ISP–Cyt c1–Cyt c axis, and the other electron proceeds in a bifurcated reaction through Cyt bH and Cyt bL and is donated to one Q molecule, forming the radical QH•. This electron gradient is accompanied by the uptake of one H+N from the matrix and the extrusion of two H+P to the IMM. The stoichiometry of the reaction for the two monomers is Cytox + QH2 + Q + 2H+N → Cytred + Q + QH• + 4H+P. Step 2: the second electron is directly donated by ETFDH in two one-electron and one-H+ reactions, reducing two molecules of QH• to QH2 and liberating one molecule of Q. The stoichiometry of this reaction is QH2 + 2QH• + ETFDHFADH2 → Q + 2QH2 + ETFDHFAD+. Therefore, the total stoichiometry is the same as in the current Q cycle, but with the participation of ETFDH: 2Cyt cox + 3QH2 + 2Q + ETFDHFADH2 + 2H+N → 2Cyt cred + 3Q + 2QH2 + ETFDHFAD+ + 4H+P = 2Cyt cox + QH2 + ETFDHFADH2 + 2H+N → 2Cyt cred + Q + ETFDHFAD+ + 4H+P = 2Cyt cox + QH2 + 2H+N → 2Cyt cred + Q + 4H+P. The observation that CIII retains 50% of its activity following ETFDH deletion indicates that CIII can function autonomously, consistent with previous theories. However, this new version proposes a lower QH• standby time, minimizing electron leak and consequent ROS production, thus increasing OXPHOS efficiency. Details are provided in Extended Data Fig. 9. m, Mathematical simulations of the Q cycle using the equations in Extended Data Fig. 9. ODEs describe the dynamics of Cyt c (left) and Q (right) over time in Etfdh+/+, Etfdh+/− and Etfdh−/− conditions, highlighting higher efficiency of CIII in the presence of ETFDH. Details are provided in Extended Data Fig. 10. n, Cyt cred production over time in isolated Skm mitochondria from wt, Etfdh+/− and Etfdh−/− mice. Absorbance (a.u) over time (left) and nmol of product per min per mg of protein (right). n = 3 mice per genotype. Results are shown as the mean ± s.e.m. of the indicated n. *, **, ***, ****P < 0.05, 0.01, 0.001 and 0.0001 when compared with wt by two-tailed Student’s t test (d, e, k), one-way ANOVA with Tukey’s test (n) and two-way ANOVA with Šidák’s test (f, g). Source data
Extended Data Fig. 1
Extended Data Fig. 1. The absence of ETFDH impairs oxygen consumption.
a) Representative western blot of ETFDH in 2 clones of control (CRL) and ETFDH-ko myocytes. Tubulin as loading control. b, e) Representative respiratory profile using palmitate (b) or glucose (e) as a substrate. OCR, oxygen consumption rate; OL, oligomycin; Rot, rotenone; Ant, antimycin A. Analysis in the right histograms. n = 3. c) FFA β-oxidation fluxes in control (CRL) and ETFDH-ko myocytes in the presence or absence of 1 mM carnitine. n = 3. d) 14 C(u)-leucine oxidation to CO2 in myocytes expressing or not ETFDH. n = 3 experiments, 6 replicates/condition. f, g) Basal and oligomycin-sensitive respiration in control (CRL), ETFDH-ko and cDNA-rescued ETFDH-ko (+ETFDH) myoblasts, corresponding to Fig. 1h. h) Representative western blot expression of proteins related to mitochondrial OXPHOS and dynamics. Subunits NDUFA9 (CI), SDHA and SDHB (CII), ETFB and ETFDH (ETF complex), UQCRC2 (CIII), COX IV (CIV), β-F1 ATPase and IF1 (CV) are shown. Mitofusins I and II (MFN1), OPA1-Mitochondrial Dynamin Like GTPase (OPA1) and Dynamin 1 Like (DRP1) are also shown. Two samples per condition. Tubulin as loading controls. 6 replicates, n = 3. i) Representative BNPAGE of mitochondria from CRL and ETFDH-ko myocytes. The migration of the respiratory complexes/supercomplexes CI-V is indicated. ETFDH was observed to comigrate with CI + CIII. VDAC is shown as a loading control. j) Immunocapture (IP) of all subunits of CI blotted with anti-ETF antibody (ETFA) in Skm from mouse hindlimb. Tubulin as loading control. k) Pymol representation of ClusPro docking study for CIII-ETFDH interaction. l) Immunocapture (IP) of UQCRC2 blotted with anti-ETFDH antibody in Skm extracts from mouse hindlimb. In the lower panel, the graph shows the number of tryptic peptides (effective NOP) plotted against the proteomic normalized abundance of each protein in the CIII and ETF complexes within the IP sample. The stoichiometry of ETFDH-CIII complexes is estimated as the ratio of the slopes. Results are shown as the mean ± SEM of the indicated n. *, **, ***, **** p < 0.05; 0.01, 0.001 and 0.0001 when compared to CRL by two-tailed Student’s t-test (b, d, e), one-way ANOVA with Tukey’s test (f, g), and two-way ANOVA with Sidak’s test (c). Source data
Extended Data Fig. 2
Extended Data Fig. 2. Disruption of the ETFDH-CIII metabolon leads to ROS and QH2 accumulation.
a, b) Representative 1D-BNPAGE/2D-SDS-PAGE of mitochondrial membrane proteins from wt and Etfdh-/- mice. Migration in 1D-BN-PAGE of respiratory CI, CIII (in blue) and in 2D-SDS-PAGE of CIII and ETFDH (in red) are shown. ETFDH was found to comigrate with CIII. c) 2D-PAGE IEF gels of CRL and ETFDH-ko myocyte extracts. The isoelectric point (pI) of the CIII subunit UQCRC2 was calculated by protein migration in pH 3–10 NL strips. d) CI, CII and CIV enzymatic activity in isolated mitochondria from control (CRL) and ETFDH-ko myocytes. n = 3. Rotenone, carboxin and CN- were used as control for calculating specific CI, CII and CIV activity, respectively. e) Mitochondrial membrane potential ΔΨm in control (CRL), ETFDH-ko and cDNA-rescued ETFDH-ko (+ETFDH) myoblasts. n = 3. f) NADPH/NADP levels in control (CRL) and ETFDH-ko myoblasts. n = 3. g–i) Mitochondrial ROS in control (CRL) and ETFDH-ko myocytes, in the presence or absence of CIII inhibitors antimycin A (Ant-A) and myxothiazole (Myx) (g) or CI inhibitors piericidin A and rotenone (h). The upper scheme in g illustrates the site of action of each inhibitor; the one in h the RET mechanism of action. In i, myocytes were treated with etomoxir (no FAO), glycine (no choline catabolism) or grown in no-BCAA media (no BCAA catabolism). n = 3. j) Left panel. Representative western blot of proteins related to ETF complex, ETFA, ETFB, ETFDH in 2 clones of control (CRL) and triple ETFA-ko, ETFB-ko, ETFDH-ko myoblasts. Tubulin as loading control. Right panel. Mitochondrial ROS in control (CRL) and ETFDH-ko, ETFA-ko and triple ETFA-ko, ETFB-ko, ETFDH-ko myocytes. n = 3. k) Q9H2 and Q10H2 levels in control (CRL) and ETFDH-ko myoblasts. n = 3. l) Mitochondrial ROS in control (CRL) and ETFDH-ko cells treated or not with the reduced form of MitoQ (MitoQH2, 20 nM). n = 3. Results are shown as the mean ± SEM of the indicated n. *, **, ***, **** p < 0.05; 0.01, 0.001 and 0.0001 when compared to CRL or wt by two-tailed Student’s t-test (d, f, k), one-way ANOVA with Tukey’s test (e, j) or with Sidak’s test (l), and two-way ANOVA with Sidak’s test (g-i). Source data
Extended Data Fig. 3
Extended Data Fig. 3. ETFDH 3D-structure and domains.
Fe/S cluster, FAD-binding and Q-binding domains are shown in different colours. ETFDH’s biophysical parameters are also shown (InterProSurf, http://curie.utmb.edu/; see (Negi et al., Bioinformatics, 23, 3397-3399, 2007). In the lower panel, ETFDH sequence alignment across species (Clustal Omega, EMBL-EBI). Note that Y271 and G273 (in yellow) are conserved across almost all species analysed.
Extended Data Fig. 4
Extended Data Fig. 4. An efficient ETFDH protein is essential for optimal CIII and OXPHOS activities.
a) Pymol representation of Q-binding site in ETFDHwt and ETFDHY271A,G273E proteins. b) Missense-3D structure of native (Y271, G273) and mutated (Y271A and G273E) ETFDH. UniProt ID: Q16134. PDB code: 2gmh. PDB chain ID: A. The Y304A substitution (Y271A in PDB) does not trigger MolProbity clash alert. The local clash score for wild type is 47.24 and the local clash score for mutant is 45.34. This substitution does not alter the secondary structure, nor trigger disallowed phi/psi alert. However, the Y271A substitution leads to the expansion of Q-binding cavity volume by 133.488 Å^3. The G306E substitution (G273E in PDB) does not trigger MolProbity clash alert. The local clash score for wild type is 46.92 and the local clash score for mutant is 54.06. This substitution does not alter the secondary structure (extended strand in parallel and/or anti-parallel β-sheet conformation), nor trigger disallowed phi/psi alert. However, the G273E substitution leads to the contraction of Q-binding cavity volume by 58.968 Å^3. c, d) Mitochondrial ROS (c) and basal respiration (d) in control (CRL) and ETFDHY271A,G273E CRL myoblasts. n = 3. e) Immunofluorescence from ETFDH-ko myoblasts expressing ETFDHY271A,G273E. Red, ETFDH; blue, nuclei: DAPI; Images are representative of 10 pictures/condition. f, g) Representative respiratory profile of control (CRL, gray trace), ETFDH-ko (red traces), wt expressing AOX (dark green traces) and ETFDH-ko expressing AOX (light green traces) cells, using glucose (f) or palmitate (g) as a substrate. OCR, oxygen consumption rate; OL, oligomycin; FCCP, carbonyl cyanide 4-(trifluoromethoxy)phenylhydrazone; Rot, rotenone; Ant, antimycin A. Analysis in the right histograms. 10 and 24 replicates/condition, n = 3. Results are shown as the mean ± SEM of the indicated n. *, **, ***, **** p < 0.05; 0.01, 0.001 and 0.0001 when compared to CRL by two-tailed Student’s t-test (c, d), and one-way ANOVA with Tukey’s test (f, g). Source data
Extended Data Fig. 5
Extended Data Fig. 5. Quantitative proteomics in wt, Ant A-treated and ETFDH-ko myocytes.
a) RNA relative expression of other IMM-flavoproteins in ETFDH-ko myoblasts compared to CRL. Results are shown as the mean ± SEM of 3 independent experiments. b, c) Quantitative proteomic analysis (TMT) of CRL and ETFDH-ko myocytes. Volcano plot (b) and heat-map (c) heat-map. A t-tests to compare groups in a pairwise fashion was used. A (-) log2 p-value > 4 was considered statistically significant. A 3-color palette was used: white, non-significance; progressively more saturated values of blue and red indicate increased significance. Blue and red also means downregulated or upregulated protein, respectively. d) Bioinformatic analysis of TMT proteomics included a dot chart displaying the Normalized Enrichment Score (NES) for 15 perturbed pathways, as determined through GSEA bioinformatics analysis. In this chart, dot color and size respectively denote NOM-p-values (nominal p-value) and the number of altered proteins within each pathway. As per the GSEA program output, for statistics, we used the NES value, representing the normalized enrichment score for the gene set across the analyzed gene sets, and the NOM p-value, which represents the statistical significance of the enrichment score as a measure of pathway enrichment. The nominal p-value is not adjusted for gene set size or multiple hypothesis testing; therefore, we introduced a third variable to account for the size (diameter of the circle) of the gene set. e) CIII enzymatic activity in isolated mitochondria from control (CRL) and other IMM-flavoprotein-ko myocytes (DLD, PRODH and DHODH). Antimycin A was used as control for calculating specific activity. Results are shown as the mean ± SEM of 3 independent experiments. f, g) Quantitative proteomic analysis (TMT) of ETFDH-ko and Antimycin A-treated CRL myocytes. Heat-map representation of overexpressed (red) and downregulated (blue) proteins. A (-) log2 p-value > 4 was considered statistically significant. Statistics compared to CRL by one-way ANOVA with Dunnett’s test (e). Source data
Extended Data Fig. 6
Extended Data Fig. 6. A metabolon comprising ETFDH, CIII, and the regulator of Q biosynthesis, COQ2.
a) Total Q10 levels in control (CRL) and patient-derived fibroblasts (M2, M3, M4, M9). n = 3. b) Left panel, schematic represents Q biosynthesis. Right panel, heat-map representation of quantitative proteomic analysis (TMT) of CRL and ETFDH-ko myoblasts. A t-tests to compare groups in a pairwise fashion was used. A (-) log2 p-value > 4 was considered statistically significant. A 3-color palette was used: white, non-significance; progressively more saturated values of blue and red indicate increased significance. Blue and red also means downregulated or upregulated protein, respectively. c) Immunocapture (IP) of COQ2 blotted with anti-UQCRC2 and ETFDH antibodies; and IP of UQCRC2 blotted with anti-ETFDH and anti-COQ2 antibodies in Skm extracts. P.C. Positive control (total extract). In the square, common interactors in the proteomic analysis of the 4 IPs. Graphs in lower panel represents the number of tryptic peptides (NOP) plotted against the number of PSM of each protein. The stoichiometry of ETFDH-CIII is estimated by plotting the observed PSM per protein from each complex against their effective NOP; the stoichiometry between the two complexes is estimated as the ratio of the slopes from each one of them. d) Proximity ligation assay (PLA) between ETFDH-UQCRC2, ETFDH-COQ2 and UQCRC2-COQ2 in control (CRL) and ETFDH-ko myoblasts. Quantification in right histograms. 5 images/condition, n = 3. Results are shown as the mean ± SEM of the indicated n. *, **, ***, **** p < 0.05; 0.01, 0.001 and 0.0001 when compared to CRL by two-tailed Student’s t-test (d) and one-way ANOVA with Dunnett’s test (a). Source data
Extended Data Fig. 7
Extended Data Fig. 7. Reducing Q levels as a strategy to counteract reductive stress resulting from dysfunctional ETFDH.
a) Left panel, schematic represents the metabolon. Right panel, proteomic analysis of 26 bands from 1D-BN-PAGE immunoblots of mitochondrial membrane proteins from wt mouse hearts and wt, Mt-Cyb-/- and ρ0 mouse fibroblasts. White to brown scale indicates the abundance of the protein within a band. ETFDH was found to comigrate with CIII and COQ2 within the band 13 in basal conditions. b) Mitochondrial ROS in the presence or absence of riboflavin (rib) in control (CRL) and patient-derived fibroblasts (M2, M3, M4, M9). n = 3. c) Mitochondrial ROS in the presence or absence of the COQ2 inhibitor 4-CBA in control (CRL), ETFDH-ko and double COQ2-ko, ETFDH-ko myoblasts. n = 3. d) Representative respiratory profile of control (CRL, gray traces) myoblasts treated or not with different doses of 4-CBA. OCR, oxygen consumption rate; OL, oligomycin; FCCP; Rot, rotenone; Ant, antimycin A. Glucose was used as a substrate. 10 replicates/condition. e, f) Total Q9 levels in control in wt and ETFDH-ko myoblasts treated or not with 4-CBA. n = 3. g) Q9H2/Q9 ratio in control in wt and ETFDH-ko myoblasts treated or not with 4-CBA. n = 3. Results are shown as the mean ± SEM of the indicated n. *, **, ***, **** p < 0.05; 0.01, 0.001 and 0.0001 when compared to CRL by two-tailed Student’s t-test (b, e, f), one-way ANOVA with Tukey’s test (g), and two-way ANOVA with Dunnett’s test (c). Source data
Extended Data Fig. 8
Extended Data Fig. 8. Female and male Etfdh-/- mice display myopathy.
a) Representative western blot analysis of ETFDH protein levels in Skm, brain and heart from wt and Etfdh -/- mice. ETFDH is absent specifically in muscle. b) Weight loss after fasting (150 days old mice) of wild-type (wt) in male and female Etfdh-/- mice. n = 10 mice/genotype. c–g) Motor behavior assays in female (♀) and male (♂) mice. RotaRod max speed (c), time for 1 min at fixed rpm (d) time for 1 min at 32 rpm (e) and number of attempts to achieve 1 min at fixed speed (f) in 6 months-old wt and Etfdh -/- mice. In g, 2 limb hanging test in 6 months-old wt and Etfdh -/- mice. n = 11 animals/genotype (6 females and 5 males). h) Immunofluorescence from wt and ETFDH-ko myoblasts. Red, mitochondria: β-F1-ATPase; blue, nuclei: DAPI; green, lipid droplets: bodipy. Images are representative of 10 pictures/condition. Results are shown as the mean ± SEM of the indicated n. *, **, ***, **** p < 0.05; 0.01, 0.001 and 0.0001 when compared to wt by two-tailed Student’s t-test (b, g), and two-way ANOVA with Sidak’s test (c-f). Source data
Extended Data Fig. 9
Extended Data Fig. 9. A revised version of the Q cycle involving ETFDH.
Current (left panel) and new version (right panel) of the Q cycle. Despite the total stoichiometry is the same than in the current Q cycle, this new version proposes a lower QH• standby time, minimizing electron leak and consequent ROS production, thus increasing OXPHOS efficiency.
Extended Data Fig. 10
Extended Data Fig. 10. Numerical simulations of the equations in Extended Data Fig.9.
The ordinary differential equations (ODEs) describe the dynamics of each of the reactants involved. Kinetic parameter values for the interactions are tuned to ensure changes in the variables during the simulation, and obtain a response that resembles qualitatively the experiments. The results obtained are robust to moderate changes in the values of the kinetic constants chosen. Graphs represent the Cyt c and Q redox dynamics during time in Etfdh+/+, Etfdh +/- and Etfdh -/- conditions.

References

    1. Vercellino I, Sazanov LA. The assembly, regulation and function of the mitochondrial respiratory chain. Nat. Rev. Mol. Cell Biol. 2022;23:141–161. doi: 10.1038/s41580-021-00415-0. - DOI - PubMed
    1. Spinelli JB, Haigis MC. The multifaceted contributions of mitochondria to cellular metabolism. Nat. Cell Biol. 2018;20:745–754. doi: 10.1038/s41556-018-0124-1. - DOI - PMC - PubMed
    1. Banerjee R, Purhonen J, Kallijarvi J. The mitochondrial coenzyme Q junction and complex III: biochemistry and pathophysiology. FEBS J. 2022;289:6936–6958. doi: 10.1111/febs.16164. - DOI - PubMed
    1. Alcazar-Fabra M, Navas P, Brea-Calvo G. Coenzyme Q biosynthesis and its role in the respiratory chain structure. Biochim. Biophys. Acta. 2016;1857:1073–1078. doi: 10.1016/j.bbabio.2016.03.010. - DOI - PubMed
    1. Crofts AR. The modified Q-cycle: a look back at its development and forward to a functional model. Biochim. Biophys. Acta Bioenerg. 2021;1862:148417. doi: 10.1016/j.bbabio.2021.148417. - DOI - PubMed