. 2024 Feb;25(2):616-645.
doi: 10.1038/s44319-023-00054-w. Epub 2024 Jan 19.

Pericytes contribute to pulmonary vascular remodeling via HIF2α signaling

Affiliations

Pericytes contribute to pulmonary vascular remodeling via HIF2α signaling

Hyunbum Kim et al. EMBO Rep. 2024 Feb.

Abstract

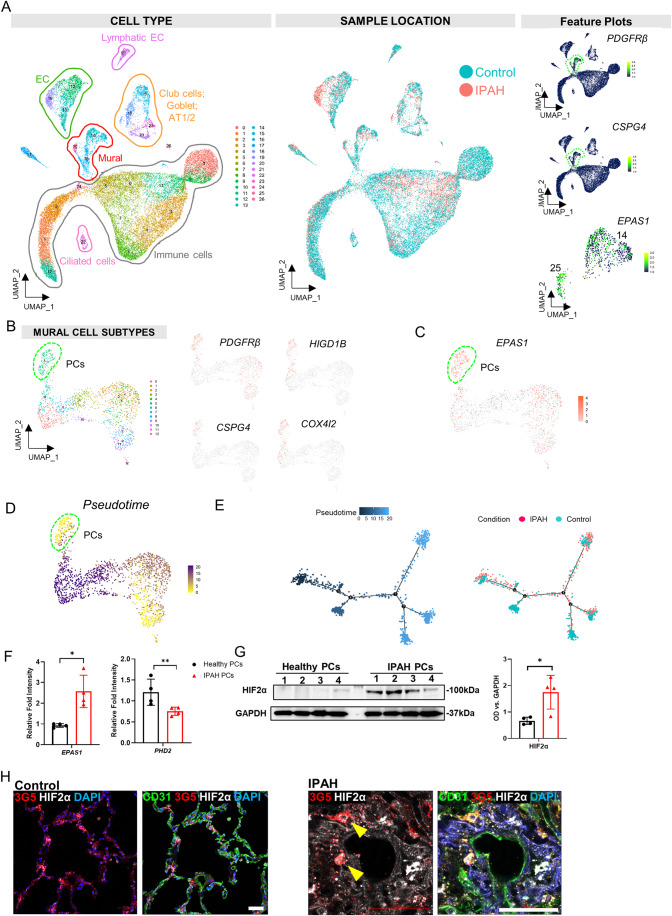
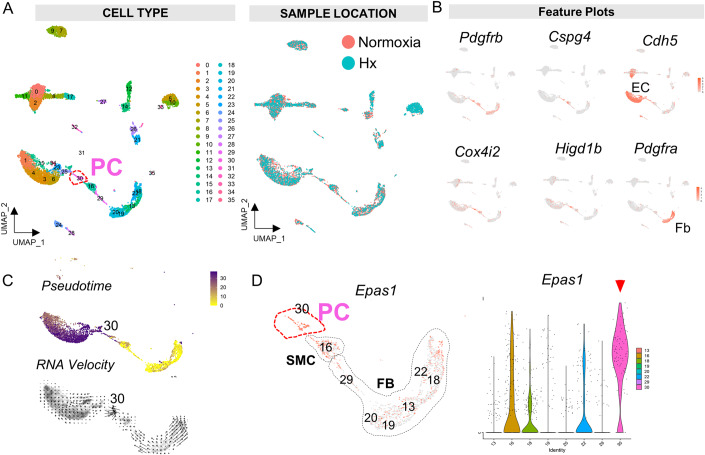
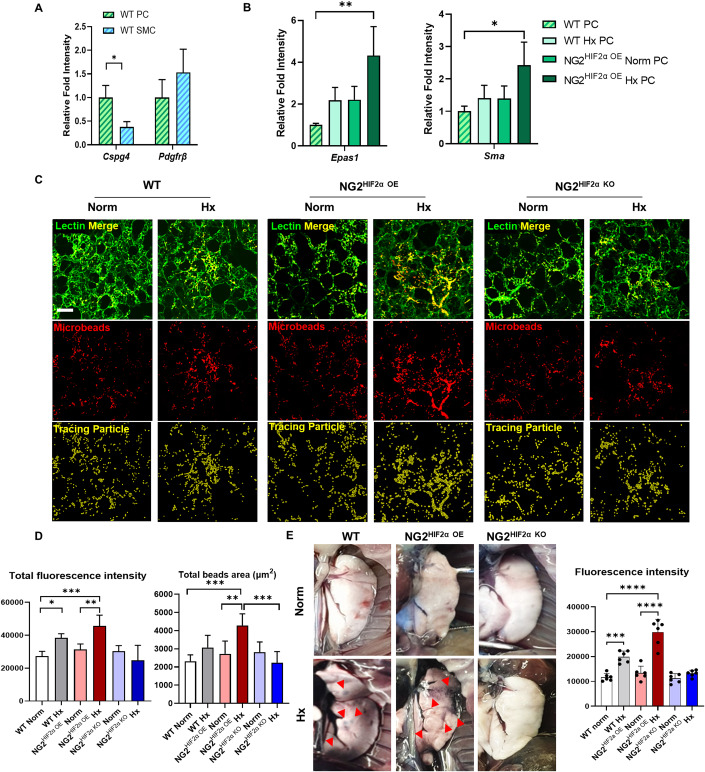
Vascular remodeling is the process of structural alteration and cell rearrangement of blood vessels in response to injury and is the cause of many of the world's most afflicted cardiovascular conditions, including pulmonary arterial hypertension (PAH). Many studies have focused on the effects of vascular endothelial cells and smooth muscle cells (SMCs) during vascular remodeling, but pericytes, an indispensable cell population residing largely in capillaries, are ignored in this maladaptive process. Here, we report that hypoxia-inducible factor 2α (HIF2α) expression is increased in the lung tissues of PAH patients, and HIF2α overexpressed pericytes result in greater contractility and an impaired endothelial-pericyte interaction. Using single-cell RNAseq and hypoxia-induced pulmonary hypertension (PH) models, we show that HIF2α is a major molecular regulator for the transformation of pericytes into SMC-like cells. Pericyte-selective HIF2α overexpression in mice exacerbates PH and right ventricular hypertrophy. Temporal cellular lineage tracing shows that HIF2α overexpressing reporter NG2+ cells (pericyte-selective) relocate from capillaries to arterioles and co-express SMA. This novel insight into the crucial role of NG2+ pericytes in pulmonary vascular remodeling via HIF2α signaling suggests a potential drug target for PH.

Keywords: HIF2α; Pericyte; Pulmonary Hypertension; Vascular Remodeling.


Conflict of interest statement

The authors declare no competing interests.

Figures

Figure 1
Figure 1. HIF2α is upregulated in human IPAH lung pericytes and PAH lung samples.
(A) 27 distinct cell clusters were generated using a Uniform Manifold Approximation and Projection (UMAP) plot from both human control and IPAH lungs by single-cell RNA-sequencing analysis. Each color represents a different cell cluster and sample. Expression profiles of CSPG4 and PDGFRβ in all generated clusters and their expression were identified in annotated mural cell clusters #14/16/25. Expression profile of EPAS1 was showed in zoom-in clusters. (B) Mural cell subtypes were re-clustered from cluster 14/16/25. Sub-cluster 5 was enriched with expression profiles of PDGFRβ, CSPG4, HIGD1B and COX4I2 and designated as pericyte cluster. (C) EPAS1 was highly expression in sub-cluster 5 by the green dash line. (D, E) Pseudotime plot shows sub-cluster 5 has immature lineage and additional pseudotime plots of cluster 14/16/25 show control and IPAH mural cell trajectories. (F, G) (F) mRNA levels of EPAS1, PHD2 by qPCR, and (G) the protein levels of HIF2α by western blot in control (n = 4) and IPAH patient lung pericytes (n = 4) were measured. All experiments were repeated at least three biological replicates. Means ± SEM was derived from at least three biological replicates. *depicts a statistically significant difference: *P < 0.05, and **P < 0.01 (paired t test with parametric test). (H) Immunofluorescence staining on control (n = 5) and IPAH patient lung tissues (n = 5) using HIF2α (white), 3G5 (red), CD31 (green), and nuclei were stained by DAPI (blue). Arrows indicate the colocalization of 3G5 with HIF2α. Scale bar = 50 µm. Data information: means ± SEM was derived from at least six biological replicates. At least four different fields from each condition were counted. *Depicts a statistically significant difference: *P < 0.05 and **P < 0.01 (one-way ANOVA with Turkey’s multiple comparisons test). Source data are available online for this figure.
Figure 2
Figure 2. Human lung pericytes overexpressing HIF2α transform into SMC-like cells.
(A) The mRNA expression levels of EPAS1 and the protein expression levels of HIF2α in human pericytes with/without HIF2α overexpression (OE) under hypoxia or normoxia were measured using qPCR and western blot (WB). (B) Representative images show the polarity of PC (top) and PC HIF2α OE (bottom) by the wound-healing assay. The white lines indicate 0 hr. Red dash boxes were enlarged and shown on the right. Cell polarity was assessed by Pericentrin (the yellow section in the circle at the bottom right of each panel indicates the area of polarized cell direction). The arrowheads indicate directions of cell movement by the alignment of MTOC and the cell nucleus. The number of polarized cells was quantified in the graph on the right. The color legends were the same as A. Scale bar = 50 µm. (C) Immunofluorescence (IF) images of normoxia (top) and hypoxia (bottom) of PC and PC HIF2α OE stained by HIF2α (left, green), SM22 (middle, green), and Calponin (right, red). Nuclei were stained with DAPI (blue). The fluorescence intensity of SM22 and the number of calponin-expressing cells over the total number of DAPI-positive cells were quantified and compared between groups. Scale bar = 50 µm. (D) Pericytes with/without HIF2α overexpression were cocultured with ECs on Matrigel. Yellow arrows indicate PC overage on EC tubes. White arrows indicate reduced cell–cell interaction. Scale bar = 100 µm. The number of total loops and total tube length were quantified below. (E) The representative images show the sizes of the collagen gels of PC or PC HIF2α OE with or without Hx. The dashed lines represent the size of the collagen gel after 48 h. The gel coverage area was quantified by ImageJ. Data information: Means ± SEM was derived from at least six biological replicates. At least six different fields from each condition were counted. *, # Depicts a statistically significant difference: *P < 0.05, **P < 0.01, ***P < 0.001, and ****P < 0.0001 (one-way ANOVA with Turkey’s multiple comparisons test). #P < 0.05 (unpaired t test). Source data are available online for this figure.
Figure 3
Figure 3. Murine pericytes show increased expression levels of Epas1 after hypoxia-induced PH lungs.
(A) 36 distinct cell clusters were generated using UMAP plots from normoxia vs hypoxia lungs by scRNA-seq. (B) The UMAP plot of whole lung cells underwent hypoxia vs normoxia, and cluster 30 was identified as pericyte cluster. The feature gene plots to distinguish different mural cell population including pericytes/SMCs/fibroblasts. The Feature plots identified clusters of PCs (Pdgfrb, Cspg4, Cox4i2 &Higd1b), ECs(Cdh5) & fibroblasts(Pdgfra). (B) Clusters of ECs and mural cells as mesenchymal clusters from (A) were enlarged. (C) Pseudotime analysis shows PCs (cluster 30) have a mixture of early (yellow) and late lineages (purple). RNA Velocity shows PCs are prone to have active lineage change (long arrows). (D) The gene expression level of Epas1 is shown in different mural clusters. Violin plot shows the gene expression level of Epas1 in the defined clusters and is the highest in cluster 30 (red arrow).
Figure 4
Figure 4. HIF2α overexpression in PC-dominant transgenic mice develop severe vascular remodeling and muscularization.
(A) Diagrams show the construction design of the transgenic NG2HIF2α OE and NG2HIF2α KO mice. (B) Representative light-sheet microscopic images from iDISCO-cleared lung lobes, showing 3D views of SMA-labeled lobes of WT, NG2HIF2α OE, and NG2HIF2α KO mice exposed to normoxia vs hypoxia. Scale bar = 1 mm. SMA indicates the mural cell coverage elongated the distal vessels after Hx. All experiments were repeated at least four biological replicates. (C) Schematic overview of the HIF2α signaling pathway in normoxia vs hypoxia. (D) Precision-cut lung slices of WT, NG2HIF2α OE, and NG2HIF2α KO mice with normoxia vs hypoxia were stained for CD31 (green), HIF2α (red), and SMA (magenta). Nuclei were stained with DAPI (blue). Scale bar = 50 µm. All experiments were repeated at least six biological replicates. (E) Schematic images represent a visual definition of none, partially, and full muscularization in the cross-section of vessels. The graph represents the quantification of the percentage of muscularized vessels over the total number of vessels in each group. Each condition contained 120 vessels (diameter = 50 µm) from ten mice. Means ± SEM was derived from at least three biological replicates. (F) The graph shows the measurements of the vessel wall thickness of each group using H&E staining (see Suppl Fig. 9). Each group contained 120 vessels (30 µm < diameter <100 µm) from six mice. Each vessel was measured in four different thickness areas (by measuring the outer wall boundary minus the inner wall boundary) to calculate the average thickness. Data information: Means ± SEM was derived from at least three biological replicates. *Depicts a statistically significant difference: **P < 0.01 and ***P < 0.001 (one-way ANOVA with Turkey’s multiple comparisons test). Source data are available online for this figure.
Figure 5
Figure 5. HIF2α overexpression in PC-dominant transgenic mice develop vascular leakage.
(A) mRNA levels of Cspg4 and Pdgfrβ were measured in CD140b+ (PC-dominant) and CD146+ (SMC-dominant) cells isolated from WT mice. (B) mRNA expression levels of Epas1 and Sma were measured in CD140b+ (PC-dominant) cells isolated from WT and NG2HIF2αOE mice under normoxia or hypoxia. (C, D) Vascular integrity was evaluated in each group using lectin/microsphere bead injection. The degree of vascular leakage was evaluated by the excessive red fluorescence-labeled microsphere beads that remained in the endothelium after flushing. The red fluorescent intensity was converted into fluorescent particles and the total area was quantified using Aivia. Scale bar = 50 µm. (E) Representative images of vascular permeability from WT, NG2HIF2α OE, and NG2HIF2α KO mice using Evans blue under normoxia or hypoxia. The blue dye leaked through the interstitial space and remained as blue patches after flushing (red arrows). Data information: Means ± SEM was derived from at least six biological replicates. *Depicts a statistically significant difference: *P < 0.05, **P < 0.01, and ***P < 0.001. Paired t test with a parametric test for (A) and one-way ANOVA with Turkey’s multiple comparisons test for the rest. Source data are available online for this figure.
Figure 6
Figure 6. HIF2α overexpression in pericyte-dominant transgenic mice exacerbates PH and RVH.
(A) RVSP and Fulton Index were measured on NG2HIF2α OE and NG2HIF2α KO mice with or without Hx. (B) Parasternal short-axis views at the mid-papillary level of the left ventricle in the diastole phase demonstrated an enlarged RV chamber in NG2HIF2α OE after 3-week hypoxia, but no RV size difference in NG2HIF2α KO mice. (C) RVFAC and RVFWT were measured by echocardiogram in NG2HIF2α OE and NG2HIF2α KO mice with or without Hx. (D, E) Pulmonary outflow PW Doppler tracings were used for quantification in PW Doppler tracings, PA peak velocity, PAT, and PAT/PET ratios, in NG2HIF2α OE and NG2HIF2α KO mice with or without Hx. (F) Representative images of sectioned hearts show the RV wall thickness from each group. Data information: means ± SEM was derived from at least four biological replicates. *Depicts a statistically significant difference: *P < 0.05, **P < 0.01, and ***P < 0.001 (one-way ANOVA with Turkey’s multiple comparisons test). Source data are available online for this figure.
Figure 7
Figure 7. HIF2α overexpression in tdT (PC-dominant) cells become SMC-like during vascular remodeling.
(A) The schematic figure represents tdTHIF2α OE cells differentiating into SMC-like cells and their translocation/recruitment towards the larger arterioles. (B) The diagram shows the construction design of NG2tdTHIF2α OE transgenic mice. (C) Precision-cut lung slices of NG2tdTHIF2α OE mice were stained with SMA (green) and DAPI (blue), representing the temporal translocation and SMA expression levels of tdTHIF2α OE cells after exposure to hypoxia on days 0, 2, 4, 7, 12, and 21. Scale bar = 50 µm. (D) Representative light-sheet microscopic images from iDISCO-cleared lung lobes showed 3D views of SMA-labeled lobes from NG2tdTHIF2α OE mice exposed to hypoxia. tdT was enhanced using RFP antibodies. The 3D structure of both lobes can be found in the supplemental Movies EV7 and 8. Scale bar = 1 mm. (E) Computational conversion of tdTHIF2α OE cells into 3D mesh structure was quantified (top row) using Aivia and images were combined with SMA-stained arterioles (bottom row). Scale bar = 50 µm. (F) The total number of meshes on the SMA-stained blood vessel at each time point (from C) was measured and the number of tdT-positive cells on the arterioles versus the total number of DAPI-positive cells on different sizes of vessels was quantified. Each group had at least 11 animals. Means ± SEM was derived from at least six biological replicates. * or # Depicts a statistically significant difference for vessels >50 μm size: **P < 0.01 and ***P < 0.001 (paired t test with parametric test compared to day 0). # depicts a statistically significant difference for vessels <15 μm size: #P < 0.05, ##P < 0.01, and ###P < 0.001 (paired t test with parametric test compared to day 0). Source data are available online for this figure.
Figure 8
Figure 8. HIF2α overexpression in pericyte-dominant transgenic mice attenuate the effects of PH with a HIF2α-related inhibitor.
(A) RVSP and Fulton Index were measured in NG2HIF2α OE mice with AMD3100 and their corresponding controls. (B) Precision-cut lung slices of NG2HIF2α OE mice in 3-week hypoxia with/without AMD3100 treatment were stained for CD31 (green), NG2 (red), and SMA (white) on the left and PDGFRβ (green), HIF2α (red), and SMA (white) on the right. Nuclei were stained with DAPI (blue). Corresponding control slices can be found in Fig. EV5. (C) The diagrams show the prevention and treatment models using AMD3100 and hypoxia on WT mice. (D) RVSP and Fulton Index were measured to evaluate the effectiveness of AMD3100 as a prevention or treatment against hypoxia-induced PH. (E) Precision-cut lung slices of WT mice in 3-week (left) and 6-week (right) hypoxia treated with AMD3100 as prevention or treatment strategies were stained for CD31 (green), NG2 (red), and SMA (white) with DAPI (blue) stained for nuclei. Data information: All scale bars = 50 µm. Means ± SEM was derived from at least six biological replicates. *Depicts a statistically significant difference: *P < 0.05, **P < 0.01, and ***P < 0.001 (one-way ANOVA with Turkey’s multiple comparisons test). Source data are available online for this figure.
Figure EV1
Figure EV1. 27 clusters are identified using human IPAH lung single-cell RNAseq.
(A) 27 distinct cell clusters were generated by Uniform Manifold Approximation and Projection (UMAP) plot from both human control and IPAH lungs by single-cell RNA-sequencing analysis. (B) The heatmap of expressed genes in clusters 10 and 13–26 was determined by the top gene expressions.
Figure EV2
Figure EV2. Four more control and Four more IPAH patient lung tissues were immunofluorescence stained using HIF2α (Green), 3G5 (Red), CD31 (Cyan), and nuclei were stained by DAPI (blue).
3G5 colocalized by HIF2α was indicated by arrows. The higher magnification images are on the bottom two rows. Scale bar =  50 µm.
Figure EV3
Figure EV3. RVSP measurements were performed on WT and NG2HIF2α OE female mice with or without 3-wk Hx.
*Depicts a statistically significant difference: *P < 0.05, **P < 0.01, and ***P < 0.001 (one-way ANOVA with Turkey’s multiple comparisons test).
Figure EV4
Figure EV4. Characterization of tdT cells in NG2tdTHIF2α OE lungs.
(A) tdT cells did not colocalize with Ki67 (cell proliferation marker) under normoxia and hypoxia over time (1 wk and 3-wk Hx), by comparing the precision-cut lung slices of NG2tdTHIF2α OE mice. Slices were stained for Ki67 (green), tdTamato (red), SMA (magenta) and DAPI (blue). (B) tdT cells closely contacted with CD31(Green) endothelial cells under normoxia and hypoxia over time (1 wk and 3-wk Hx). (C) tdT cells from both NG2tdT and NG2tdTHIF2α OE co-expressed PDGFRβ (White) under normoxia and 3-wk Hx. Yellow arrowheads indicate tdT wrapped around arterioles and co-expressed PDGFRβ. Scale bar = 50 µm.
Figure EV5
Figure EV5. Treatment of AMD3100 successfully prevents and alleviates vessel muscularization.
The precision-cut lung slices of WT mice in 3-wk (left) and 6-wk (right) hypoxia were stained for PDGFRβ (green), HIF2α (red), and SMA (white) with DAPI (blue) stained for nuclei. Scale bar = 50 µm.

References

    1. Abe K, Toba M, Alzoubi A, Ito M, Fagan KA, Cool CD, Voelkel NF, McMurtry IF, Oka M. Formation of plexiform lesions in experimental severe pulmonary arterial hypertension. Circulation. 2010;121:2747–54. - PubMed
    1. Baek SH, Maiorino E, Kim H, Glass K, Raby BA, Yuan K. Single cell transcriptomic analysis reveals organ specific pericyte markers and identities. Front Cardiovasc Med. 2022;9:876591. - PMC - PubMed
    1. Bergers G, Song S. The role of pericytes in blood-vessel formation and maintenance. Neuro Oncol. 2005;7:452–64. - PMC - PubMed
    1. Bordenave J, Thuillet R, Tu L, Phan C, Cumont A, Marsol C, Huertas A, Savale L, Hibert M, Galzi JL, Bonnet D, Humbert M, Frossard N, Guignabert C. Neutralization of CXCL12 attenuates established pulmonary hypertension in rats. Cardiovasc Res. 2020;116:686–697. - PubMed
    1. Brusselmans K, Compernolle V, Tjwa M, Wiesener MS, Maxwell PH, Collen D, Carmeliet P. Heterozygous deficiency of hypoxia-inducible factor-2alpha protects mice against pulmonary hypertension and right ventricular dysfunction during prolonged hypoxia. J Clin Investig. 2003;111:1519–27. - PMC - PubMed