

Global, regional, and national burden and quality of care index (QCI) of oral disorders: a systematic analysis of the global burden of disease study 1990-2017
- PMID: 38243206
- PMCID: PMC10799423
- DOI: 10.1186/s12903-023-03808-z
Global, regional, and national burden and quality of care index (QCI) of oral disorders: a systematic analysis of the global burden of disease study 1990-2017
Erratum in
-
Correction: Global, regional, and national burden and quality of care index (QCI) of oral disorders: a systematic analysis of the global burden of disease study 1990-2017.BMC Oral Health. 2024 May 2;24(1):512. doi: 10.1186/s12903-024-04236-3. BMC Oral Health. 2024. PMID: 38698369 Free PMC article. No abstract available.
Abstract
Background: Oral disorders are still a major global public health challenge, considering their perpetuating and chronic nature. Currently, there is no direct index to measure the quality of care on a population scale. Hence, we aim to propose a new index to measure the quality of care for oral disorders worldwide.
Methods: We generated our database using the data from the Global Burden of Disease (GBD) study 2017. Among different variables such as prevalence, incidence, years lived with disability, and disability-adjusted life years, we utilised principal component analysis (PCA) to determine the component that bears the greatest proportion of information to generate the novel quality of care index (QCI) for oral disorders.
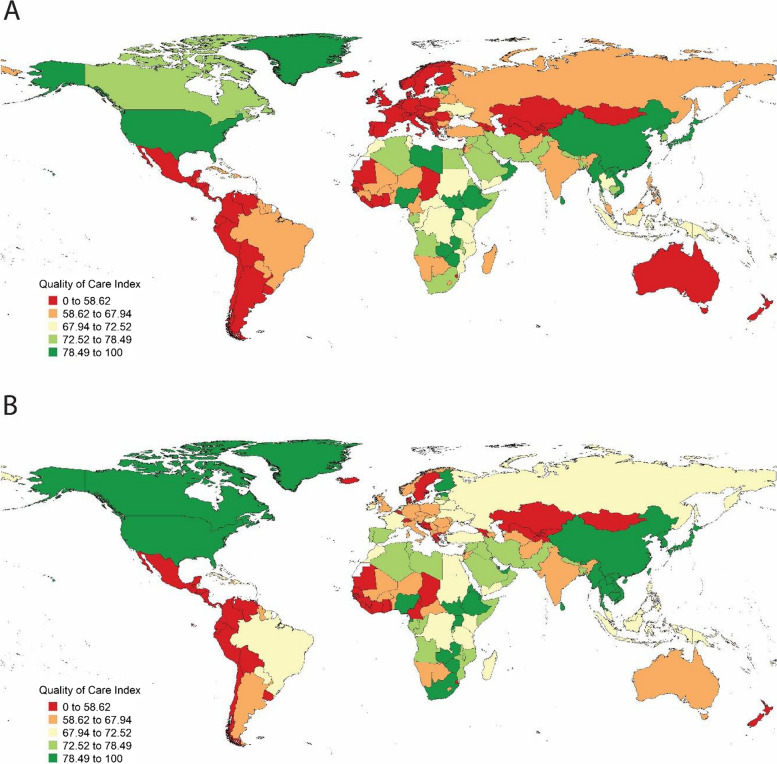
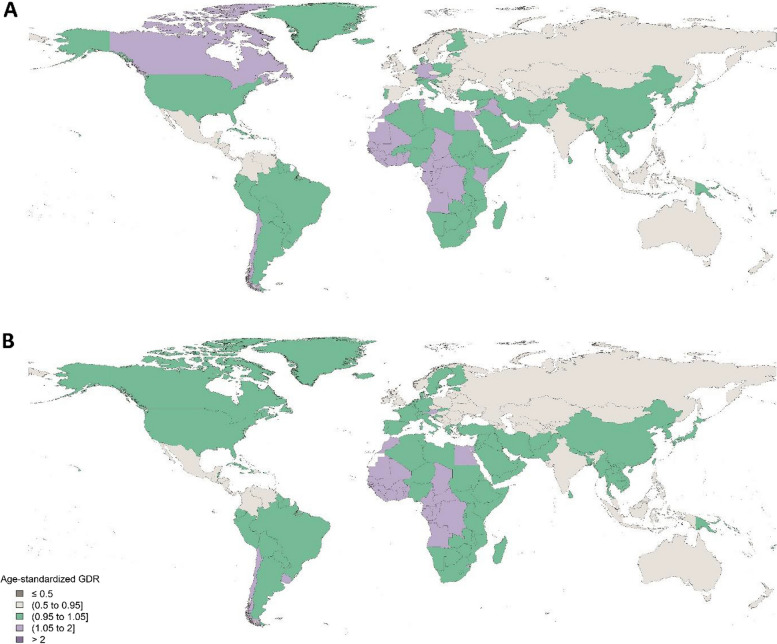
Results: Global QCI for oral disorders gradually increased from 1990 to 2017 (from 70.5 to 74.6). No significant gender disparity was observed during this period, and the gender disparity ratio (GDR) was considered optimal in 1990 and 2017. Between 1990 and 2017, the age-standardised QCI for all oral disorders increased in all the SDI regions. The highest QCI for all oral disorders in 2017 belonged to high-middle SDI countries (=80.24), and the lowest YLDs rate was seen in the low SDI quintile. In 1990, the quality of care in European, Central Asian, and Central and South American countries was in the lowest quintiles, whereas the North American, East Asian, Middle Eastern, and some African countries had the highest quality of dental care. Maynmar (=100), Uganda (=92.5), Taiwan (=92.0), China (=92.5), and the United States (=89.2) were the five countries with the highest age-standardised QCI. Nicaragua (=41.3), Belgium (=40.2), Venezuela (=38.4), Sierra Leone (=30.5), and the Gambia (=30.3) were the five countries with the least age-standardised QCI values.
Conclusion: The quality of care for all oral disorders showed an increasing trend on a global scale from 1990 to 2017. However, the QCI distribution was not homogenous among various regions. To prevent the exacerbation of imminent disparities in this regard, better attention to total tooth loss in high-income countries and prioritising primary healthcare provision in low-income countries are recommended for oral disorders.
Keywords: Burden of disease; Edentulism; Oral disorders; Periodontitis; Quality of care; Tooth caries.
© 2024. The Author(s).
Conflict of interest statement
Ahmad Sofi-Mahmudi is an editor at BMC Oral Health. Other authors have no competing interests.
Figures


References
-
- Shoaee S, Saeedi Moghaddam S, Masinaei M, Sofi-Mahmudi A, Hessari H, Heydari M-H, et al. Trends in dental caries of deciduous teeth in Iran: a systematic analysis of the national and sub-national data from 1990 to 2017. BMC Oral Health. 2022;22(1):634. doi: 10.1186/s12903-022-02634-z. - DOI - PMC - PubMed
-
- Kassebaum N, Smith A, Bernabé E, Fleming T, Reynolds A, Vos T, et al. Global, regional, and national prevalence, incidence, and disability-adjusted life years for oral conditions for 195 countries, 1990–2015: a systematic analysis for the global burden of diseases, injuries, and risk factors. J Dent Res. 2017;96(4):380–387. doi: 10.1177/0022034517693566. - DOI - PMC - PubMed
MeSH terms
LinkOut - more resources
Full Text Sources
Medical
