

Multimodal diagnosis model of Alzheimer's disease based on improved Transformer
- PMID: 38243275
- PMCID: PMC10799436
- DOI: 10.1186/s12938-024-01204-4
Multimodal diagnosis model of Alzheimer's disease based on improved Transformer
Abstract
Purpose: Recent technological advancements in data acquisition tools allowed neuroscientists to acquire different modality data to diagnosis Alzheimer's disease (AD). However, how to fuse these enormous amount different modality data to improve recognizing rate and find significance brain regions is still challenging.
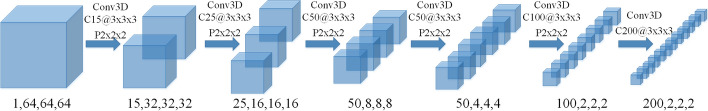
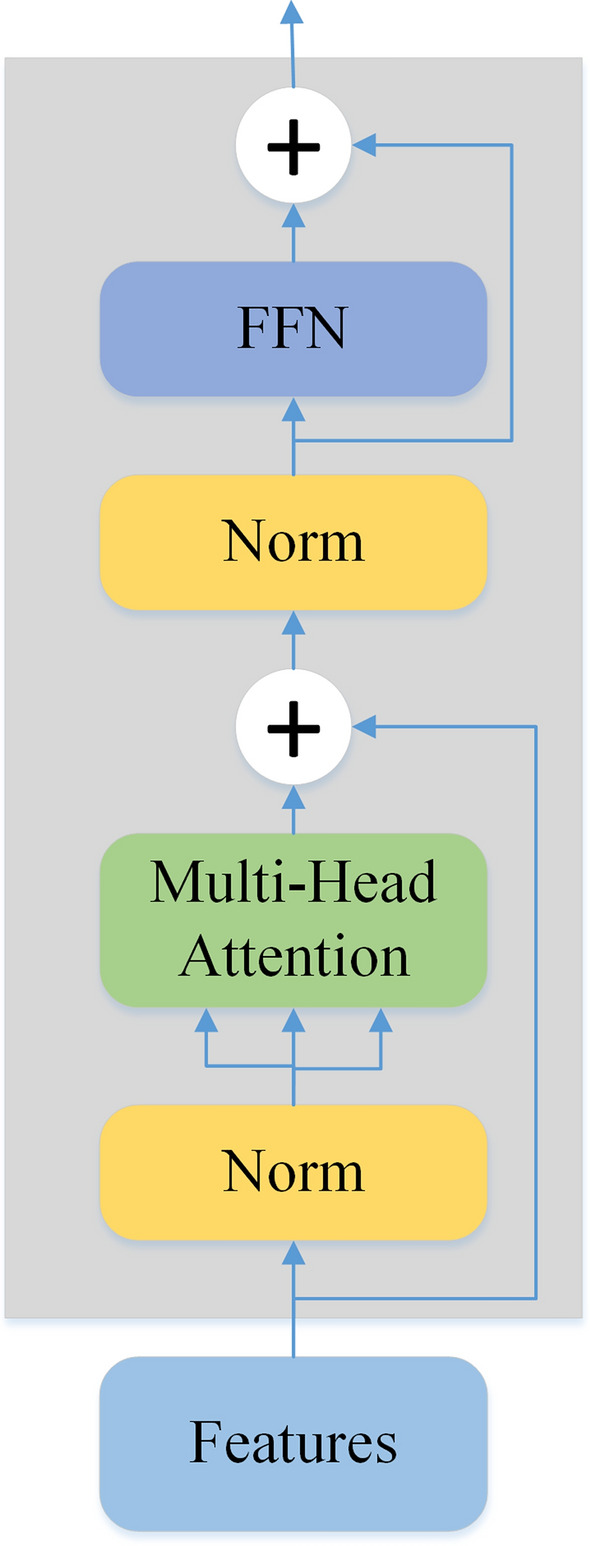
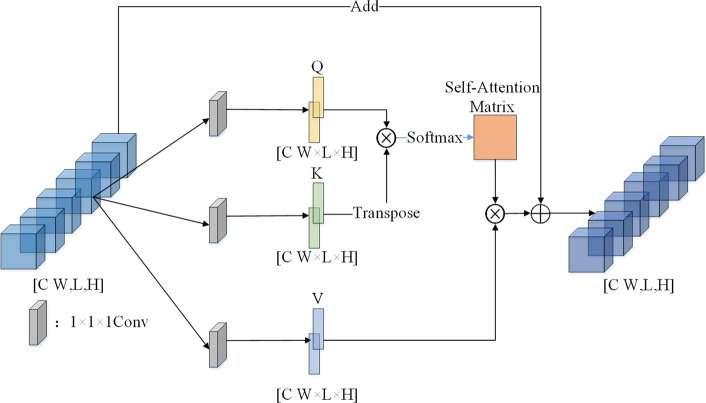
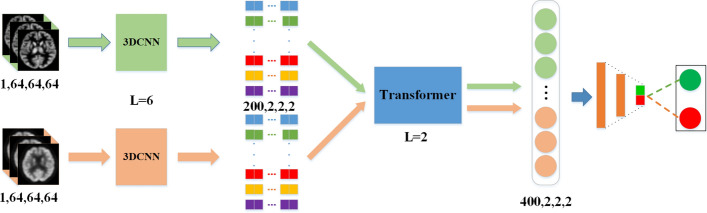
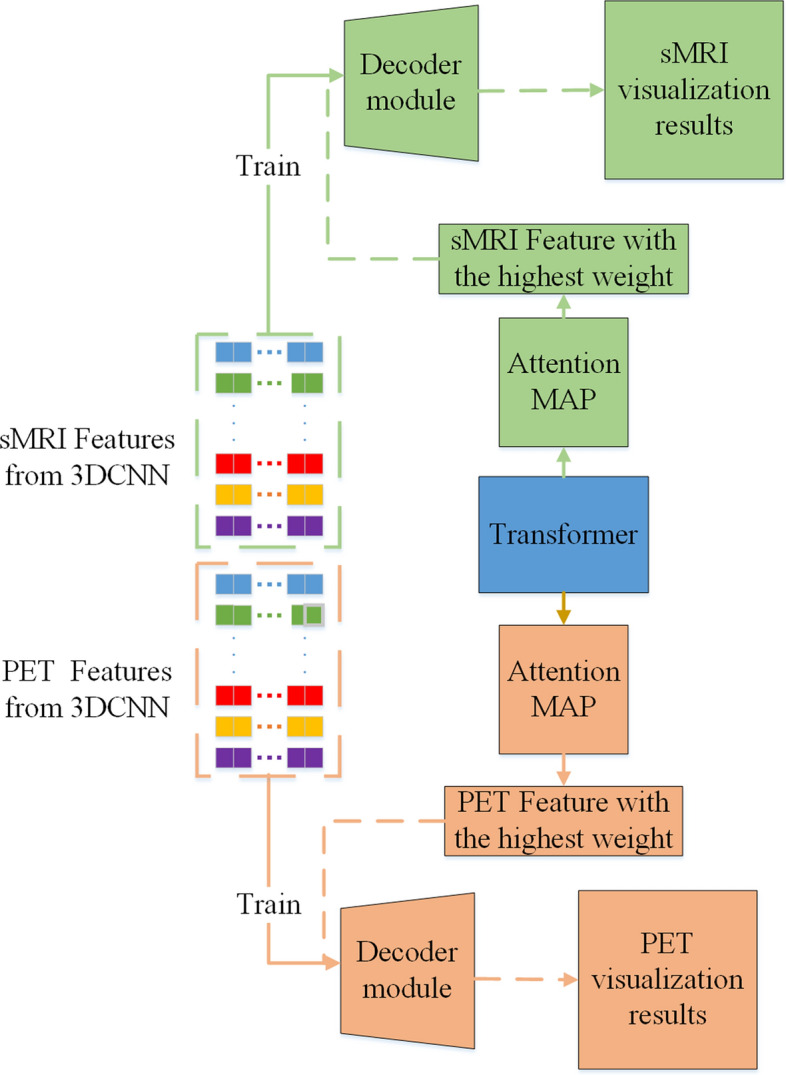
Methods: The algorithm used multimodal medical images [structural magnetic resonance imaging (sMRI) and positron emission tomography (PET)] as experimental data. Deep feature representations of sMRI and PET images are extracted by 3D convolution neural network (3DCNN). An improved Transformer is then used to progressively learn global correlation information among features. Finally, the information from different modalities is fused for identification. A model-based visualization method is used to explain the decisions of the model and identify brain regions related to AD.
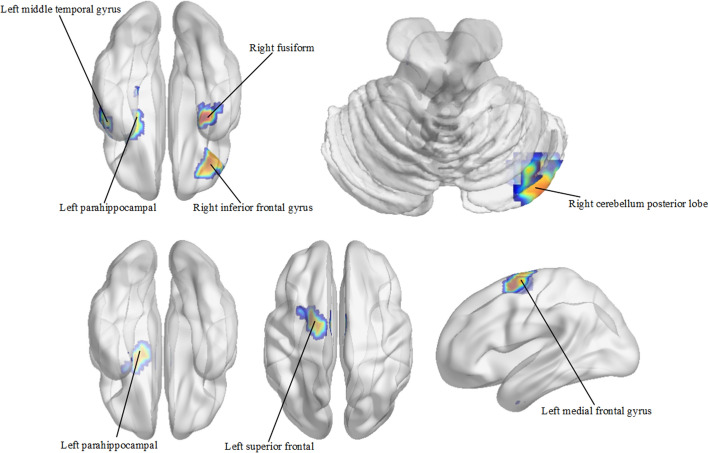
Results: The model attained a noteworthy classification accuracy of 98.1% for Alzheimer's disease (AD) using the Alzheimer's Disease Neuroimaging Initiative (ADNI) dataset. Upon examining the visualization results, distinct brain regions associated with AD diagnosis were observed across different image modalities. Notably, the left parahippocampal region emerged consistently as a prominent and significant brain area.
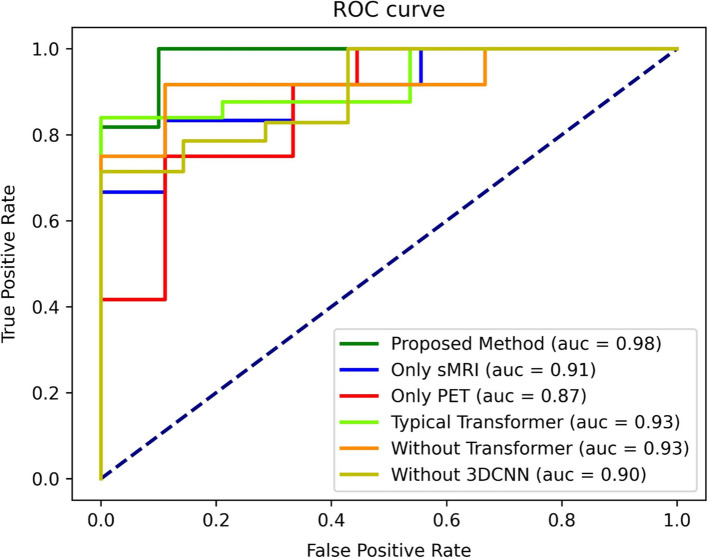
Conclusions: A large number of comparative experiments have been carried out for the model, and the experimental results verify the reliability of the model. In addition, the model adopts a visualization analysis method based on the characteristics of the model, which improves the interpretability of the model. Some disease-related brain regions were found in the visualization results, which provides reliable information for AD clinical research.
Keywords: 3DCNN; Alzheimer’s disease; Deep learning; Multimodal medical images; Transformer; Visualization.
© 2024. The Author(s).
Conflict of interest statement
The authors declare that they have no conflict of interest.
Figures
Similar articles
-
Multi-Modality Cascaded Convolutional Neural Networks for Alzheimer's Disease Diagnosis.Neuroinformatics. 2018 Oct;16(3-4):295-308. doi: 10.1007/s12021-018-9370-4. Neuroinformatics. 2018. PMID: 29572601
-
Multi-scale multimodal deep learning framework for Alzheimer's disease diagnosis.Comput Biol Med. 2025 Jan;184:109438. doi: 10.1016/j.compbiomed.2024.109438. Epub 2024 Nov 22. Comput Biol Med. 2025. PMID: 39579666
-
Multimodal transformer network for incomplete image generation and diagnosis of Alzheimer's disease.Comput Med Imaging Graph. 2023 Dec;110:102303. doi: 10.1016/j.compmedimag.2023.102303. Epub 2023 Sep 30. Comput Med Imaging Graph. 2023. PMID: 37832503
-
A review of multimodal fusion-based deep learning for Alzheimer's disease.Neuroscience. 2025 Jun 7;576:80-95. doi: 10.1016/j.neuroscience.2025.04.035. Epub 2025 Apr 24. Neuroscience. 2025. PMID: 40286904 Review.
-
Optimizing Use of Neuroimaging Tools in Evaluation of Prodromal Alzheimer's Disease and Related Disorders.J Alzheimers Dis. 2020;77(3):935-947. doi: 10.3233/JAD-200487. J Alzheimers Dis. 2020. PMID: 32804147 Review.
Cited by
-
An experimental framework for conjoint measures of olfaction, navigation, and motion as pre-clinical biomarkers of Alzheimer's disease.J Alzheimers Dis Rep. 2024 Dec 23;8(1):1722-1744. doi: 10.1177/25424823241307617. eCollection 2024. J Alzheimers Dis Rep. 2024. PMID: 40034341 Free PMC article. Review.
-
Recent Advancements in Neuroimaging-Based Alzheimer's Disease Prediction Using Deep Learning Approaches in e-Health: A Systematic Review.Health Sci Rep. 2025 May 5;8(5):e70802. doi: 10.1002/hsr2.70802. eCollection 2025 May. Health Sci Rep. 2025. PMID: 40330773 Free PMC article. Review.
-
A Feature-Fusion Technique-Based Alzheimer's Disease Classification Using Magnetic Resonance Imaging.Diagnostics (Basel). 2024 Oct 23;14(21):2363. doi: 10.3390/diagnostics14212363. Diagnostics (Basel). 2024. PMID: 39518331 Free PMC article.
References
-
- Gauthier S, Webster C, Servaes S, Morais J, Rosa-Neto P. World Alzheimer report 2022: life after diagnosis: navigating treatment, care and support. London: Alzheimer’s Disease International London; 2022.
-
- Shoeibi A, Khodatars M, Jafari M, Ghassemi N, Moridian P, Alizadesani R, Ling SH, Khosravi A, Alinejad-Rokny H, Lam H. Diagnosis of brain diseases in fusion of neuroimaging modalities using deep learning: a review. Inf Fus. 2022;93:85–117. doi: 10.1016/j.inffus.2022.12.010. - DOI
-
- McEvoy LK, Fennema-Notestine C, Roddey JC, Hagler DJ, Jr, Holland D, Karow DS, Pung CJ, Brewer JB, Dale AM. Alzheimer disease: quantitative structural neuroimaging for detection and prediction of clinical and structural changes in mild cognitive impairment. Radiology. 2009;251(1):195–205. doi: 10.1148/radiol.2511080924. - DOI - PMC - PubMed
MeSH terms
Grants and funding
LinkOut - more resources
Full Text Sources
Medical
